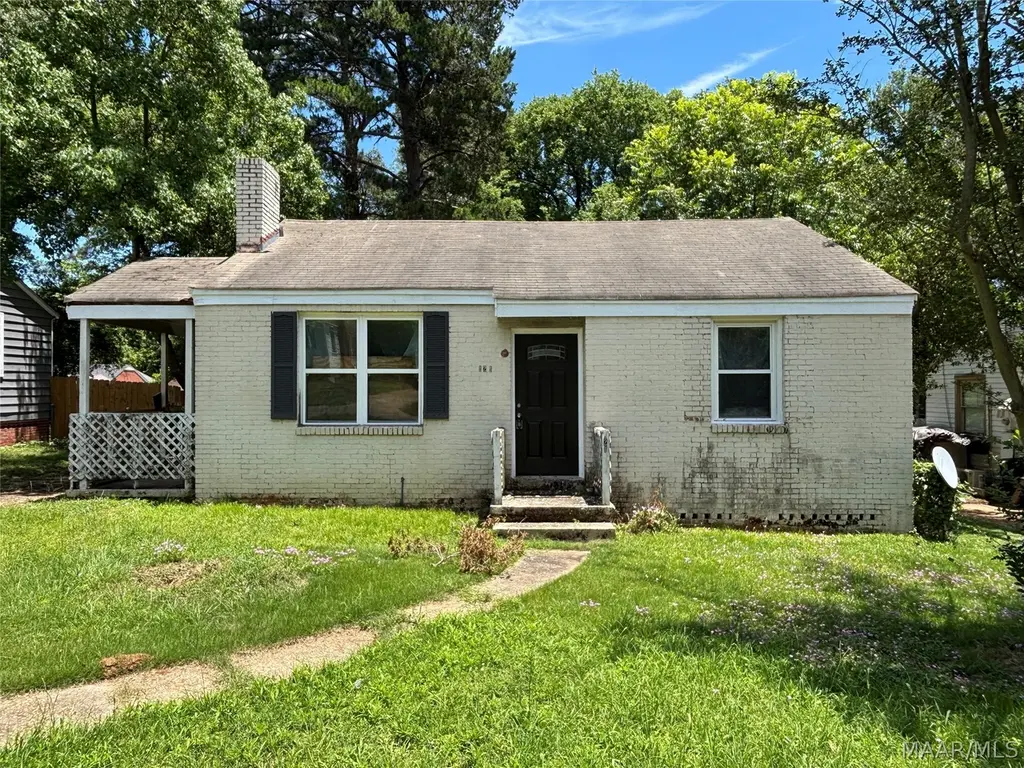
121 Bradley Dr · Montgomery, AL
Flood risk 1/10 · Minimal
- FEMA flood zone
- X (unshaded)
- Chance of flooding over 30 yrs
- 0.0%
- Est. flood insurance / yr
- $473 – $860
Fire risk 1/10 · Minimal
- Est. fire insurance / yr
- $916 – $1,700
Heat risk 7/10 · Major
- Hot days now (above 107°F)
- 6 days/yr
- Hot days in 30 yrs
- 17 days/yr
Wind risk 8/10 · Major
- Chance of severe wind over 30 yrs
- 80.0%
Air-quality risk 3/10 · Minor
- Unhealthy air days now
- 4 days/yr
- Unhealthy air days in 30 yrs
- 4 days/yr
Risk factors via First Street. Map © Google.
Why this score? — see what drove the B+ grade
The composite is a weighted blend of 9 inputs, each scored 0–100. Each bar is that input's sub-score; the figure is the points it added to the 100-point composite (weight × sub-score).
- Cash flow +30.0/30.0
- ARV discount +15.0/15.0
- 1% rule +10.0/10.0
- DSCR +10.0/10.0
- Rent growth +3.2/5.0
- Livability +3.2/5.0
- Condition / age +2.5/5.0
- Schools +1.7/10.0
- Appreciation +0.0/10.0
$49,000
🖨 Deal sheet 📄 Offer letter ✓ Due diligence
Listing remarks MLS
Under contract at listing.
Key facts
- New plumbing
- Separate laundry
- Large kitchen
Tags
Property features AI
Exterior
- Parking: Driveway
- Utilities: Cable available; Electricity available; Natural gas available; High-speed internet available; Public water; Public sewer
- Home design: Single-story home; Basement foundation; Brick construction
- Construction: Brick exterior; Basement foundation; Built (year per public records)
- Exterior features: Covered porch; Porch; Storage; City lot with mature trees; Lot dimensions approximately 55 x 150
Interior
- Kitchen: Kitchen with dining combo
- Bedrooms: Bedroom on the first level
- Flooring: Tile; Wood
- Bathrooms: 1 full bathroom on the first level
- Heating & cooling: Central heating (gas); Central electric air conditioning
- Interior features: Linen closet; Tile and wood flooring; Unfinished basement; One fireplace
- Laundry & utility: Washer hookup; Dryer hookup; Gas water heater
Neighborhood map
What this means for you Summary
Snapshot
- This is a 3-bed/1.0-bath single-family listed at $49k.
Deal economics
- At list price, monthly cash flow is $617 ($7k/yr) — positive.
- The deal already cash-flows at list — no discount required.
- Meets the 1% rule at list price ($1k rent vs $49k).
- Cap rate 21.4% vs local median 6.0% in Montgomery — top-decile yield for the area; either an underpriced asset or a hidden risk that comps aren't pricing in. Stress-test before assuming the spread holds.
Location & tenants
- Location reads 65/100 on livability (#138 in AL) — a middle-class / working-renter tenant base. Strengths: cost of living A+, housing A+; Watch: schools C-, employment D, crime F.
- Montgomery County (urban): math 9% / reading 31% proficiency, ranked #106 of 129 in AL (top 82%) — low school quality limits family demand, transient renter base, plan for 1-2y turnover; 70% free/reduced lunch — lower-income household profile, screen leases tightly.
- Market conditions: Rents rising (+2.6%/yr); 207 active listings in the ZIP; 40 comparable units currently listed for rent nearby; rentals lingering (median 44d on market — plan ~5-8 weeks vacancy on turnover, expect pricing pressure); 55% of comp listings sitting > 30 days — soft ceiling on asking rent; 460 units permitted in Montgomery County in 2024 (37 in 5+ unit buildings).
Forward outlook
- Local home prices are declining (-3.0%/yr); year-one equity from $339 of loan paydown is wiped out by about $1k of value loss. Plan a longer hold.
- Montgomery County population projected to shrink 8% by 2050 — rents likely to lag national; underwrite the cash flow, not the appreciation.
- At projected returns (-3.0% appreciation + 2.6% rent growth), your $14k cash investment doubles in ~3 years — after that, you're playing with house money.
Negotiation context
- Only 13 days on market — expect competitive offers; lowballing is unlikely to land.
- 5 sale attempts since 21y ago with the ask held roughly flat each time — persistent listings suggest the price (not the market) is what's stuck; bring a comps-based counter.
- Current owner paid $23k; list at $49k implies a 113% gain — meaningful room to come down on a strong offer.
Risks & watch-outs
- Watch-outs: built in 1951 — expect roof / HVAC / electrical / plumbing capex.
- Climate carrying-cost: severe wind risk, 80% chance of damaging wind over 30y; extreme-heat days projected 6→17/yr by 2055 (HVAC capex compounding) — expect insurance premiums to compound above CPI over the hold.
Questions for the listing agent
- Built in 1951 — when were the roof, HVAC, electrical panel, plumbing, and water heater last replaced?
- Is there a deadline driving the sale (1031 exchange, divorce, estate, relocation)? That informs how much negotiation room exists.
- Crime grade is F in this area — have there been break-ins, vandalism, or insurance claims at this property in the last 3 years? What carrier currently insures it and at what premium?
- What's the average days-on-market for RENTAL listings here right now (not sales)? A rising rental-DOM trend means longer vacancies and softer asking-rent achievability than the comps imply.
- What's the recent tenant-quality profile in this submarket — average credit score on applications, eviction rate, late-payment / NSF rate, and stable-employment percentage? A property-management company in the area should have these aggregated.
- How much new for-sale + rental construction is in the pipeline within 1–3 miles? Heavy new supply typically softens prices + rents 12–24 months out; constrained supply supports both.
Investment metrics
- 1% rule
- 2.39% ✓
- Cap rate
- 21.41%
- Cash-on-cash
- 54.00%
- DSCR
- 3.40
- GRM
- 3.5
CMA / ARV
- ARV (on-the-fly)
- $75,810
- Comps found
- 12
Show comp detail 12 sales within ~0.75 mi
| Address | Dist | Beds/Ba | Sqft | Sold | Price | $/sf | Match |
|---|---|---|---|---|---|---|---|
| 13 Oak Forest Dr | 0.24mi | 2/1.0 (-1) | 1,110 (+2%) | 2mo | $46,500 | $42 | 78 |
| 137 Oak Forest Dr | 0.08mi | 2/1.0 (-1) | 1,183 (+9%) | 0mo | $47,000 | $40 | 76 |
| 2318 Winona Ave | 0.47mi | 2/1.0 (-1) | 1,118 (+3%) | 2mo | $89,000 | $80 | 66 |
| 111 Bradley Dr | 0.05mi | 3/2.0 | 1,222 (+13%) | 8mo | $8,000 | $7 | 66 |
| 3010 Althea St | 0.24mi | 3/1.5 | 1,186 (+10%) | 7mo | $40,000 | $34 | 65 |
| 3405 Vermont Dr | 0.57mi | 3/1.5 | 1,061 (-2%) | 6mo | $88,000 | $83 | 63 |
| 302 Whetstone Dr | 0.36mi | 2/1.0 (-1) | 1,025 (-5%) | 8mo | $72,000 | $70 | 63 |
| 3 Oak Frst | 0.29mi | 2/1.0 (-1) | 940 (-13%) | 2mo | $105,000 | $112 | 58 |
| 2414 Chapman St | 0.60mi | 2/1.0 (-1) | 1,026 (-5%) | 4mo | $39,000 | $38 | 55 |
| 2050 Yancey Ave | 0.73mi | 3/2.0 | 1,040 (-4%) | 8mo | $95,000 | $91 | 49 |
| 2933 Willow Lane Dr | 0.43mi | 3/2.0 | 1,234 (+14%) | 6mo | $121,000 | $98 | 48 |
| 238 Easthaven Rd | 0.73mi | 3/2.0 | 1,188 (+10%) | 5mo | $77,900 | $66 | 42 |
Match score weights: distance 35% · size 25% · config 20% · recency 20%. Top-matched comps best support the ARV.
Projected returns pro-forma
-3.0% appreciation · 2.65% rent growth · sell at horizon
- IRR
- 51.8%
- Equity multiple
- 3.26×
- Total profit
- $30,970
- Equity at exit
- $7,306
- IRR
- 56.9%
- Equity multiple
- 6.53×
- Total profit
- $75,920
- Equity at exit
- $4,237
Cash invested: $13,720 (down + closing). Projections, not guarantees.
Landlord ↔ Tenant lean methodology
- Overall (STATE)
- 90 Strongly Landlord-Friendly
- State Alabama
- 90 Strongly Landlord-Friendly · R+15
- County
- — inherits STATE
- City
- — inherits STATE
ZIP-level market 36109
- Home prices YoY
- -20.1%
- Rents YoY
- 2.6%
- Active inventory
- 207
- Price-to-rent
- 3.5×
Monthly cashflow live
- Estimated rent
- $1,170 high interval (Pro) →
- Mortgage (P&I)
- −$257
- Tax from tax record
- −$29 /mo · $350/yr
- Insurance
- −$20
- HOA
- −$0
- Vacancy / Maint / Mgmt
- −$246
- Net cashflow
- $617
Break-even live
UW: 25.0% down · 7.5% · 30yr · 1.5% tax · 5.0% vac · 8.0% maint · 8.0% mgmt
Financing live
Cash to close
- Down payment
- $12,250
- Closing costs
- $1,470
- Reserves months
- —
- Total cash needed
- —
Loan-product check · same deal, 3 products live
Conventional
25% down · 7.5% · 30yr
- Down + closing
- —
- Monthly P&I
- —
- Monthly cashflow
- —
- DSCR
- —
- Eligible?
- —
Personal DTI + credit; lowest rate.
DSCR
20% down · 8.5% · 30yr
- Down + closing
- —
- Monthly P&I
- —
- Monthly cashflow
- —
- DSCR
- —
- Eligible?
- —
No personal income docs; deal must DSCR.
Hard money
10% down · 12.0% · 12mo
- Down + closing
- —
- Monthly P&I
- —
- Monthly cashflow
- —
- DSCR
- —
- Eligible?
- —
Short-term bridge; refi at stabilization.
Rent comps 40 comps
| Address | Beds | Baths | Sqft | Rent | $/sqft | DOM | Units | Dist |
|---|---|---|---|---|---|---|---|---|
| 319 Olivia Ct Montgomery, AL | 2.0 | 1.0 | 850 | $700 | $0.82 | 21d | 1 | 0.06mi |
| 122 Oak Forest Dr Montgomery, AL | 3.0 | 1.0 | 1092 | $975 | $0.89 | 21d | 1 | 0.07mi |
| 301 Bradley Dr Montgomery, AL | 2.0 | 1.0 | 841 | $935 | $1.11 | 13d | 1 | 0.14mi |
| 311 Bradley Dr Montgomery, AL | 3.0 | 1.0 | 1104 | $825 | $0.75 | 43d | 1 | 0.19mi |
| 15 Bradley Dr Montgomery, AL | 3.0 | 2.0 | 1365 | $1,500 | $1.10 | 21d | 1 | 0.22mi |
| 7 Calhoun Rd Unit B Montgomery, AL | 2.0 | 1.0 | 961 | $850 | $0.88 | 43d | 1 | 0.41mi |
| 2229 Madison Ave Montgomery, AL | 2.0 | 1.0 | 1100 | $625 | $0.57 | 43d | 1 | 0.46mi |
| 3233 Hillcrest Ln Montgomery, AL | 3.0 | 2.0 | 1278 | $1,395 | $1.09 | 21d | 1 | 0.50mi |
| 3319 Willow Lane Dr Montgomery, AL | 3.0 | 2.0 | 1032 | $1,200 | $1.16 | 43d | 1 | 0.52mi |
| 2310 Yancey Ave Montgomery, AL | 3.0 | 1.0 | 1212 | $1,250 | $1.03 | 43d | 1 | 0.53mi |
| 2113 Brewton St Montgomery, AL | 3.0 | 1.0 | 1363 | $1,150 | $0.84 | 43d | 1 | 0.53mi |
| 3329 Vermont Dr Montgomery, AL | 3.0 | 1.5 | 1465 | $1,395 | $0.95 | 13d | 1 | 0.53mi |
| 2243 Winona Ave Montgomery, AL | 3.0 | 1.0 | 1492 | $1,225 | $0.82 | 21d | 1 | 0.54mi |
| 3334 Cottonwood Dr Montgomery, AL | 3.0 | 2.0 | 1025 | $1,295 | $1.26 | 13d | 1 | 0.58mi |
| 108 Calhoun Rd Unit 108B Montgomery, AL | 2.0 | 1.0 | 1350 | $750 | $0.56 | 43d | 1 | 0.60mi |
| 239 Forest Hills Dr Montgomery, AL | 4.0 | 1.5 | 1500 | $1,450 | $0.97 | 21d | 1 | 0.65mi |
| 3515 Cottonwood Dr Montgomery, AL | 3.0 | 1.5 | 1246 | $1,350 | $1.08 | 43d | 1 | 0.74mi |
| 2122 Windsor Ave Montgomery, AL | 2.0 | 1.0 | 1052 | $725 | $0.69 | 43d | 1 | 0.75mi |
| 2009 Yancey Ave Montgomery, AL | 3.0 | 1.0 | 1140 | $1,080 | $0.95 | 21d | 1 | 0.79mi |
| 67 Holliday Dr Montgomery, AL | 3.0 | 1.0 | 1156 | $1,200 | $1.04 | 43d | 1 | 0.80mi |
| 3136 Harrison Rd Montgomery, AL | 3.0 | 1.5 | 1355 | $1,025 | $0.76 | 43d | 1 | 0.80mi |
| 1827 Capitol Ave Montgomery, AL | 2.0 | 1.0 | 1068 | $1,600 | $1.50 | 13d | 1 | 0.83mi |
| 1827 Capitol Ave Montgomery, AL | 2.0 | 1.0 | 1068 | $1,600 | $1.50 | 43d | 1 | 0.83mi |
| 200 Eton Rd Montgomery, AL | 3.0 | 1.5 | 1500 | $895 | $0.60 | 13d | 1 | 0.83mi |
| 2009 Palmetto St Montgomery, AL | 3.0 | 1.0 | 1487 | $1,050 | $0.71 | 43d | 1 | 0.84mi |
| 2023 Windsor Ave Montgomery, AL | 2.0 | 1.0 | 889 | $895 | $1.01 | 43d | 1 | 0.84mi |
| 186 E Salem Dr Montgomery, AL | 3.0 | 1.0 | 1040 | $1,195 | $1.15 | 21d | 1 | 0.86mi |
| 517 N Florida St Unit B Montgomery, AL | 2.0 | 1.0 | 900 | $750 | $0.83 | 43d | 1 | 0.92mi |
| 3602 Little John Dr Montgomery, AL | 4.0 | 1.0 | 1286 | $1,400 | $1.09 | 21d | 1 | 0.92mi |
| 118 Nottingham Ct Montgomery, AL | 3.0 | 2.0 | 1344 | $1,275 | $0.95 | 43d | 1 | 0.93mi |
| 424 N California St Apt D Montgomery, AL | 2.0 | 1.0 | 850 | $778 | $0.92 | 21d | 1 | 0.94mi |
| 3323 Bedford Ln Montgomery, AL | 3.0 | 2.0 | 1134 | $1,200 | $1.06 | 21d | 1 | 0.96mi |
| 2000 Cherry St Montgomery, AL | 2.0 | 1.0 | 1106 | $950 | $0.86 | 43d | 1 | 0.97mi |
| 3346 Bedford Ln Montgomery, AL | 3.0 | 1.0 | 1134 | $1,295 | $1.14 | 13d | 1 | 1.01mi |
| 39 S Lewis St Montgomery, AL | 2.0 | 1.0 | 1209 | $950 | $0.79 | 43d | 1 | 1.06mi |
| 688 Joryne Dr Montgomery, AL | 3.0 | 2.0 | 1500 | $1,200 | $0.80 | 43d | 1 | 1.09mi |
| 2454 Spruce Curv Montgomery, AL | 3.0 | 1.0 | 988 | $1,100 | $1.11 | 43d | 1 | 1.10mi |
| 3318 Habersham Rd Montgomery, AL | 3.0 | 2.0 | 1134 | $1,250 | $1.10 | 13d | 1 | 1.11mi |
| 3456 Harrison Rd Montgomery, AL | 3.0 | 1.0 | 1008 | $1,300 | $1.29 | 43d | 1 | 1.13mi |
| 1117 Karen Rd Montgomery, AL | 3.0 | 1.0 | 1308 | $1,195 | $0.91 | 43d | 1 | 1.20mi |
Listing history 11 events
-
2026-06-18days on market $49,000 Active 13 DOM
-
2026-06-17days on market $49,000 Active 12 DOM
-
2026-06-16days on market $49,000 Active 11 DOM
-
2026-06-15days on market $49,000 Active 10 DOM
-
2026-06-14days on market $49,000 Active 8 DOM
-
2026-06-13days on market $49,000 Active 7 DOM
-
2026-06-10days on market $49,000 Active 5 DOM
-
2026-06-09days on market $49,000 Active 4 DOM
-
2026-06-08days on market $49,000 Active 3 DOM
-
2026-06-07remarks 335-char remark
-
2026-06-07$49,000 Active 2 DOM
ⓘ Source: listings_history table (triggers on properties + properties_extension) + one-shot
backfill from property_details.listing_events for pre-trigger history.
Tax reassessment forecast AL · Resets to sale price
- Current annual tax
- $350 · $29/mo
- Projected year-2 tax
- $350 · $29/mo
- Expected delta
- $0/yr ($0/mo · 0.0%)
ⓘ Screening estimate from a state-policy table — verify with the county assessor before closing.
Climate risk First Street
- Flood 1/10 Low FEMA zone X (unshaded) · 0% chance over 30 yrs
- Wildfire 1/10 Low
- Heat 7/10 Severe 6 d/yr ≥107°F today · 17 d/yr by 30 yrs out
- Wind 8/10 Severe 80% chance of damaging wind over 30 yrs
- Air quality 3/10 Moderate 4 unhealthy d/yr today · 4 by 30 yrs out
Nearby sold comps map
Loading sold comps map…
Walkable amenities ~0.75 mi
Loading nearby amenities…
Taxation est. · year 1
- Rental income
- $14,035
- − Mortgage interest
- −$2,745
- − Property taxes
- −$350
- − Insurance
- −$245
- − Repairs & maintenance
- −$1,123
- − Management
- −$1,123
- − Depreciation
- −$1,425
- Taxable income
- $7,024
- Est. tax owed @ 24.0%
- −$1,686
- After-tax cash flow
- $5,723/yr
For passive investors: Depreciation is non-cash, so a rental often shows a tax loss while cash-flowing — sheltering income. Rental losses are passive: they offset passive income freely, and up to $25,000/yr can offset ordinary (W-2) income if you actively participate and your MAGI is under $100k (phasing out to $0 by $150k); unused losses carry forward. On sale, claimed depreciation is recaptured at up to 25%, and gains may owe capital-gains tax (a 1031 exchange can defer both). Figures are a year-1 estimate at your 24.0% rate — not tax advice; consult a CPA.
Schools (NCES district)
- District
- Montgomery County
- NCES district ID
- 0102430
- Math proficiency
- 9% ▼ -21.00%
- Reading proficiency
- 31% ▼ -1.00%
- Median HH income
- $43,902
- Composite
- 17.24/100
- National rank
- #9093
- State rank
- #106 of 129 in AL
Livability — Montgomery
- Score
- 65/100
- State rank
- #138
- US rank
- #13416
Category grades
Schools grade is shown separately in the Schools card above.
Census & demographics
- Census place
- Montgomery, AL
- County
- Montgomery County · 190,016 people
- City population
- 175,913
- Metro
- Montgomery, AL
- Population (ZIP)
- 23,581
- Household income
- $59,193
- Rent vs Own
- Severe rent burden
- 1039.0
Population outlook (Montgomery County) Hauer SSP2
- Today (2025)
- 224,008 people
- By 2030
- 221,460 · -1.1%
- By 2040
- 214,179 · -4.4%
- By 2050
- 204,912 · -8.5%
- By 2075
- 177,821 · -20.6%
- By 2100
- 145,134 · -35.2%
Race, ethnicity, and origin ACS 2023
- Neighborhood character
- Diverse neighborhood (Simpson 0.60)
- Race & ethnicity
- White 49% Black 39% Hispanic / Latino 8% Two or more races 4%
- Hispanic origin (detail)
- Mexican 4%
- Common ancestry
- Slovak 2% Lithuanian 1% Serbian 1%
- Foreign-born
- 4% · Canada, South Korea
- Languages at home
- 94% English-only · Spanish 5%
Political lean MEDSL · Montgomery
- 2024 margin
- Solid D (+30.7) · D 64.8% · R 34.1% · Other 1.1%
- 2008→2024 swing
- +11.5pp toward D · 2008: 19.2pp · 2024: 30.7pp
- All cycles
- 2024: D+30.7 2020: D+31.5 2016: D+26.2 2012: D+24.3 2008: D+19.2
Not yet ingested
- Civics
- —
Market trends
- HPI YoY
- ▼ -37.64%
- Current HPI
- 149.3867
- Rent YoY
- ▲ 2.65%
- Metro
- Montgomery, AL
- State GDP YoY
- ▲ 2.94%
- F500 in state
- 4
Industry mix (Fortune 500 HQ in AL)
| Industry | F500 HQs | Revenue |
|---|---|---|
| Financial Services | 1 | $8B |
|
||
| Healthcare | 1 | $5B |
|
||
Price history
-26.9% since first listed8 events — show timeline
- 2026-06-05 Listed $49,000 MAAR
- 2015-09-22 Sold (MLS) $23,000 MAAR
- 2015-09-10 Listed $23,000 MAAR
- 2013-03-20 Sold (MLS) $21,000 MAAR
- 2013-01-08 Listed $24,900 MAAR
- 2012-01-31 Listed $24,000 MAAR
- 2005-03-03 Sold (MLS) $64,500 MAAR
- 2005-01-20 Listed $67,000 MAAR
Property tax history
+0.7%/yrLatest (2025): $350 · +0.0% YoY. Source: county tax records.
Cash-flow waterfall
monthlySold comps — $/sqft
last 12 mo · ≤1 miLoading sold comps…