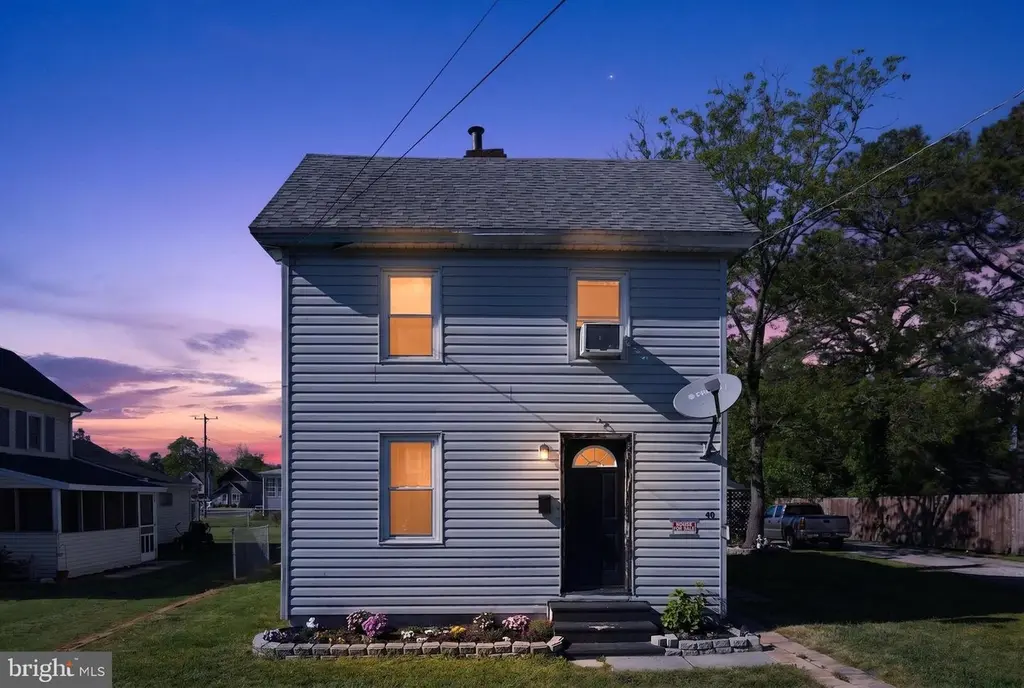
40 W Chesapeake Ave · Crisfield, MD
Flood risk 10/10 · Severe
- FEMA flood zone
- AE
- Chance of flooding over 30 yrs
- 0.99%
- Est. flood insurance / yr
- $1,737 – $8,500
Fire risk 4/10 · Minor
- Est. fire insurance / yr
- $755 – $1,403
Heat risk 9/10 · Severe
- Hot days now (above 101°F)
- 7 days/yr
- Hot days in 30 yrs
- 19 days/yr
Wind risk 8/10 · Major
- Chance of severe wind over 30 yrs
- 80.0%
Air-quality risk 2/10 · Minimal
- Unhealthy air days now
- 1 days/yr
- Unhealthy air days in 30 yrs
- 2 days/yr
Risk factors via First Street. Map © Google.
Why this score? — see what drove the A- grade
The composite is a weighted blend of 9 inputs, each scored 0–100. Each bar is that input's sub-score; the figure is the points it added to the 100-point composite (weight × sub-score).
- Cash flow +30.0/30.0
- ARV discount +15.0/15.0
- DSCR +10.0/10.0
- Appreciation +10.0/10.0
- 1% rule +7.6/10.0
- Livability +3.4/5.0
- Rent growth +2.5/5.0
- Condition / age +2.5/5.0
- Schools +1.5/10.0
$85,000
🖨 Deal sheet 📄 Offer letter ✓ Due diligence
Listing remarks
Classic 2-bedroom home with oversized yard space, solid bones, and room to make it your own near downtown Crisfield. Set on a generous lot with a wide front lawn and expansive backyard, this 2-bedroom, 1-bath home gives you the chance to create value while enjoying the character of a traditional Eastern Shore property. Inside, the living room and bedrooms are well-sized to provide flexibility for guests, hobbies, or work-from-home space. The kitchen and bathroom are functional and ready for everyday use, with plenty of opportunity for cosmetic updates and customization over time. Throughout the home, you’ll find a layout that offers a strong starting point for renovations without losi
Key facts
- Modern kitchen
- Oversized island
- 0.26 acre lot
Tags
Property features AI
Finance
- Other: Located in a federal flood zone; Property is in city limits (Crisfield)
Exterior
- Parking: Off-street parking
- Utilities: Public water; Public sewer; Electric service
- Home design: Detached single-family; 2 floors; Fee simple ownership; Estimated year built
- Construction: Frame construction with vinyl siding; Stick-built; Block foundation with crawl space; Asphalt roof; Storm windows
- Exterior features: Cleared lot; Enclosed outdoor living area (porch/patio); Above-grade structures
Interior
- Bedrooms: 2 bedrooms on the main level
- Bathrooms: 1 full bathroom (main level)
- Heating & cooling: Forced air heating (electric); Window air conditioning units (electric); Electric hot water
- Interior features: Storm doors; Estimated living area
Neighborhood map
What this means for you Summary
Snapshot
- This is a 2-bed/1.0-bath single-family listed at $85k.
Deal economics
- At list price, monthly cash flow is $-108 ($-1k/yr) — negative.
- To cash-flow at today's rent, offer at most $66k (22.4% below list).
- Meets the 1% rule at list price ($1k rent vs $85k).
- Recommended offer: $66k (22.4% below list) — sets the bar for cash-flow.
- Cap rate 10.8% vs local median 1.5% in Crisfield — top-decile yield for the area; either an underpriced asset or a hidden risk that comps aren't pricing in. Stress-test before assuming the spread holds.
Location & tenants
- Location reads 68/100 on livability (#199 in MD) — a middle-class / working-renter tenant base. Strengths: crime A+, cost of living A+, health & safety A+; Watch: amenities F, commute F, employment F.
- Somerset County Public Schools (town): math 12% / reading 23% proficiency, ranked #22 of 24 in MD (top 92%) — low school quality limits family demand, transient renter base, plan for 1-2y turnover; 64% free/reduced lunch — lower-income household profile, screen leases tightly.
- Zoned schools: Carter G Woodson Elementary (math 12% / reading 17%, grade F, #477 of 860 statewide, top 59%, 508 students, 75% FRL); Crisfield Academy And High School (math 17% / reading 42%, grade F, #154 of 222 statewide, top 70%, 350 students, 65% FRL).
- Market conditions: 92 active listings in the ZIP; 49 units permitted in Somerset County in 2024 (0 in 5+ unit buildings).
Forward outlook
- In year one you build about $9k of equity ($588 loan paydown + $8k appreciation (10.0% local appreciation)).
- Somerset County population projected at -16% by 2050 — secular population decline; favor cash flow + early exit over multi-decade hold.
- By year 4, paydown + projected appreciation supports a ~$32k cash-out refi (75% LTV) — recoverable capital for the next deal without selling this one.
Negotiation context
- It's been on market 35 days — a 3% lower offer ($82k) is reasonable based on typical stale-listing flexibility.
- 4 sale attempts since 23y ago; this cycle's ask has dropped $10k (11%) from the opening price — seller is motivated, your offer sets the floor, not the list.
- Current owner paid $38k; list at $85k implies a 121% gain — meaningful room to come down on a strong offer.
Risks & watch-outs
- Watch-outs: flood insurance adds $427/mo; built in 1900 — expect roof / HVAC / electrical / plumbing capex.
- Climate carrying-cost: in FEMA flood zone AE (mandatory federal flood insurance); severe wind risk, 80% chance of damaging wind over 30y; extreme-heat days projected 7→19/yr by 2055 (HVAC capex compounding) — expect insurance premiums to compound above CPI over the hold.
Questions for the listing agent
- What do current leases actually rent for vs. the listed asking? Can we see a recent rent roll and the last 12 months of T-12 income?
- It's been on market 35 days. Have you received any prior offers? Is the seller open to a 22% concession, seller financing, or rate buy-down credit?
- Built in 1900 — when were the roof, HVAC, electrical panel, plumbing, and water heater last replaced?
- What's the actual annual flood-insurance premium (NFIP or private), and is the property in a SFHA with mandatory coverage?
- Is there a deadline driving the sale (1031 exchange, divorce, estate, relocation)? That informs how much negotiation room exists.
- Schools are F-rated, which usually means shorter tenancies and higher turnover. Who's the typical renter profile here, and what's been the actual vacancy rate?
- What's the average days-on-market for RENTAL listings here right now (not sales)? A rising rental-DOM trend means longer vacancies and softer asking-rent achievability than the comps imply.
- What's the recent tenant-quality profile in this submarket — average credit score on applications, eviction rate, late-payment / NSF rate, and stable-employment percentage? A property-management company in the area should have these aggregated.
- How much new for-sale + rental construction is in the pipeline within 1–3 miles? Heavy new supply typically softens prices + rents 12–24 months out; constrained supply supports both.
Investment metrics
- 1% rule
- 1.26% ✓
- Cap rate
- 10.79%
- Cash-on-cash
- 16.06%
- DSCR
- 1.71
- GRM
- 6.6
CMA / ARV
- ARV (median comp)
- $144,325
- List price
- $85,000
- Delta
- -41.11%
- Verdict
- UNDERPRICED
- Comps
- 20 within 1.0 mi
Show comp detail 12 sales within ~0.75 mi
| Address | Dist | Beds/Ba | Sqft | Sold | Price | $/sf | Match |
|---|---|---|---|---|---|---|---|
| 40 Maple St | 0.10mi | 2/1.0 | 1,260 (+3%) | 7mo | $60,000 | $48 | 84 |
| 113 2nd St | 0.22mi | 3/1.0 (+1) | 1,224 (+0%) | 11mo | $148,000 | $121 | 76 |
| 328 Pine St | 0.32mi | 3/1.0 (+1) | 1,152 (-6%) | 2mo | $89,000 | $77 | 68 |
| 208 Cove St | 0.27mi | 2/1.0 | 1,344 (+10%) | 8mo | $77,777 | $58 | 65 |
| 52 Maryland Ave | 0.37mi | 2/2.0 | 1,344 (+10%) | 2mo | $142,500 | $106 | 60 |
| 206 Maryland Ave | 0.33mi | 3/2.0 (+1) | 1,120 (-8%) | 5mo | $162,000 | $145 | 58 |
| 26404 Franklin Ln | 0.51mi | 3/2.5 (+1) | 1,284 (+5%) | 0mo | $215,000 | $167 | 56 |
| 313 Broadway | 0.32mi | 3/1.0 (+1) | 1,400 (+15%) | 2mo | $40,000 | $29 | 54 |
| 26547 Old State Rd | 0.67mi | 2/1.5 | 1,284 (+5%) | 9mo | $250,000 | $195 | 51 |
| 3727 Georges Ln | 0.54mi | 3/1.0 (+1) | 1,129 (-8%) | 12mo | $45,000 | $40 | 47 |
| 4 Hudson St | 0.44mi | 2/2.0 | 1,366 (+12%) | 12mo | $98,000 | $72 | 46 |
| 18 Wynfall Ave | 0.51mi | 3/2.0 (+1) | 1,392 (+14%) | 6mo | $196,000 | $141 | 39 |
Match score weights: distance 35% · size 25% · config 20% · recency 20%. Top-matched comps best support the ARV.
Projected returns pro-forma
10.0% appreciation · 3.0% rent growth · sell at horizon
- IRR
- 20.5%
- Equity multiple
- 2.67×
- Total profit
- $39,655
- Equity at exit
- $76,575
- IRR
- 18.8%
- Equity multiple
- 6.15×
- Total profit
- $122,668
- Equity at exit
- $165,136
Cash invested: $23,800 (down + closing). Projections, not guarantees.
Landlord ↔ Tenant lean methodology
- Overall (STATE)
- 27 Tenant-Leaning
- State Maryland
- 27 Tenant-Leaning · D+14
- County
- — inherits STATE
- City
- — inherits STATE
ZIP-level market 21817
- Home prices YoY
- 7.3%
- Active inventory
- 92
- Price-to-rent
- 6.6×
Monthly cashflow live
- Estimated rent
- $1,071 medium interval (Pro) →
- Mortgage (P&I)
- −$446
- Tax from tax record
- −$46 /mo · $556/yr
- Insurance
- −$35
- Flood insurance flood zone
- −$427 /mo · $5,118/yr
- HOA
- −$0
- Vacancy / Maint / Mgmt
- −$225
- Net cashflow
- $-108
Break-even live
UW: 25.0% down · 7.5% · 30yr · 1.5% tax · 5.0% vac · 8.0% maint · 8.0% mgmt
Financing live
Cash to close
- Down payment
- $21,250
- Closing costs
- $2,550
- Reserves months
- —
- Total cash needed
- —
Loan-product check · same deal, 3 products live
Conventional
25% down · 7.5% · 30yr
- Down + closing
- —
- Monthly P&I
- —
- Monthly cashflow
- —
- DSCR
- —
- Eligible?
- —
Personal DTI + credit; lowest rate.
DSCR
20% down · 8.5% · 30yr
- Down + closing
- —
- Monthly P&I
- —
- Monthly cashflow
- —
- DSCR
- —
- Eligible?
- —
No personal income docs; deal must DSCR.
Hard money
10% down · 12.0% · 12mo
- Down + closing
- —
- Monthly P&I
- —
- Monthly cashflow
- —
- DSCR
- —
- Eligible?
- —
Short-term bridge; refi at stabilization.
Listing history 22 events
-
2026-06-18days on market $85,000 Active 35 DOM
-
2026-06-17price $85,000 Active 34 DOM
-
2026-06-17days on market $95,000 Active 34 DOM
-
2026-06-16days on market $95,000 Active 33 DOM
-
2026-06-15days on market $95,000 Active 32 DOM
-
2026-06-14days on market $95,000 Active 30 DOM
-
2026-06-13days on market $95,000 Active 29 DOM
-
2026-06-10days on market $95,000 Active 27 DOM
-
2026-06-09days on market $95,000 Active 26 DOM
-
2026-06-08days on market $95,000 Active 25 DOM
-
2026-06-07days on market $95,000 Active 24 DOM
-
2026-06-02days on market $95,000 Active 19 DOM
-
2026-06-01days on market $95,000 Active 18 DOM
-
2026-05-31days on market $95,000 Active 17 DOM
-
2026-05-30days on market $95,000 Active 16 DOM
-
2026-05-14$95,000 Active 1751-char remark
-
2017-03-31historical
-
2016-07-11$69,500
-
2005-02-28historical
-
2004-04-13$69,500
-
2004-03-22soldstatus $38,500
-
2003-10-03$38,500
ⓘ Source: listings_history table (triggers on properties + properties_extension) + one-shot
backfill from property_details.listing_events for pre-trigger history.
Tax reassessment forecast MD · Partial reset (capped growth)
- Current annual tax
- $556 · $46/mo
- Projected year-2 tax
- $741 · $62/mo
- Expected delta
- +$185/yr (+$15/mo · 33.3%)
ⓘ Screening estimate from a state-policy table — verify with the county assessor before closing.
Climate risk First Street
- Flood 10/10 Extreme FEMA zone AE · 99% chance over 30 yrs
- Wildfire 4/10 Moderate
- Heat 9/10 Extreme 7 d/yr ≥101°F today · 19 d/yr by 30 yrs out
- Wind 8/10 Severe 80% chance of damaging wind over 30 yrs
- Air quality 2/10 Low 1 unhealthy d/yr today · 2 by 30 yrs out
Nearby sold comps map
Loading sold comps map…
Walkable amenities ~0.75 mi
Loading nearby amenities…
Taxation est. · year 1
- Rental income
- $12,852
- − Mortgage interest
- −$4,761
- − Property taxes
- −$556
- − Insurance
- −$5,544
- − Repairs & maintenance
- −$1,028
- − Management
- −$1,028
- − Depreciation
- −$2,473
- Taxable loss
- −$2,539
- Est. tax savings @ 24.0%
- +$609
- After-tax cash flow
- $-687/yr
For passive investors: Depreciation is non-cash, so a rental often shows a tax loss while cash-flowing — sheltering income. Rental losses are passive: they offset passive income freely, and up to $25,000/yr can offset ordinary (W-2) income if you actively participate and your MAGI is under $100k (phasing out to $0 by $150k); unused losses carry forward. On sale, claimed depreciation is recaptured at up to 25%, and gains may owe capital-gains tax (a 1031 exchange can defer both). Figures are a year-1 estimate at your 24.0% rate — not tax advice; consult a CPA.
Schools (NCES district)
- District
- Somerset County Public Schools
- NCES district ID
- 2400570
- Math proficiency
- 12% ▼ -7.00%
- Reading proficiency
- 23% ▼ -14.00%
- Median HH income
- $38,810
- Composite
- 14.73/100
- National rank
- #9396
- State rank
- #22 of 24 in MD
Livability — Crisfield
- Score
- 68/100
- State rank
- #199
- US rank
- #9181
Category grades
Schools grade is shown separately in the Schools card above.
Census & demographics
- Census place
- Crisfield, MD
- Population (ZIP)
- 4,102
Population outlook (Somerset County) Hauer SSP2
- Today (2025)
- 24,474 people
- By 2030
- 23,547 · -3.8%
- By 2040
- 21,498 · -12.2%
- By 2050
- 20,427 · -16.5%
- By 2075
- 16,594 · -32.2%
- By 2100
- 12,132 · -50.4%
Race, ethnicity, and origin ACS 2023
- Neighborhood character
- Predominantly White (72%)
- Race & ethnicity
- White 72% Black 20% Two or more races 4% Hispanic / Latino 3% Asian 1%
- Common ancestry
- Italian 2% Serbian 1% Romanian 1%
- Foreign-born
- 2% · Canada
- Languages at home
- 97% English-only · Spanish 2%
Political lean MEDSL · Somerset
- 2024 margin
- R (+17.4) · D 40.2% · R 57.5% · Other 2.3%
- 2008→2024 swing
- -14.8pp toward R · 2008: -2.6pp · 2024: -17.4pp
- All cycles
- 2024: R+17.4 2020: R+14.8 2016: R+17.9 2012: R+2.5 2008: R+2.6
Not yet ingested
- Civics
- —
Market trends
- HPI YoY
- ▲ 19.92%
- Current HPI
- 292.866
- Rent YoY
- —
- Metro
- —
- State GDP YoY
- ▲ 2.97%
- F500 in state
- 12
Industry mix (Fortune 500 HQ in MD)
| Industry | F500 HQs | Revenue |
|---|---|---|
| Aerospace / Defense | 1 | $71B |
|
||
| Utilities | 1 | $25B |
|
||
| Hotels | 1 | $24B |
|
||
| Consumer Goods | 1 | $7B |
|
||
| Real Estate | 1 | $6B |
|
||
| Chemicals | 1 | $2B |
|
||
Price history
+120.8% since first listed8 events — show timeline
- 2026-06-17 Price Changed $85,000 BRIGHT MLS
- 2026-05-14 Listed $95,000 BRIGHT MLS
- 2017-03-31 Listing Removed — BRIGHT MLS
- 2016-07-11 Listed $69,500 BRIGHT MLS
- 2005-02-28 Listing Removed — BRIGHT MLS
- 2004-04-13 Listed $69,500 BRIGHT MLS
- 2004-03-22 Sold (MLS) $38,500 BRIGHT MLS
- 2003-10-03 Listed $38,500 BRIGHT MLS
Property tax history
-4.1%/yrLatest (2023): $556 · +13.5% YoY. Source: county tax records.
Cash-flow waterfall
monthlySold comps — $/sqft
last 12 mo · ≤1 miLoading sold comps…