136 Lakeshore Dr #511 · North Palm Beach, FL
Flood risk 8/10 · Major
- FEMA flood zone
- AE
- Chance of flooding over 30 yrs
- 0.99%
- Est. flood insurance / yr
- $1,737 – $8,500
Fire risk 3/10 · Minor
- Est. fire insurance / yr
- $947 – $1,759
Heat risk 9/10 · Severe
- Hot days now (above 105°F)
- 7 days/yr
- Hot days in 30 yrs
- 25 days/yr
Wind risk 10/10 · Severe
- Chance of severe wind over 30 yrs
- 99.0%
Air-quality risk 2/10 · Minimal
- Unhealthy air days now
- 0 days/yr
- Unhealthy air days in 30 yrs
- 1 days/yr
Risk factors via First Street. Map © Google.
Why this score? — see what drove the F grade
The composite is a weighted blend of 9 inputs, each scored 0–100. Each bar is that input's sub-score; the figure is the points it added to the 100-point composite (weight × sub-score).
- ARV discount +7.5/15.0
- 1% rule +5.1/10.0
- Cash flow +4.7/30.0
- Schools +4.3/10.0
- Livability +3.9/5.0
- Rent growth +2.6/5.0
- Condition / age +2.5/5.0
- DSCR +0.0/10.0
- Appreciation +0.0/10.0
$375,000
🖨 Deal sheet 📄 Offer letter ✓ Due diligence
Listing remarks
Take advantage of this renovated Unit, as this unit is under a Short Sale and taking all offers
Key facts
- Garage
- Community pool
- Built 1972
Property features AI
Finance
- HOA & community: Community amenities: parking, pool; No pets allowed (per community rules); Large community with 1,053 units
Exterior
- Parking: Assigned parking; Covered parking; Attached garage (1-car); 1 open parking space; Total 2 parking spaces
- Security: Building security; Gated community with guard; Security guard; Security patrol; Elevator secure; Smoke detectors
- Utilities: Public water; Public sewer; 200+ amp electric service; Cable connected; Water connected; Sewer connected
- Home design: Condominium; One level; Faces east; Resale property; Quay North building (13-story)
- Construction: CBS construction; Tar/gravel roof
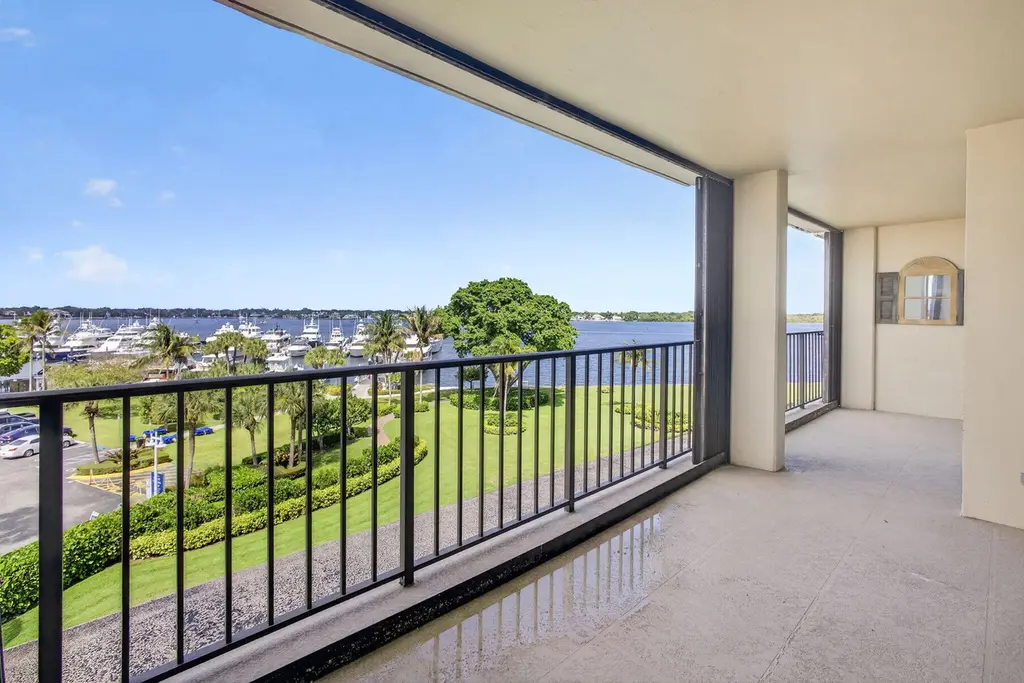
- Exterior features: Ocean access and intracoastal waterfront; Waterfront; East of US-1 road frontage
Interior
- Kitchen: Disposal; Dishwasher; Electric range; Microwave; Refrigerator
- Bedrooms: 2 bedrooms (main level)
- Flooring: Laminate; Wood
- Bathrooms: 2 full bathrooms (main level)
- Heating & cooling: Central heating; Central air; Ceiling fan(s)
- Interior features: Walk-in closets; Shutters
- Laundry & utility: Laundry in hall
Neighborhood map
What this means for you Summary
Snapshot
- This is a 2-bed/2.0-bath condo listed at $375k.
Deal economics
- At list price, monthly cash flow is $-1k ($-16k/yr) — negative.
- To cash-flow at today's rent, offer at most $351k (6.4% below list).
- Meets the 1% rule at list price ($4k rent vs $375k).
- Recommended offer: $351k (6.4% below list) — sets the bar for cash-flow.
Location & tenants
- Location reads 77/100 on livability (#184 in FL, #2,894 nationally) — a middle-class / working-renter tenant base. Strengths: crime A+, employment A+, housing A+; Watch: amenities F, commute F, cost of living D-.
- Palm Beach (suburban): math 46% / reading 53% proficiency, ranked #34 of 73 in FL (top 47%) — families likely to look elsewhere, expect single-tenant / working-renter base with shorter leases.
- Zoned schools: Howell L. Watkins Middle School (math 18% / reading 33%, grade F, #512 of 571 statewide, top 90%, 794 students, 76% FRL); Palm Beach Gardens High School (math 19% / reading 40%, grade F, #447 of 667 statewide, top 68%, 2,570 students, 61% FRL) — zoned schools average 69% FRL vs 52% district-wide (17 pts higher); higher-poverty schools than district average — tighter screening recommended.
- Zoned-school proficiency averages 28% at this address vs 50% district-wide (-22 pts) — the specific schools serving this property underperform the Palm Beach average; the district grade overstates school quality for this exact location.
- Market conditions: Rents flat; 400 active listings in the ZIP; 23 comparable units currently listed for rent nearby; rentals at typical pace (median 22d on market — plan ~3-4 weeks tenant-placement turnaround); solid renter incomes; 3,974 units permitted in Palm Beach County in 2024 (1,012 in 5+ unit buildings).
- At $3,780/mo this rent would consume 49% of the median local household income ($92k/yr) (locally 835% of renters already pay >50% of income on rent) — very limited rent-growth headroom before tenants either downsize or default.
Forward outlook
- Local home prices are declining (-3.0%/yr); year-one equity from $3k of loan paydown is wiped out by about $11k of value loss. Plan a longer hold.
- Palm Beach County population projected at +30% by 2050 — long-run rental-demand tailwind backs the buy-and-hold thesis.
Negotiation context
- It's been on market 66 days — a 6% lower offer ($352k) is reasonable based on typical stale-listing flexibility.
- 7 sale attempts since 3y ago with the ask held roughly flat each time — persistent listings suggest the price (not the market) is what's stuck; bring a comps-based counter.
- Current owner paid $325k; 15% above their basis — modest negotiation headroom, anchor on the comps not their cost.
Risks & watch-outs
- Watch-outs: flood insurance adds $427/mo; HOA is 32% of rent.
- Climate carrying-cost: in FEMA flood zone AE (mandatory federal flood insurance); severe wind risk, 99% chance of damaging wind over 30y; extreme-heat days projected 7→25/yr by 2055 (HVAC capex compounding) — expect insurance premiums to compound above CPI over the hold.
Questions for the listing agent
- What do current leases actually rent for vs. the listed asking? Can we see a recent rent roll and the last 12 months of T-12 income?
- It's been on market 66 days. Have you received any prior offers? Is the seller open to a 6% concession, seller financing, or rate buy-down credit?
- Built in 1972 — when were the roof, HVAC, electrical panel, plumbing, and water heater last replaced?
- What's the actual annual flood-insurance premium (NFIP or private), and is the property in a SFHA with mandatory coverage?
- What does the HOA fee cover, when was the last increase, and are there any pending special assessments or reserve-fund shortfalls?
- Any open or pending special assessments — roof, HVAC, plumbing, elevator, façade? What's the per-unit balance and payoff schedule, and is the seller paying it off at close or rolling it to the buyer?
- Why hasn't it sold? Are there any deal-killer items the seller is aware of (foundation, flood, title, zoning, code violations)?
- Is there a deadline driving the sale (1031 exchange, divorce, estate, relocation)? That informs how much negotiation room exists.
- Schools are A-rated — typically a magnet for longer-tenancy family renters. What's the average tenant stay here, and is there a school-zone premium baked into asking?
- The area grade is low — what's the realistic commute time and amenity access for the typical tenant pool here? Any planned neighborhood developments (good or bad) we should know about?
- What's the average days-on-market for RENTAL listings here right now (not sales)? A rising rental-DOM trend means longer vacancies and softer asking-rent achievability than the comps imply.
- What's the recent tenant-quality profile in this submarket — average credit score on applications, eviction rate, late-payment / NSF rate, and stable-employment percentage? A property-management company in the area should have these aggregated.
- How much new apartment / multifamily construction is in the pipeline within 1–3 miles? Heavy new supply (>2% of stock underway) typically softens rents 12–24 months out; light construction supports rent growth.
Investment metrics
- 1% rule
- 1.01% ✓
- Cap rate
- 3.31%
- Cash-on-cash
- -10.65%
- DSCR
- 0.53
- GRM
- 8.3
CMA / ARV
No comps found within radius.
Projected returns pro-forma
-3.0% appreciation · 0.27% rent growth · sell at horizon
- IRR
- -52.6%
- Equity multiple
- -0.49×
- Total profit
- $-156,270
- Equity at exit
- $55,914
- IRR
- —
- Equity multiple
- -1.69×
- Total profit
- $-282,158
- Equity at exit
- $32,423
Cash invested: $105,000 (down + closing). Projections, not guarantees.
Landlord ↔ Tenant lean methodology
- Overall (STATE)
- 87 Strongly Landlord-Friendly
- State Florida
- 87 Strongly Landlord-Friendly · R+3
- County
- — inherits STATE
- City
- — inherits STATE
ZIP-level market 33408
- Rents YoY
- 0.3%
- Active inventory
- 400
- Price-to-rent
- 8.3×
Monthly cashflow live
- Estimated rent
- $3,780 high interval (Pro) →
- Mortgage (P&I)
- −$1,967
- Tax from tax record
- −$573 /mo · $6,877/yr
- Insurance
- −$156
- Flood insurance flood zone
- −$427 /mo · $5,118/yr
- HOA est. from 6 same-building comps
- −$1,222
- Vacancy / Maint / Mgmt
- −$794
- Net cashflow
- $-1,359
Break-even live
UW: 25.0% down · 7.5% · 30yr · 1.5% tax · 5.0% vac · 8.0% maint · 8.0% mgmt
Financing live
Cash to close
- Down payment
- $93,750
- Closing costs
- $11,250
- Reserves months
- —
- Total cash needed
- —
Loan-product check · same deal, 3 products live
Conventional
25% down · 7.5% · 30yr
- Down + closing
- —
- Monthly P&I
- —
- Monthly cashflow
- —
- DSCR
- —
- Eligible?
- —
Personal DTI + credit; lowest rate.
DSCR
20% down · 8.5% · 30yr
- Down + closing
- —
- Monthly P&I
- —
- Monthly cashflow
- —
- DSCR
- —
- Eligible?
- —
No personal income docs; deal must DSCR.
Hard money
10% down · 12.0% · 12mo
- Down + closing
- —
- Monthly P&I
- —
- Monthly cashflow
- —
- DSCR
- —
- Eligible?
- —
Short-term bridge; refi at stabilization.
Rent comps 23 comps
| Address | Beds | Baths | Sqft | Rent | $/sqft | DOM | Units | Dist |
|---|---|---|---|---|---|---|---|---|
| 132 Lakeshore Dr #1118 North Palm Beach, FL | 3.0 | 2.5 | 1498 | $6,450 | $4.31 | 24d | 1 | 0.04mi |
| 136 Lakeshore Dr North Palm Beach, FL | 2.0 | 2.0 | 1244 | $4,000 | $3.22 | 4d | 1 | 0.04mi |
| 130 Lakeshore Dr #923 North Palm Beach, FL | 2.0 | 2.0 | 1244 | $3,300 | $2.65 | 24d | 1 | 0.04mi |
| 126 Lakeshore Dr Unit 927 North Palm Beach, FL | 2.0 | 2.0 | 1422 | $3,250 | $2.29 | 24d | 1 | 0.09mi |
| 124 Lakeshore Dr #4280 North Palm Beach, FL | 2.0 | 2.0 | 1422 | $3,750 | $2.64 | 21d | 1 | 0.09mi |
| 134 Lakeshore Dr Unit T13 North Palm Beach, FL | 2.0 | 2.0 | 1244 | $3,250 | $2.61 | 24d | 1 | 0.12mi |
| 20 Yacht Club Dr #405 North Palm Beach, FL | 2.0 | 2.0 | 1010 | $3,000 | $2.97 | 24d | 1 | 0.34mi |
| 29 Yacht Club Dr #306 North Palm Beach, FL | 2.0 | 2.0 | 1200 | $3,000 | $2.50 | 2d | 1 | 0.38mi |
| 52 Yacht Club Dr #308 North Palm Beach, FL | 2.0 | 2.0 | 1130 | $3,800 | $3.36 | 12d | 1 | 0.44mi |
| 52 Yacht Club Dr North Palm Beach, FL | 2.0 | 2.0 | 1130 | $3,375 | $2.99 | 17d | 2 | 0.44mi |
| 60 Yacht Club Dr #405 North Palm Beach, FL | 2.0 | 2.0 | 1423 | $3,100 | $2.18 | 19d | 1 | 0.49mi |
| 1660 Twelve Oaks Way #203 North Palm Beach, FL | 2.0 | 2.0 | 1492 | $7,500 | $5.03 | 19d | 1 | 0.50mi |
| 11521 Landing Pl Unit E1 North Palm Beach, FL | 2.0 | 2.0 | 1130 | $7,000 | $6.19 | 24d | 1 | 0.73mi |
| 2100 PGA Blvd Palm Beach Gardens, FL | 1.0–3.0 | 1.0–2.0 | 1044 | $3,062 | $2.93 | 1d | 10 | 0.73mi |
| 700 Sanctuary Cove Dr West Palm Beach, FL | 1.0–3.0 | 1.0–2.0 | 1120 | $2,602 | $2.32 | 1d | 55 | 0.88mi |
| 2396 Easy St Unit A Palm Beach Gardens, FL | 2.0 | 1.0 | 948 | $3,500 | $3.69 | 24d | 1 | 1.00mi |
| 1718 Ridge Rd North Palm Beach, FL | 2.0 | 2.0 | 900 | $2,950 | $3.28 | 24d | 1 | 1.23mi |
| 2539 Wabash Dr West Palm Beach, FL | 3.0 | 2.5 | 1468 | $5,500 | $3.75 | 24d | 1 | 1.25mi |
| 429 Inlet Rd North Palm Beach, FL | 3.0 | 2.5 | 1452 | $6,500 | $4.48 | 24d | 1 | 1.27mi |
| 2395 Idlewild Rd Palm Beach Gardens, FL | 3.0 | 2.0 | 1476 | $4,500 | $3.05 | 22d | 1 | 1.29mi |
| 12155 US Highway 1 North Palm Beach, FL | 1.0–3.0 | 1.0–2.0 | 1297 | $3,568 | $2.75 | 1d | 23 | 1.43mi |
| 2388 S Wallen Dr West Palm Beach, FL | 3.0 | 2.0 | 1296 | $4,500 | $3.47 | 24d | 1 | 1.44mi |
| 1869 Circle Dr North Palm Beach, FL | 2.0 | 2.0 | 1216 | $3,400 | $2.80 | 13d | 1 | 1.50mi |
HOA detail condo
- Monthly dues
- $0 · $0/yr
- Assessments
- None detected in remarks — confirm with the listing agent.
Listing history 47 events
-
2026-06-18days on market $375,000 Active 66 DOM
-
2026-06-17days on market $375,000 Active 65 DOM
-
2026-06-16days on market $375,000 Active 64 DOM
-
2026-06-15days on market $375,000 Active 63 DOM
-
2026-06-13days on market $375,000 Active 61 DOM
-
2026-06-09days on market $375,000 Active 57 DOM
-
2026-06-08days on market $375,000 Active 56 DOM
-
2026-06-07days on market $375,000 Active 55 DOM
-
2026-06-04days on market $375,000 Active 52 DOM
-
2026-06-03days on market $375,000 Active 51 DOM
-
2026-06-02days on market $375,000 Active 50 DOM
-
2026-06-01days on market $375,000 Active 49 DOM
-
2026-05-31days on market $375,000 Active 48 DOM
-
2026-04-11$375,000 Active
-
2026-04-06historical
-
2026-03-24$374,999 Active
-
2026-02-20historical
-
2025-11-19$425,000 Active
-
2025-09-30historical
-
2025-08-27price $399,000
-
2025-05-29price $424,000
-
2025-05-16price $430,000
-
2025-04-29price $435,000
-
2025-04-23price $449,000
-
2025-04-15price $455,000
-
2025-04-01price $465,000
-
2025-03-27historical $3,000
-
2025-03-04price $480,000
-
2024-10-23price $490,000
-
2024-10-02historical $3,000
-
2024-10-01$3,000
-
2024-08-19price $510,000
-
2024-08-10$3,000
-
2024-06-18price $524,000
-
2024-05-08price $529,000
-
2024-03-26price $540,000
-
2024-03-15price $559,000
-
2024-03-07$575,000 Active
-
2023-09-07soldstatus $325,000
-
2023-08-23soldstatus $325,000 Closed
-
2023-07-05historical Active Under Contract
-
2023-06-30price $375,000
-
2023-06-11status Active
-
2023-06-08status Pending
-
2023-06-05historical $395,000
-
1998-04-21soldstatus $125,000
-
1985-07-01soldstatus $120,000
ⓘ Source: listings_history table (triggers on properties + properties_extension) + one-shot
backfill from property_details.listing_events for pre-trigger history.
Tax reassessment forecast FL · Resets to sale price
- Current annual tax
- $6,877 · $573/mo
- Projected year-2 tax
- $6,877 · $573/mo
- Expected delta
- $0/yr ($0/mo · 0.0%)
ⓘ Screening estimate from a state-policy table — verify with the county assessor before closing.
Climate risk First Street
- Flood 8/10 Severe FEMA zone AE · 99% chance over 30 yrs
- Wildfire 3/10 Moderate
- Heat 9/10 Extreme 7 d/yr ≥105°F today · 25 d/yr by 30 yrs out
- Wind 10/10 Extreme 99% chance of damaging wind over 30 yrs
- Air quality 2/10 Low 0 unhealthy d/yr today · 1 by 30 yrs out
Nearby sold comps map
Loading sold comps map…
Walkable amenities ~0.75 mi
Loading nearby amenities…
Taxation est. · year 1
- Rental income
- $45,354
- − Mortgage interest
- −$21,006
- − Property taxes
- −$6,877
- − Insurance
- −$6,994
- − Repairs & maintenance
- −$3,628
- − Management
- −$3,628
- − HOA
- −$14,664
- − Depreciation
- −$10,909
- Taxable loss
- −$22,352
- Est. tax savings @ 24.0%
- +$5,365
- After-tax cash flow
- $-10,939/yr
For passive investors: Depreciation is non-cash, so a rental often shows a tax loss while cash-flowing — sheltering income. Rental losses are passive: they offset passive income freely, and up to $25,000/yr can offset ordinary (W-2) income if you actively participate and your MAGI is under $100k (phasing out to $0 by $150k); unused losses carry forward. On sale, claimed depreciation is recaptured at up to 25%, and gains may owe capital-gains tax (a 1031 exchange can defer both). Figures are a year-1 estimate at your 24.0% rate — not tax advice; consult a CPA.
Schools (NCES district)
- District
- Palm Beach
- NCES district ID
- 1201500
- Math proficiency
- 46% ▼ -16.00%
- Reading proficiency
- 53% ▼ -4.00%
- Median HH income
- $53,943
- Composite
- 42.72/100
- National rank
- #3160
- State rank
- #34 of 73 in FL
Livability — North Palm Beach
- Score
- 77/100
- State rank
- #184
- US rank
- #2894
Category grades
Schools grade is shown separately in the Schools card above.
Census & demographics
- Census place
- North Palm Beach, FL
- County
- Palm Beach County · 1,438,312 people
- City population
- 18,817
- Metro
- Miami-Fort Lauderdale-Pompano Beach, FL
- Population (ZIP)
- 18,817
- Household income
- $92,216
- Rent vs Own
- Severe rent burden
- 835.0
Population outlook (Palm Beach County) Hauer SSP2
- Today (2025)
- 1,637,487 people
- By 2030
- 1,743,255 · +6.5%
- By 2040
- 1,948,712 · +19.0%
- By 2050
- 2,132,979 · +30.3%
- By 2075
- 2,530,027 · +54.5%
- By 2100
- 2,706,979 · +65.3%
Race, ethnicity, and origin ACS 2023
- Neighborhood character
- Predominantly White (86%)
- Race & ethnicity
- White 86% Hispanic / Latino 9% Two or more races 7% Black 1% Asian 1%
- Hispanic origin (detail)
- Puerto Rican 2% Cuban 2%
- Common ancestry
- Lithuanian 4% Slovak 3% Romanian 3%
- Foreign-born
- 11% · Canada, Jamaica, Guatemala
- Languages at home
- 89% English-only · Spanish 7% Other Indo-European 1% French/Haitian/Cajun 1%
Political lean MEDSL · Palm Beach
- 2024 margin
- Toss-up / Even · D 50.0% · R 49.2%
- 2008→2024 swing
- -22.1pp toward R · 2008: 22.9pp · 2024: 0.8pp
- All cycles
- 2024: D+0.8 2020: D+12.8 2016: D+15.3 2012: D+17.0 2008: D+22.9
Not yet ingested
- Civics
- —
Market trends
- HPI YoY
- ▼ -223.14%
- Current HPI
- 365.2913
- Rent YoY
- ▲ 0.27%
- Metro
- Miami-Fort Lauderdale-Pompano Beach, FL
- State GDP YoY
- ▲ 3.28%
- F500 in state
- 36
Industry mix (Fortune 500 HQ in FL)
| Industry | F500 HQs | Revenue |
|---|---|---|
| Industrial Technology | 2 | $29B |
|
||
| Insurance | 2 | $17B |
|
||
| Retail | 1 | $60B |
|
||
| Technology Distribution | 1 | $58B |
|
||
| Homebuilding | 1 | $35B |
|
||
| Technology Manufacturing | 1 | $35B |
|
||
Price history
+212.5% since first listed34 events — show timeline
- 2026-04-11 Listed $375,000 Beaches MLS
- 2026-04-06 Listing Removed — MARMLS
- 2026-03-24 Listed $374,999 MARMLS
- 2026-02-20 Listing Removed — Beaches MLS
- 2025-11-19 Listed $425,000 Beaches MLS
- 2025-09-30 Listing Removed — Beaches MLS
- 2025-08-27 Price Changed $399,000 Beaches MLS
- 2025-05-29 Price Changed $424,000 Beaches MLS
- 2025-05-16 Price Changed $430,000 Beaches MLS
- 2025-04-29 Price Changed $435,000 Beaches MLS
- 2025-04-23 Price Changed $449,000 Beaches MLS
- 2025-04-15 Price Changed $455,000 Beaches MLS
- 2025-04-01 Price Changed $465,000 Beaches MLS
- 2025-03-27 Rental Removed $3,000 GFLMLS
- 2025-03-04 Price Changed $480,000 Beaches MLS
- 2024-10-23 Price Changed $490,000 Beaches MLS
- 2024-10-02 Rental Removed $3,000 RMLSFL
- 2024-10-01 Listed for Rent $3,000 GFLMLS
- 2024-08-19 Price Changed $510,000 Beaches MLS
- 2024-08-10 Listed for Rent $3,000 RMLSFL
- 2024-06-18 Price Changed $524,000 Beaches MLS
- 2024-05-08 Price Changed $529,000 Beaches MLS
- 2024-03-26 Price Changed $540,000 Beaches MLS
- 2024-03-15 Price Changed $559,000 Beaches MLS
- 2024-03-07 Listed $575,000 Beaches MLS
- 2023-09-07 Sold (Public Records) $325,000 Public Records
- 2023-08-23 Sold (MLS) $325,000 Beaches MLS
- 2023-07-05 Contingent — Beaches MLS
- 2023-06-30 Price Changed $375,000 Beaches MLS
- 2023-06-11 Relisted — Beaches MLS
- 2023-06-08 Pending — Beaches MLS
- 2023-06-05 Coming Soon $395,000 Beaches MLS
- 1998-04-21 Sold (Public Records) $125,000 Public Records
- 1985-07-01 Sold (Public Records) $120,000 Public Records
Property tax history
+9.0%/yrLatest (2025): $6,877 · -16.8% YoY. Source: county tax records.
Cash-flow waterfall
monthlySold comps — $/sqft
last 12 mo · ≤1 miLoading sold comps…