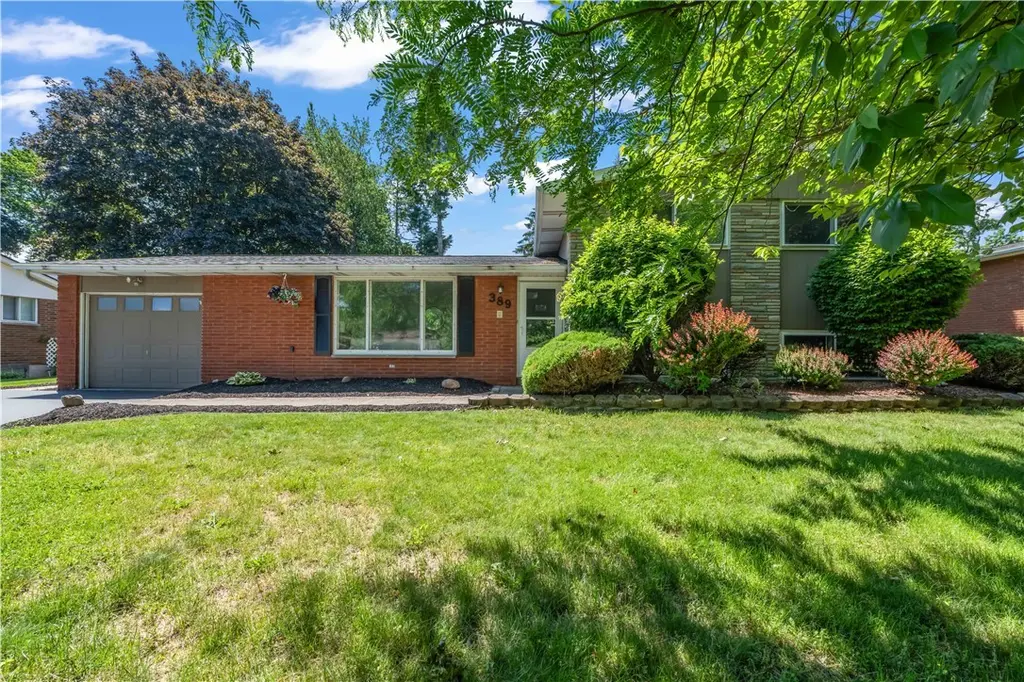
389 Sharon Dr · Greece, NY
Flood risk 1/10 · Minimal
- FEMA flood zone
- X (unshaded)
- Chance of flooding over 30 yrs
- 0.0%
- Est. flood insurance / yr
- $473 – $860
Fire risk 3/10 · Minor
- Est. fire insurance / yr
- $691 – $1,283
Heat risk 2/10 · Minimal
- Hot days now (above 95°F)
- 7 days/yr
- Hot days in 30 yrs
- 15 days/yr
Wind risk 1/10 · Minimal
- Chance of severe wind over 30 yrs
- —
Air-quality risk 2/10 · Minimal
- Unhealthy air days now
- 1 days/yr
- Unhealthy air days in 30 yrs
- 2 days/yr
Risk factors via First Street. Map © Google.
Why this score? — see what drove the D+ grade
The composite is a weighted blend of 9 inputs, each scored 0–100. Each bar is that input's sub-score; the figure is the points it added to the 100-point composite (weight × sub-score).
- ARV discount +12.9/15.0
- Cash flow +11.5/30.0
- 1% rule +5.6/10.0
- Livability +4.0/5.0
- DSCR +3.4/10.0
- Schools +3.2/10.0
- Rent growth +3.1/5.0
- Condition / age +2.5/5.0
- Appreciation +0.0/10.0
$199,900
🖨 Deal sheet 📄 Offer letter ✓ Due diligence
Listing remarks
Beautifully updated 3 bedroom and 1.5 bath Split Level in Greece! From top to bottom, this home has been thoughtfully updated and is truly move-in ready. Step inside to find gleaming hardwood floors, fresh paint throughout, and stylish new light fixtures that create a bright and inviting atmosphere. The spacious living room is filled with natural light thanks to a large picture window and flows seamlessly into the stunning eat-in kitchen. Featuring white cabinetry, new luxury vinyl plank flooring, a classic subway tile backsplash, and plenty of space for dining, this kitchen is sure to impress. Just off the kitchen you will find a 1st floor half bath for added convenience. Step down to the
Key facts
- Spacious backyard
- Dry bar
- Eat-in kitchen
Tags
Property features AI
Exterior
- Parking: Attached garage; Garage with 1 parking space; Driveway
- Utilities: Public water connected; Sewer connected; Electricity available and connected; High-speed internet available; Cable available
- Home design: Single-story home; Existing (previously built) property
- Construction: Brick, stone, and wood siding exterior; Asphalt roof; Block foundation; Below-grade finished area (basement) present and finished
- Exterior features: Blacktop driveway; Open patio and porch; Patio; Porch; Rectangular residential lot; City street frontage; Lot dimensions approximately 80 x 149
Interior
- Kitchen: Dishwasher; Electric oven; Electric range; Microwave; Refrigerator; Eat-in kitchen
- Bedrooms: Three main-level bedrooms
- Flooring: Carpet; Hardwood; Luxury vinyl; Varied flooring
- Bathrooms: One full bathroom; One half bathroom; Two bathrooms on the main level
- Heating & cooling: Gas forced-air heating; Central air conditioning; Circuit breaker electric
- Interior features: Ceiling fans; Dry bar; Eat-in kitchen; Separate/formal living room; Thermal windows
- Laundry & utility: Laundry in basement; Gas water heater
Neighborhood map
What this means for you Summary
Snapshot
- This is a 3-bed/1.5-bath single-family listed at $200k.
Deal economics
- At list price, monthly cash flow is $-64 ($-772/yr) — negative.
- To cash-flow at today's rent, offer at most $189k (5.7% below list).
- Meets the 1% rule at list price ($2k rent vs $200k).
- Recommended offer: $189k (5.7% below list) — sets the bar for cash-flow.
- Cap rate 5.9% vs local median 3.7% in Greece — top-decile yield for the area; either an underpriced asset or a hidden risk that comps aren't pricing in. Stress-test before assuming the spread holds.
Location & tenants
- Location reads 79/100 on livability (#145 in NY, #2,223 nationally) — a middle-class / working-renter tenant base. Strengths: commute A+, housing A+, health & safety A+; Watch: schools D-, crime D-.
- Greece Central School District (suburban): math 35% / reading 39% proficiency, ranked #544 of 590 in NY (top 92%) — families likely to look elsewhere, expect single-tenant / working-renter base with shorter leases.
- Market conditions: Rents rising (+2.5%/yr); 126 active listings in the ZIP; 2 comparable units currently listed for rent nearby; solid renter incomes; 1,169 units permitted in Monroe County in 2024 (591 in 5+ unit buildings).
- This rent runs 32% of the median local income ($78k/yr) — at the standard rent-burdened threshold; future hikes will face affordability resistance.
Forward outlook
- Local home prices are declining (-3.0%/yr); year-one equity from $1k of loan paydown is wiped out by about $6k of value loss. Plan a longer hold.
- Monroe County population projected to shrink 6% by 2050 — rents likely to lag national; underwrite the cash flow, not the appreciation.
Negotiation context
- Only 8 days on market — expect competitive offers; lowballing is unlikely to land.
- 2 sale attempts since 14y ago with the ask held roughly flat each time — persistent listings suggest the price (not the market) is what's stuck; bring a comps-based counter.
- Current owner paid $118k; list at $200k implies a 69% gain — meaningful room to come down on a strong offer.
Risks & watch-outs
- Watch-outs: property tax is 3.6% of price.
Questions for the listing agent
- What do current leases actually rent for vs. the listed asking? Can we see a recent rent roll and the last 12 months of T-12 income?
- Built in 1965 — when were the roof, HVAC, electrical panel, plumbing, and water heater last replaced?
- Property tax is high relative to price — has the assessment been appealed recently, and will the sale trigger a re-assessment?
- Is there a deadline driving the sale (1031 exchange, divorce, estate, relocation)? That informs how much negotiation room exists.
- Schools are D-rated, which usually means shorter tenancies and higher turnover. Who's the typical renter profile here, and what's been the actual vacancy rate?
- Crime grade is D in this area — have there been break-ins, vandalism, or insurance claims at this property in the last 3 years? What carrier currently insures it and at what premium?
- The area grade is low — what's the realistic commute time and amenity access for the typical tenant pool here? Any planned neighborhood developments (good or bad) we should know about?
- What's the average days-on-market for RENTAL listings here right now (not sales)? A rising rental-DOM trend means longer vacancies and softer asking-rent achievability than the comps imply.
- What's the recent tenant-quality profile in this submarket — average credit score on applications, eviction rate, late-payment / NSF rate, and stable-employment percentage? A property-management company in the area should have these aggregated.
- How much new for-sale + rental construction is in the pipeline within 1–3 miles? Heavy new supply typically softens prices + rents 12–24 months out; constrained supply supports both.
Investment metrics
- 1% rule
- 1.06% ✓
- Cap rate
- 5.91%
- Cash-on-cash
- -1.38%
- DSCR
- 0.94
- GRM
- 7.9
CMA / ARV
- ARV (on-the-fly)
- $227,370
- Comps found
- 12
Show comp detail 12 sales within ~0.75 mi
| Address | Dist | Beds/Ba | Sqft | Sold | Price | $/sf | Match |
|---|---|---|---|---|---|---|---|
| 1143 Long Pond Rd | 0.40mi | 3/2.0 | 1,606 (+1%) | 1mo | $313,143 | $195 | 77 |
| 146 Frandee Ln | 0.23mi | 3/1.5 | 1,736 (+9%) | 4mo | $268,000 | $154 | 71 |
| 1710 Maiden Ln | 0.40mi | 3/1.5 | 1,514 (-5%) | 7mo | $215,000 | $142 | 67 |
| 103 Alfonso Dr | 0.44mi | 4/1.5 (+1) | 1,512 (-5%) | 8mo | $190,000 | $126 | 60 |
| 190 Duxbury Rd | 0.36mi | 3/2.0 | 1,368 (-14%) | 6mo | $195,000 | $143 | 53 |
| 347 Fetzner Rd | 0.64mi | 3/1.5 | 1,429 (-10%) | 2mo | $205,000 | $143 | 52 |
| 264 Harvest Dr | 0.70mi | 3/2.0 | 1,470 (-8%) | 1mo | $250,000 | $170 | 52 |
| 73 Alcott Rd | 0.58mi | 3/1.5 | 1,404 (-12%) | 4mo | $115,000 | $82 | 50 |
| 76 Creekwood Dr | 0.59mi | 4/2.0 (+1) | 1,474 (-7%) | 7mo | $265,000 | $180 | 47 |
| 130 Troutbeck Ln | 0.75mi | 4/1.5 (+1) | 1,693 (+6%) | 3mo | $179,007 | $106 | 47 |
| 31 Blue Grass Ln | 0.45mi | 4/1.5 (+1) | 1,824 (+15%) | 7mo | $242,500 | $133 | 44 |
| 513 Harvest Dr | 0.72mi | 4/2.0 (+1) | 1,740 (+9%) | 7mo | $260,000 | $149 | 37 |
Match score weights: distance 35% · size 25% · config 20% · recency 20%. Top-matched comps best support the ARV.
Projected returns pro-forma
-3.0% appreciation · 2.5% rent growth · sell at horizon
- IRR
- -19.1%
- Equity multiple
- 0.33×
- Total profit
- $-37,300
- Equity at exit
- $29,806
- IRR
- -12.7%
- Equity multiple
- 0.27×
- Total profit
- $-41,045
- Equity at exit
- $17,284
Cash invested: $55,972 (down + closing). Projections, not guarantees.
Landlord ↔ Tenant lean methodology
- Overall (STATE)
- 15 Strongly Tenant-Friendly
- State New York
- 15 Strongly Tenant-Friendly · D+10
- County
- — inherits STATE
- City
- — inherits STATE
ZIP-level market 14626
- Home prices YoY
- -31.4%
- Rents YoY
- 2.5%
- Active inventory
- 126
- Price-to-rent
- 7.9×
Monthly cashflow live
- Estimated rent
- $2,109 medium interval (Pro) →
- Mortgage (P&I)
- −$1,048
- Tax from tax record
- −$599 /mo · $7,191/yr
- Insurance
- −$83
- HOA
- −$0
- Vacancy / Maint / Mgmt
- −$443
- Net cashflow
- $-64
Break-even live
UW: 25.0% down · 7.5% · 30yr · 1.5% tax · 5.0% vac · 8.0% maint · 8.0% mgmt
Financing live
Cash to close
- Down payment
- $49,975
- Closing costs
- $5,997
- Reserves months
- —
- Total cash needed
- —
Loan-product check · same deal, 3 products live
Conventional
25% down · 7.5% · 30yr
- Down + closing
- —
- Monthly P&I
- —
- Monthly cashflow
- —
- DSCR
- —
- Eligible?
- —
Personal DTI + credit; lowest rate.
DSCR
20% down · 8.5% · 30yr
- Down + closing
- —
- Monthly P&I
- —
- Monthly cashflow
- —
- DSCR
- —
- Eligible?
- —
No personal income docs; deal must DSCR.
Hard money
10% down · 12.0% · 12mo
- Down + closing
- —
- Monthly P&I
- —
- Monthly cashflow
- —
- DSCR
- —
- Eligible?
- —
Short-term bridge; refi at stabilization.
Rent comps 2 comps
| Address | Beds | Baths | Sqft | Rent | $/sqft | DOM | Units | Dist |
|---|---|---|---|---|---|---|---|---|
| 102 Goethals Dr Rochester, NY | 2.0 | 2.0 | 1360 | $2,400 | $1.76 | 14d | 1 | 1.10mi |
| 262 Jamestown Ter Unit 2 Rochester, NY | 2.0 | 1.0 | 1242 | $2,200 | $1.77 | 43d | 1 | 1.39mi |
Listing history 8 events
-
2026-06-18status $199,900 Pending 8 DOM
-
2026-06-18days on market $199,900 Active 8 DOM
-
2026-06-17days on market $199,900 Active 7 DOM
-
2026-06-16days on market $199,900 Active 6 DOM
-
2026-06-15days on market $199,900 Active 5 DOM
-
2026-06-13days on market $199,900 Active 3 DOM
-
2026-06-13remarks 699-char remark
-
2026-06-13$199,900 Active 2 DOM
ⓘ Source: listings_history table (triggers on properties + properties_extension) + one-shot
backfill from property_details.listing_events for pre-trigger history.
Tax reassessment forecast NY · Partial reset (capped growth)
- Current annual tax
- $7,191 · $599/mo
- Projected year-2 tax
- $7,191 · $599/mo
- Expected delta
- $0/yr ($0/mo · 0.0%)
ⓘ Screening estimate from a state-policy table — verify with the county assessor before closing.
Climate risk First Street
- Flood 1/10 Low FEMA zone X (unshaded) · 0% chance over 30 yrs
- Wildfire 3/10 Moderate
- Heat 2/10 Low 7 d/yr ≥95°F today · 15 d/yr by 30 yrs out
- Wind 1/10 Low
- Air quality 2/10 Low 1 unhealthy d/yr today · 2 by 30 yrs out
Nearby sold comps map
Loading sold comps map…
Walkable amenities ~0.75 mi
Loading nearby amenities…
Taxation est. · year 1
- Rental income
- $25,314
- − Mortgage interest
- −$11,198
- − Property taxes
- −$7,191
- − Insurance
- −$1,000
- − Repairs & maintenance
- −$2,025
- − Management
- −$2,025
- − Depreciation
- −$5,815
- Taxable loss
- −$3,940
- Est. tax savings @ 24.0%
- +$946
- After-tax cash flow
- $173/yr
For passive investors: Depreciation is non-cash, so a rental often shows a tax loss while cash-flowing — sheltering income. Rental losses are passive: they offset passive income freely, and up to $25,000/yr can offset ordinary (W-2) income if you actively participate and your MAGI is under $100k (phasing out to $0 by $150k); unused losses carry forward. On sale, claimed depreciation is recaptured at up to 25%, and gains may owe capital-gains tax (a 1031 exchange can defer both). Figures are a year-1 estimate at your 24.0% rate — not tax advice; consult a CPA.
Schools (NCES district)
- District
- Greece Central School District
- NCES district ID
- 3612630
- Math proficiency
- 35% ▼ -14.00%
- Reading proficiency
- 39% ▼ -3.00%
- Median HH income
- $52,718
- Composite
- 32.26/100
- National rank
- #5761
- State rank
- #544 of 590 in NY
Livability — Greece
- Score
- 79/100
- State rank
- #145
- US rank
- #2223
Category grades
Schools grade is shown separately in the Schools card above.
Census & demographics
- Census place
- Greece, NY
- County
- Monroe County · 674,131 people
- City population
- 29,210
- Metro
- Rochester, NY
- Population (ZIP)
- 29,273
- Household income
- $78,204
- Rent vs Own
- Severe rent burden
- 810.0
Population outlook (Monroe County) Hauer SSP2
- Today (2025)
- 759,460 people
- By 2030
- 757,154 · -0.3%
- By 2040
- 740,644 · -2.5%
- By 2050
- 714,443 · -5.9%
- By 2075
- 645,883 · -15.0%
- By 2100
- 547,084 · -28.0%
Race, ethnicity, and origin ACS 2023
- Neighborhood character
- Predominantly White (77%)
- Race & ethnicity
- White 77% Black 9% Hispanic / Latino 8% Two or more races 6% Asian 3%
- Hispanic origin (detail)
- Mexican 1% Puerto Rican 5%
- Common ancestry
- Romanian 5% Lithuanian 2% Subsaharan African 2%
- Foreign-born
- 9% · Canada, Vietnam, South Korea
- Languages at home
- 89% English-only · Other Indo-European 3% Spanish 3% Russian/Polish/Slavic 1%
Political lean MEDSL · Monroe
- 2024 margin
- D (+19.1) · D 59.5% · R 40.5%
- 2008→2024 swing
- +1.4pp toward D · 2008: 17.7pp · 2024: 19.1pp
- All cycles
- 2024: D+19.1 2020: D+21.0 2016: D+14.1 2012: D+17.4 2008: D+17.7
Not yet ingested
- Civics
- —
Market trends
- HPI YoY
- ▼ -113.91%
- Current HPI
- 248.9836
- Rent YoY
- ▲ 2.50%
- Metro
- Rochester, NY
- State GDP YoY
- ▲ 2.60%
- F500 in state
- 92
Industry mix (Fortune 500 HQ in NY)
| Industry | F500 HQs | Revenue |
|---|---|---|
| Financial Services | 10 | $950B |
|
||
| Consumer Goods | 9 | $162B |
|
||
| Insurance | 4 | $225B |
|
||
| Telecommunications | 2 | $144B |
|
||
| Pharmaceuticals | 2 | $112B |
|
||
| Media / Entertainment | 2 | $69B |
|
||
Price history
+68.8% since first listed3 events — show timeline
- 2026-06-10 Listed $199,900 UNYREIS
- 2012-08-20 Listed $124,900 UNYREIS
- 2007-07-20 Sold (Public Records) $118,400 Public Records
Property tax history
+3.1%/yrLatest (2025): $7,191 · +3.4% YoY. Source: county tax records.
Cash-flow waterfall
monthlySold comps — $/sqft
last 12 mo · ≤1 miLoading sold comps…