 Duplex
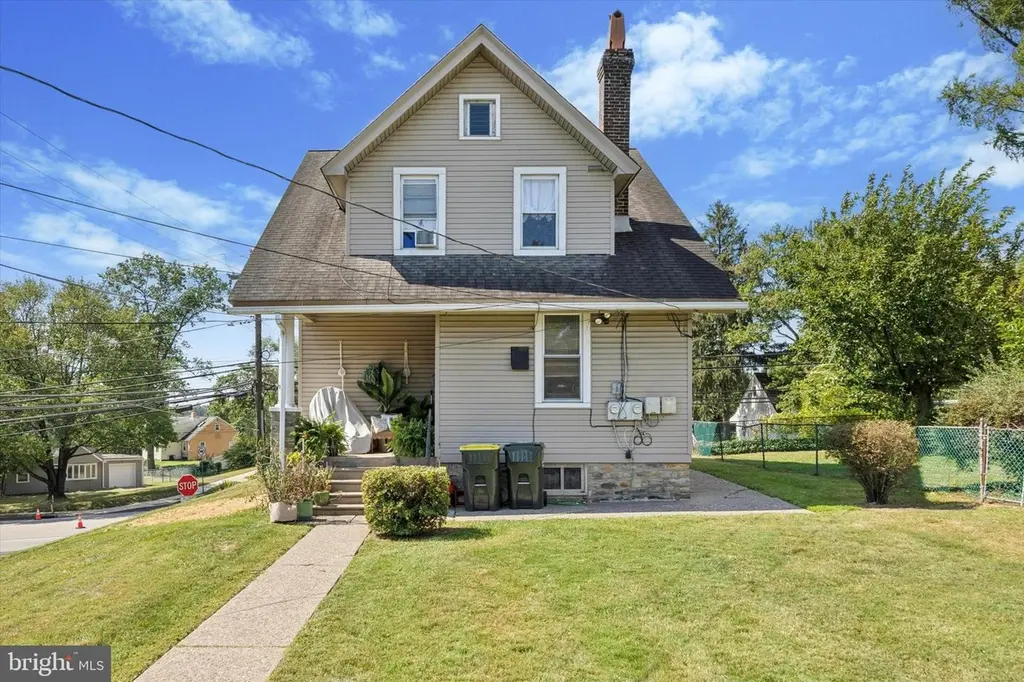
501 W Moreland Rd · Willow Grove, PA
Flood risk 1/10 · Minimal
- FEMA flood zone
- X (unshaded)
- Chance of flooding over 30 yrs
- 0.0%
- Est. flood insurance / yr
- $473 – $860
Fire risk 1/10 · Minimal
- Est. fire insurance / yr
- $511 – $949
Heat risk 6/10 · Moderate
- Hot days now (above 101°F)
- 7 days/yr
- Hot days in 30 yrs
- 15 days/yr
Wind risk 6/10 · Moderate
- Chance of severe wind over 30 yrs
- 27.0%
Air-quality risk 4/10 · Minor
- Unhealthy air days now
- 4 days/yr
- Unhealthy air days in 30 yrs
- 7 days/yr
Risk factors via First Street. Map © Google.
Why this score? — see what drove the C- grade
The composite is a weighted blend of 9 inputs, each scored 0–100. Each bar is that input's sub-score; the figure is the points it added to the 100-point composite (weight × sub-score).
- Cash flow +19.3/30.0
- ARV discount +9.0/15.0
- DSCR +6.1/10.0
- 1% rule +5.2/10.0
- Schools +4.5/10.0
- Livability +4.5/5.0
- Rent growth +3.4/5.0
- Condition / age +2.5/5.0
- Appreciation +0.0/10.0
$400,000
🖨 Deal sheet 📄 Offer letter ✓ Due diligence
Multi-family units
County records classify this as Multi-Family (2-4 Unit). Listing-text estimate: 2 units. confirmed
Listing remarks MLS
Up and down duplex with 2 bedrooms and 1 bath in each unit. Currently both units are vacant but great rental history. Estimated rent amount 1200-1300 per month for each unit. Easy to show. Basement access from first floor apartment. Driveway is off of Barrett Rd.
Key facts
- Large driveway
- Fenced yard
- Eat in kitchen
Tags
Property features AI
Finance
- Other: Estimated above-grade finished area: 1,823 (source: estimated); Lot dimensions approximately 48.00 x 0.00 (estimated)
- Financial info: Two total units (multifamily); Two vacant units
Exterior
- Parking: Driveway; Off-street parking; plenty of parking available on Barrett
- Utilities: Public water; Public sewer; Natural gas hot water; Natural gas heating; Electric for cooling
- Home design: Detached building; Pitched shingle roof; Fee simple ownership; Estimated year built
- Construction: Asbestos construction material; Stone foundation
- Exterior features: Detached structure; Other structures both above grade and below grade; Corner property (at West Moreland and Barrett)
Interior
- Bedrooms: One 1-bedroom unit; One 2-bedroom unit
- Flooring: Luxury vinyl plank
- Heating & cooling: Radiator heating with natural gas; Window air conditioning units (electric)
- Interior features: Full interior-access basement; Luxury vinyl plank flooring
Neighborhood map
What this means for you Summary
Snapshot
- This is a 2 × 3-bed/2.0-bath units multifamily listed at $400k.
Deal economics
- At list price, monthly cash flow is $438 ($5k/yr) — positive. Per door: $219/mo.
- The deal already cash-flows at list — no discount required.
- Meets the 1% rule at list price ($4k rent vs $400k).
- Recommended offer: $394k (1.5% below list) — sets the bar for market timing.
- Cap rate 7.6% vs local median 3.1% in Willow Grove — top-decile yield for the area; either an underpriced asset or a hidden risk that comps aren't pricing in. Stress-test before assuming the spread holds.
Location & tenants
- Location reads 89/100 on livability (#26 in PA, #155 nationally) — a professional / high-income tenant draw. Strengths: schools A+, crime A+, employment A+.
- Upper Moreland Township SD (suburban): math 41% / reading 62% proficiency, ranked #137 of 539 in PA (top 25%) — acceptable for families but not a draw, mixed tenant base, ~2y average lease.
- Market conditions: Rents rising (+3.5%/yr); 32 active listings in the ZIP; 5 comparable units currently listed for rent nearby; rentals at typical pace (median 18d on market — plan ~3-4 weeks tenant-placement turnaround); solid renter incomes; 1,936 units permitted in Montgomery County in 2024 (530 in 5+ unit buildings).
- At $4,094/mo this rent would consume 49% of the median local household income ($100k/yr) (locally 468% of renters already pay >50% of income on rent) — very limited rent-growth headroom before tenants either downsize or default.
Forward outlook
- Local home prices are declining (-3.0%/yr); year-one equity from $3k of loan paydown is wiped out by about $12k of value loss. Plan a longer hold.
- Montgomery County population projected at +5% by 2050 — modest demand growth; plan on rents tracking national, not racing it.
Negotiation context
- It's been on market 23 days — a 2% lower offer ($394k) is reasonable based on typical stale-listing flexibility.
- 7 sale attempts since 5y ago with the ask held roughly flat each time — persistent listings suggest the price (not the market) is what's stuck; bring a comps-based counter.
- Current owner paid $300k; 33% above their basis — modest negotiation headroom, anchor on the comps not their cost.
Risks & watch-outs
- Watch-outs: built in 1925 — expect roof / HVAC / electrical / plumbing capex.
- Climate carrying-cost: major wind risk, 27% chance of damaging wind over 30y; extreme-heat days projected 7→15/yr by 2055 (HVAC capex compounding) — expect insurance premiums to compound above CPI over the hold.
Questions for the listing agent
- Can we see the unit-by-unit rent roll, current vacancy, and any below-market leases? What's the average tenancy length?
- What capital expenditures (roof, boiler, parking lot, exteriors) have been made in the last 5 years, and what's planned in the next 2?
- Built in 1925 — when were the roof, HVAC, electrical panel, plumbing, and water heater last replaced?
- Is there a deadline driving the sale (1031 exchange, divorce, estate, relocation)? That informs how much negotiation room exists.
- Schools are A-rated — typically a magnet for longer-tenancy family renters. What's the average tenant stay here, and is there a school-zone premium baked into asking?
- What's the average days-on-market for RENTAL listings here right now (not sales)? A rising rental-DOM trend means longer vacancies and softer asking-rent achievability than the comps imply.
- What's the recent tenant-quality profile in this submarket — average credit score on applications, eviction rate, late-payment / NSF rate, and stable-employment percentage? A property-management company in the area should have these aggregated.
- How much new apartment / multifamily construction is in the pipeline within 1–3 miles? Heavy new supply (>2% of stock underway) typically softens rents 12–24 months out; light construction supports rent growth.
Investment metrics
- 1% rule
- 1.02% ✓
- Cap rate
- 7.61%
- Cash-on-cash
- 4.70%
- DSCR
- 1.21
- GRM
- 8.1
CMA / ARV
- ARV (on-the-fly)
- $413,821
- Comps found
- 4
Show comp detail 4 sales within ~0.75 mi
| Address | Dist | Beds/Ba | Sqft | Sold | Price | $/sf | Match |
|---|---|---|---|---|---|---|---|
| 501 W Moreland Rd | 0.00mi | 3/2.0 (-1) | 1,823 (0%) | 0mo | $385,000 | $211 | 95 |
| 120 Cameron Rd | 0.13mi | 4/— | 1,980 (+9%) | 9mo | $569,900 | $288 | 72 |
| 1009 W Moreland Rd | 0.32mi | 4/2.0 | 1,980 (+9%) | 11mo | $450,000 | $227 | 61 |
| 710 N York Rd | 0.67mi | 4/— | 1,920 (+5%) | 14mo | $430,000 | $224 | 48 |
Match score weights: distance 35% · size 25% · config 20% · recency 20%. Top-matched comps best support the ARV.
Projected returns pro-forma
-3.0% appreciation · 3.52% rent growth · sell at horizon
- IRR
- -8.4%
- Equity multiple
- 0.69×
- Total profit
- $-34,669
- Equity at exit
- $59,641
- IRR
- 1.8%
- Equity multiple
- 1.13×
- Total profit
- $15,013
- Equity at exit
- $34,585
Cash invested: $112,000 (down + closing). Projections, not guarantees.
Landlord ↔ Tenant lean methodology
- Overall (STATE)
- 62 Landlord-Friendly
- State Pennsylvania
- 62 Landlord-Friendly · EVEN
- County
- — inherits STATE
- City
- — inherits STATE
ZIP-level market 19090
- Rents YoY
- 3.5%
- Active inventory
- 32
- Price-to-rent
- 16.3×
Monthly cashflow live
- Estimated rent
- $4,094 high interval (Pro) →
- Mortgage (P&I)
- −$2,098
- Tax from tax record
- −$532 /mo · $6,380/yr
- Insurance
- −$167
- HOA
- −$0
- Vacancy / Maint / Mgmt
- −$860
- Net cashflow
- $438
Break-even live
2-unit breakdown (identical units grouped — click to expand)
| Units | Beds | Baths | Est. rent |
|---|---|---|---|
| 2× units | 3 | 2 | $4,094 |
| #1 | 3 | 2 | $2,047 |
| #2 | 3 | 2 | $2,047 |
| Total (2 units) | $4,094 | ||
UW: 25.0% down · 7.5% · 30yr · 1.5% tax · 5.0% vac · 8.0% maint · 8.0% mgmt
Financing live
Cash to close
- Down payment
- $100,000
- Closing costs
- $12,000
- Reserves months
- —
- Total cash needed
- —
Loan-product check · same deal, 3 products live
Conventional
25% down · 7.5% · 30yr
- Down + closing
- —
- Monthly P&I
- —
- Monthly cashflow
- —
- DSCR
- —
- Eligible?
- —
Personal DTI + credit; lowest rate.
DSCR
20% down · 8.5% · 30yr
- Down + closing
- —
- Monthly P&I
- —
- Monthly cashflow
- —
- DSCR
- —
- Eligible?
- —
No personal income docs; deal must DSCR.
Hard money
10% down · 12.0% · 12mo
- Down + closing
- —
- Monthly P&I
- —
- Monthly cashflow
- —
- DSCR
- —
- Eligible?
- —
Short-term bridge; refi at stabilization.
Rent comps 5 comps
| Address | Beds | Baths | Sqft | Rent | $/sqft | DOM | Units | Dist |
|---|---|---|---|---|---|---|---|---|
| 518 Davisville Rd Willow Grove, PA | 3.0 | 2.0 | 1400 | $2,500 | $1.79 | 43d | 1 | 0.78mi |
| 2827 Galloway Ave Abington, PA | 4.0 | 2.0 | 1708 | $2,820 | $1.65 | 18d | 1 | 0.81mi |
| 2344 Hamilton Ave Willow Grove, PA | 3.0 | 2.0 | 1920 | $2,800 | $1.46 | 16d | 1 | 0.85mi |
| 303 Overlook Ave Willow Grove, PA | 3.0 | 1.5 | 1240 | $2,750 | $2.22 | 1d | 1 | 1.06mi |
| 1325 Osbourne Ave Abington, PA | 3.0 | 1.5 | 1586 | $3,200 | $2.02 | 19d | 1 | 1.23mi |
Listing history 23 events
-
2026-04-30historical Active Under Contract
-
2026-04-07$400,000 Active
-
2026-03-16historical
-
2026-03-13$1,750
-
2026-03-09historical $1,750
-
2026-02-19price $435,000
-
2026-02-15price $1,750
-
2026-02-15price $1,700
-
2026-01-10$1,750
-
2026-01-08price $450,000
-
2025-12-25$1,800
-
2025-12-01price $465,000
-
2025-11-18status Active
-
2025-11-05historical Active Under Contract
-
2025-10-31$475,000 Active
-
2025-10-29historical
-
2021-06-07soldstatus $300,000
-
2021-05-07soldstatus $300,000 Closed 263-char remark
Show marketing remark (263 chars)
Up and down duplex with 2 bedrooms and 1 bath in each unit. Currently both units are vacant but great rental history. Estimated rent amount 1200-1300 per month for each unit. Easy to show. Basement access from first floor apartment. Driveway is off of Barrett Rd.
-
2021-04-23status Pending 263-char remark
Show marketing remark (263 chars)
Up and down duplex with 2 bedrooms and 1 bath in each unit. Currently both units are vacant but great rental history. Estimated rent amount 1200-1300 per month for each unit. Easy to show. Basement access from first floor apartment. Driveway is off of Barrett Rd.
-
2021-03-26price $300,000 263-char remark
Show marketing remark (263 chars)
Up and down duplex with 2 bedrooms and 1 bath in each unit. Currently both units are vacant but great rental history. Estimated rent amount 1200-1300 per month for each unit. Easy to show. Basement access from first floor apartment. Driveway is off of Barrett Rd.
-
2021-03-22price $330,000 263-char remark
Show marketing remark (263 chars)
Up and down duplex with 2 bedrooms and 1 bath in each unit. Currently both units are vacant but great rental history. Estimated rent amount 1200-1300 per month for each unit. Easy to show. Basement access from first floor apartment. Driveway is off of Barrett Rd.
-
2021-03-16price $340,000 263-char remark
Show marketing remark (263 chars)
Up and down duplex with 2 bedrooms and 1 bath in each unit. Currently both units are vacant but great rental history. Estimated rent amount 1200-1300 per month for each unit. Easy to show. Basement access from first floor apartment. Driveway is off of Barrett Rd.
-
2021-02-27$350,000 Active 263-char remark
Show marketing remark (263 chars)
Up and down duplex with 2 bedrooms and 1 bath in each unit. Currently both units are vacant but great rental history. Estimated rent amount 1200-1300 per month for each unit. Easy to show. Basement access from first floor apartment. Driveway is off of Barrett Rd.
ⓘ Source: listings_history table (triggers on properties + properties_extension) + one-shot
backfill from property_details.listing_events for pre-trigger history.
Tax reassessment forecast PA · Partial reset (capped growth)
- Current annual tax
- $6,380 · $532/mo
- Projected year-2 tax
- $6,380 · $532/mo
- Expected delta
- $0/yr ($0/mo · 0.0%)
ⓘ Screening estimate from a state-policy table — verify with the county assessor before closing.
Climate risk First Street
- Flood 1/10 Low FEMA zone X (unshaded) · 0% chance over 30 yrs
- Wildfire 1/10 Low
- Heat 6/10 Major 7 d/yr ≥101°F today · 15 d/yr by 30 yrs out
- Wind 6/10 Major 27% chance of damaging wind over 30 yrs
- Air quality 4/10 Moderate 4 unhealthy d/yr today · 7 by 30 yrs out
Nearby sold comps map
Loading sold comps map…
Walkable amenities ~0.75 mi
Loading nearby amenities…
Taxation est. · year 1
- Rental income
- $49,128
- − Mortgage interest
- −$22,406
- − Property taxes
- −$6,380
- − Insurance
- −$2,000
- − Repairs & maintenance
- −$3,930
- − Management
- −$3,930
- − Depreciation
- −$11,636
- Taxable loss
- −$1,155
- Est. tax savings @ 24.0%
- +$277
- After-tax cash flow
- $5,537/yr
For passive investors: Depreciation is non-cash, so a rental often shows a tax loss while cash-flowing — sheltering income. Rental losses are passive: they offset passive income freely, and up to $25,000/yr can offset ordinary (W-2) income if you actively participate and your MAGI is under $100k (phasing out to $0 by $150k); unused losses carry forward. On sale, claimed depreciation is recaptured at up to 25%, and gains may owe capital-gains tax (a 1031 exchange can defer both). Figures are a year-1 estimate at your 24.0% rate — not tax advice; consult a CPA.
Schools (NCES district)
- District
- Upper Moreland Township SD
- NCES district ID
- 4224510
- Math proficiency
- 41% ▼ -15.00%
- Reading proficiency
- 62% ▼ -10.00%
- Median HH income
- $65,085
- Composite
- 45.39/100
- National rank
- #2630
- State rank
- #137 of 539 in PA
Livability — Willow Grove
- Score
- 89/100
- State rank
- #26
- US rank
- #155
Category grades
Schools grade is shown separately in the Schools card above.
Census & demographics
- Census place
- Willow Grove, PA
- County
- Montgomery County · 712,331 people
- City population
- 19,662
- Metro
- Philadelphia-Camden-Wilmington, PA-NJ-DE-MD
- Population (ZIP)
- 19,662
- Household income
- $99,928
- Rent vs Own
- Severe rent burden
- 468.0
Population outlook (Montgomery County) Hauer SSP2
- Today (2025)
- 856,074 people
- By 2030
- 870,887 · +1.7%
- By 2040
- 891,195 · +4.1%
- By 2050
- 896,417 · +4.7%
- By 2075
- 903,212 · +5.5%
- By 2100
- 843,240 · -1.5%
Race, ethnicity, and origin ACS 2023
- Neighborhood character
- Predominantly White (69%)
- Race & ethnicity
- White 69% Black 13% Two or more races 10% Hispanic / Latino 6% Asian 5%
- Hispanic origin (detail)
- Mexican 1% Puerto Rican 2%
- Common ancestry
- Romanian 7% Scotch-Irish 3% Italian 2%
- Foreign-born
- 7% · Canada, China, South Korea
- Languages at home
- 90% English-only · Other Indo-European 3% Spanish 1% Other Asian/Pacific 1%
Political lean MEDSL · Montgomery
- 2024 margin
- Strong D (+22.8) · D 60.9% · R 38.1% · Other 1.1%
- 2008→2024 swing
- +2.0pp toward D · 2008: 20.8pp · 2024: 22.8pp
- All cycles
- 2024: D+22.8 2020: D+26.3 2016: D+21.1 2012: D+14.3 2008: D+20.8
Not yet ingested
- Civics
- —
Market trends
- HPI YoY
- ▼ -308.50%
- Current HPI
- 304.5963
- Rent YoY
- ▲ 3.52%
- Metro
- Philadelphia-Camden-Wilmington, PA-NJ-DE-MD
- State GDP YoY
- ▲ 1.68%
- F500 in state
- 34
Industry mix (Fortune 500 HQ in PA)
| Industry | F500 HQs | Revenue |
|---|---|---|
| Healthcare | 2 | $309B |
|
||
| Insurance | 2 | $27B |
|
||
| Telecommunications / Media | 1 | $124B |
|
||
| Industrial Distribution | 1 | $22B |
|
||
| Financial Services | 1 | $20B |
|
||
| Chemicals / Materials | 1 | $18B |
|
||
Price history
+14.3% since first listed23 events — show timeline
- 2026-04-30 Contingent — BRIGHT MLS
- 2026-04-07 Listed $400,000 BRIGHT MLS
- 2026-03-16 Listing Removed — BRIGHT MLS
- 2026-03-13 Listed for Rent $1,750 SHOWMOJO
- 2026-03-09 Rental Removed $1,750 SHOWMOJO
- 2026-02-19 Price Changed $435,000 BRIGHT MLS
- 2026-02-15 Price Changed $1,750 SHOWMOJO
- 2026-02-15 Price Changed $1,700 SHOWMOJO
- 2026-01-10 Listed for Rent $1,750 SHOWMOJO
- 2026-01-08 Price Changed $450,000 BRIGHT MLS
- 2025-12-25 Listed for Rent $1,800 SHOWMOJO
- 2025-12-01 Price Changed $465,000 BRIGHT MLS
- 2025-11-18 Relisted — BRIGHT MLS
- 2025-11-05 Contingent — BRIGHT MLS
- 2025-10-31 Listed $475,000 BRIGHT MLS
- 2025-10-29 Coming Soon — BRIGHT MLS
- 2021-06-07 Sold (Public Records) $300,000 Public Records
- 2021-05-07 Sold (MLS) $300,000 BRIGHT MLS
- 2021-04-23 Pending — BRIGHT MLS
- 2021-03-26 Price Changed $300,000 BRIGHT MLS
- 2021-03-22 Price Changed $330,000 BRIGHT MLS
- 2021-03-16 Price Changed $340,000 BRIGHT MLS
- 2021-02-27 Listed $350,000 BRIGHT MLS
Property tax history
+3.1%/yrLatest (2026): $6,380 · +4.5% YoY. Source: county tax records.
Cash-flow waterfall
monthlySold comps — $/sqft
last 12 mo · ≤1 miLoading sold comps…