11361 Romeo Pl · Fishers, IN
Flood risk 1/10 · Minimal
- FEMA flood zone
- X (unshaded)
- Chance of flooding over 30 yrs
- 0.0%
- Est. flood insurance / yr
- $473 – $860
Fire risk 1/10 · Minimal
- Est. fire insurance / yr
- $717 – $1,331
Heat risk 3/10 · Minor
- Hot days now (above 101°F)
- 7 days/yr
- Hot days in 30 yrs
- 18 days/yr
Wind risk 2/10 · Minimal
- Chance of severe wind over 30 yrs
- 1.0%
Air-quality risk 2/10 · Minimal
- Unhealthy air days now
- 2 days/yr
- Unhealthy air days in 30 yrs
- 2 days/yr
Risk factors via First Street. Map © Google.
Why this score? — see what drove the F grade
The composite is a weighted blend of 9 inputs, each scored 0–100. Each bar is that input's sub-score; the figure is the points it added to the 100-point composite (weight × sub-score).
- Schools +5.3/10.0
- ARV discount +5.1/15.0
- Livability +4.2/5.0
- Rent growth +2.5/5.0
- Condition / age +2.5/5.0
- Cash flow +1.9/30.0
- 1% rule +0.0/10.0
- DSCR +0.0/10.0
- Appreciation +0.0/10.0
$579,000
🖨 Deal sheet 📄 Offer letter ✓ Due diligence
Listing remarks MLS
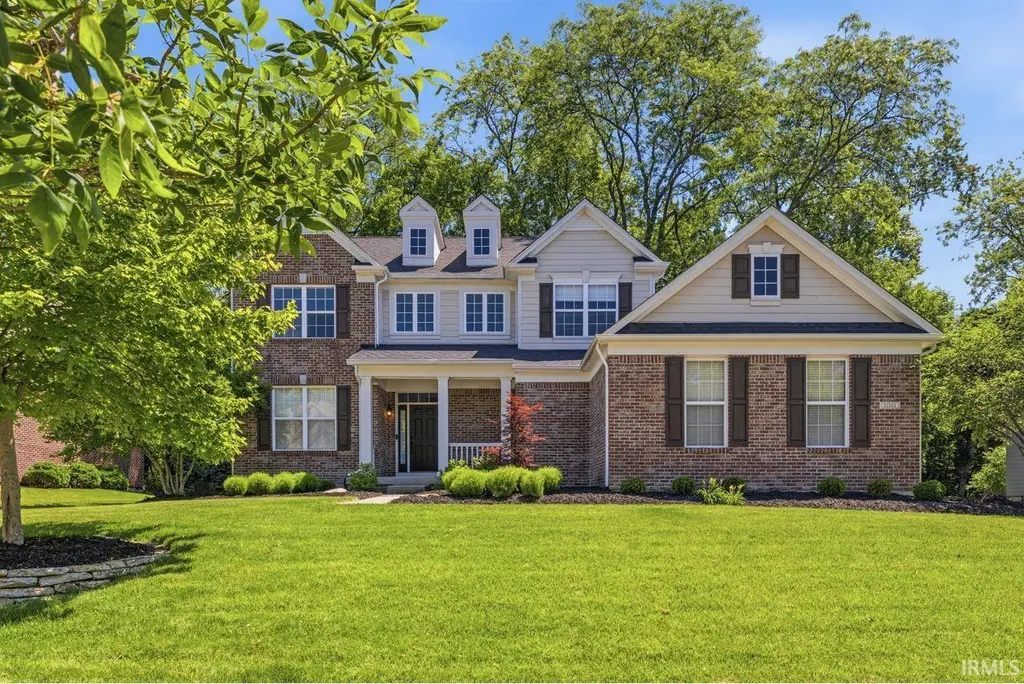
Spacious and beautifully designed 5-bedroom, 3.5-bath traditional home offering nearly 3,900 sq ft of living space! Built in 2004, this two-story home features a desirable layout with 4 bedrooms on the upper level, an additional bedroom in the basement, and a 3-car attached garage. The brick and vinyl exterior provides lasting curb appeal, while the generous living areas offer plenty of room for entertaining, working from home, or accommodating a growing family. Don't miss the opportunity to own this exceptional home with space for everyone!
Key facts
- 0.31 acre lot
- 3 garage spots
- Built 2004
Property features AI
Finance
- Other: Approximately 2,895 sq ft living area (3,897 total building area); Finished lower level space
Exterior
- Parking: Attached 3-car garage (approximately 746 sq ft)
- Utilities: Public water; Municipal sewer connected; Solid waste service available
- Home design: Single family residence; Two levels
- Construction: Brick and vinyl siding exterior; Full block foundation
- Exterior features: Approximately 0.31 acre lot (about 1/4–1/2 acre)
Interior
- Kitchen: Dishwasher; Microwave; Electric oven; Refrigerator
- Bedrooms: Four bedrooms on the upper level; One bedroom in the basement
- Bathrooms: Three full bathrooms; One half bathroom (main level)
- Heating & cooling: Forced air heating (natural gas); Central air conditioning
- Interior features: Woodwork stained or painted; Living room fireplace
Neighborhood map
What this means for you Summary
Snapshot
- This is a 3-bed/3.5-bath single-family listed at $579k.
Deal economics
- At list price, monthly cash flow is $-2k ($-26k/yr) — negative.
- To cash-flow at today's rent, offer at most $197k (66.0% below list).
- To meet the 1% rule (rent ≥ 1% of price), the offer needs to be $196k (66.1% below list).
- Recommended offer: $196k (66.1% below list) — sets the bar for 1% rule.
- Cap rate 1.8% vs local median 3.6% in Fishers — below-typical yield; the buyer is paying a premium for something (appreciation thesis, condition, location) that the cap rate doesn't capture.
Location & tenants
- Location reads 83/100 on livability (#11 in IN, #898 nationally) — a professional / high-income tenant draw. Strengths: schools A+, crime A+, amenities A+; Watch: commute F.
- Hamilton Southeastern Schools (suburban): math 57% / reading 59% proficiency, ranked #14 of 301 in IN (top 5%) — acceptable for families but not a draw, mixed tenant base, ~2y average lease; only 10% free/reduced lunch — higher-income household profile.
- Market conditions: 303 active listings in the ZIP; 4,661 units permitted in Hamilton County in 2024 (1,528 in 5+ unit buildings).
Forward outlook
- Local home prices are declining (-3.0%/yr); year-one equity from $4k of loan paydown is wiped out by about $17k of value loss. Plan a longer hold.
- Hamilton County population projected at +44% by 2050 — long-run rental-demand tailwind backs the buy-and-hold thesis.
Negotiation context
- It's been on market 15 days — a 2% lower offer ($570k) is reasonable based on typical stale-listing flexibility.
- 2 sale attempts with the ask held roughly flat each time — persistent listings suggest the price (not the market) is what's stuck; bring a comps-based counter.
Questions for the listing agent
- What do current leases actually rent for vs. the listed asking? Can we see a recent rent roll and the last 12 months of T-12 income?
- Is there a deadline driving the sale (1031 exchange, divorce, estate, relocation)? That informs how much negotiation room exists.
- Schools are A-rated — typically a magnet for longer-tenancy family renters. What's the average tenant stay here, and is there a school-zone premium baked into asking?
- The area grade is low — what's the realistic commute time and amenity access for the typical tenant pool here? Any planned neighborhood developments (good or bad) we should know about?
- What's the average days-on-market for RENTAL listings here right now (not sales)? A rising rental-DOM trend means longer vacancies and softer asking-rent achievability than the comps imply.
- What's the recent tenant-quality profile in this submarket — average credit score on applications, eviction rate, late-payment / NSF rate, and stable-employment percentage? A property-management company in the area should have these aggregated.
- How much new for-sale + rental construction is in the pipeline within 1–3 miles? Heavy new supply typically softens prices + rents 12–24 months out; constrained supply supports both.
Investment metrics
- 1% rule
- 0.34% ✗
- Cap rate
- 1.81%
- Cash-on-cash
- -16.00%
- DSCR
- 0.29
- GRM
- 24.6
CMA / ARV
- ARV (on-the-fly)
- $549,252
- Comps found
- 12
Show comp detail 12 sales within ~0.75 mi
| Address | Dist | Beds/Ba | Sqft | Sold | Price | $/sf | Match |
|---|---|---|---|---|---|---|---|
| 11341 Romeo Pl | 0.02mi | 3/3.0 | 3,450 (-8%) | 0mo | $599,900 | $174 | 83 |
| 14846 Starboard Rd | 0.15mi | 4/3.5 (+1) | 3,816 (+1%) | 6mo | $560,000 | $147 | 80 |
| 15097 Newburyport Dr | 0.35mi | 3/4.0 | 3,848 (+2%) | 22mo | $560,000 | $146 | 59 |
| 15088 Keel Rd | 0.31mi | 4/4.0 (+1) | 3,685 (-2%) | 20mo | $585,000 | $159 | 58 |
| 14459 Stanley Ter | 0.65mi | 4/3.5 (+1) | 3,584 (-5%) | 2mo | $522,000 | $146 | 56 |
| 14211 Monarchy Ln | 0.68mi | 4/3.5 (+1) | 3,909 (+4%) | 2mo | $580,000 | $148 | 55 |
| 14870 Starboard Rd | 0.15mi | 4/2.5 (+1) | 4,288 (+14%) | 15mo | $560,000 | $131 | 49 |
| 14611 Cuchara Ct | 0.31mi | 4/2.5 (+1) | 4,080 (+8%) | 21mo | $535,000 | $131 | 45 |
| 11750 Gatwick View Dr | 0.57mi | 4/3.5 (+1) | 3,436 (-9%) | 17mo | $485,000 | $141 | 40 |
| 11763 Moate Dr | 0.74mi | 3/2.0 | 4,072 (+8%) | 19mo | $424,000 | $104 | 30 |
| 11789 Langham Crescent Ct | 0.60mi | 4/2.5 (+1) | 3,238 (-14%) | 13mo | $485,000 | $150 | 29 |
| 11820 Monarchy Ln | 0.74mi | 4/2.5 (+1) | 4,003 (+6%) | 23mo | $440,000 | $110 | 27 |
Match score weights: distance 35% · size 25% · config 20% · recency 20%. Top-matched comps best support the ARV.
Projected returns pro-forma
-3.0% appreciation · 3.0% rent growth · sell at horizon
- IRR
- -47.6%
- Equity multiple
- -0.43×
- Total profit
- $-231,670
- Equity at exit
- $86,331
- IRR
- -91.4%
- Equity multiple
- -1.34×
- Total profit
- $-379,644
- Equity at exit
- $50,061
Cash invested: $162,120 (down + closing). Projections, not guarantees.
Landlord ↔ Tenant lean methodology
- Overall (STATE)
- 90 Strongly Landlord-Friendly
- State Indiana
- 90 Strongly Landlord-Friendly · R+11
- County
- — inherits STATE
- City
- — inherits STATE
ZIP-level market 46040
- Home prices YoY
- -24.4%
- Active inventory
- 303
- Price-to-rent
- 24.6×
Monthly cashflow live
- Estimated rent
- $1,963 medium interval (Pro) →
- Mortgage (P&I)
- −$3,036
- Tax from tax record
- −$435 /mo · $5,223/yr
- Insurance
- −$241
- HOA
- −$0
- Vacancy / Maint / Mgmt
- −$412
- Net cashflow
- $-2,162
Break-even live
UW: 25.0% down · 7.5% · 30yr · 1.5% tax · 5.0% vac · 8.0% maint · 8.0% mgmt
Financing live
Cash to close
- Down payment
- $144,750
- Closing costs
- $17,370
- Reserves months
- —
- Total cash needed
- —
Loan-product check · same deal, 3 products live
Conventional
25% down · 7.5% · 30yr
- Down + closing
- —
- Monthly P&I
- —
- Monthly cashflow
- —
- DSCR
- —
- Eligible?
- —
Personal DTI + credit; lowest rate.
DSCR
20% down · 8.5% · 30yr
- Down + closing
- —
- Monthly P&I
- —
- Monthly cashflow
- —
- DSCR
- —
- Eligible?
- —
No personal income docs; deal must DSCR.
Hard money
10% down · 12.0% · 12mo
- Down + closing
- —
- Monthly P&I
- —
- Monthly cashflow
- —
- DSCR
- —
- Eligible?
- —
Short-term bridge; refi at stabilization.
Listing history 9 events
-
2026-06-18days on market $579,000 Active 15 DOM
-
2026-06-17days on market $579,000 Active 14 DOM
-
2026-06-16days on market $579,000 Active 13 DOM
-
2026-06-15days on market $579,000 Active 12 DOM
-
2026-06-13pricedays on market $579,000 Active 10 DOM
-
2026-06-09days on market $589,000 Active 6 DOM
-
2026-06-08days on market $589,000 Active 5 DOM
-
2026-06-07remarks 547-char remark
-
2026-06-07$589,000 Active 4 DOM
ⓘ Source: listings_history table (triggers on properties + properties_extension) + one-shot
backfill from property_details.listing_events for pre-trigger history.
Tax reassessment forecast IN · Partial reset (capped growth)
- Current annual tax
- $5,223 · $435/mo
- Projected year-2 tax
- $5,223 · $435/mo
- Expected delta
- $0/yr ($0/mo · 0.0%)
ⓘ Screening estimate from a state-policy table — verify with the county assessor before closing.
Climate risk First Street
- Flood 1/10 Low FEMA zone X (unshaded) · 0% chance over 30 yrs
- Wildfire 1/10 Low
- Heat 3/10 Moderate 7 d/yr ≥101°F today · 18 d/yr by 30 yrs out
- Wind 2/10 Low 100% chance of damaging wind over 30 yrs
- Air quality 2/10 Low 2 unhealthy d/yr today · 2 by 30 yrs out
Nearby sold comps map
Loading sold comps map…
Walkable amenities ~0.75 mi
Loading nearby amenities…
Taxation est. · year 1
- Rental income
- $23,557
- − Mortgage interest
- −$32,433
- − Property taxes
- −$5,223
- − Insurance
- −$2,895
- − Repairs & maintenance
- −$1,885
- − Management
- −$1,885
- − Depreciation
- −$16,844
- Taxable loss
- −$37,607
- Est. tax savings @ 24.0%
- +$9,026
- After-tax cash flow
- $-16,918/yr
For passive investors: Depreciation is non-cash, so a rental often shows a tax loss while cash-flowing — sheltering income. Rental losses are passive: they offset passive income freely, and up to $25,000/yr can offset ordinary (W-2) income if you actively participate and your MAGI is under $100k (phasing out to $0 by $150k); unused losses carry forward. On sale, claimed depreciation is recaptured at up to 25%, and gains may owe capital-gains tax (a 1031 exchange can defer both). Figures are a year-1 estimate at your 24.0% rate — not tax advice; consult a CPA.
Schools (NCES district)
- District
- Hamilton Southeastern Schools
- NCES district ID
- 1810650
- Math proficiency
- 57% ▼ -11.00%
- Reading proficiency
- 59% ▼ -7.00%
- Median HH income
- $87,726
- Composite
- 53.02/100
- National rank
- #1520
- State rank
- #14 of 301 in IN
Livability — Fishers
- Score
- 83/100
- State rank
- #11
- US rank
- #898
Category grades
Schools grade is shown separately in the Schools card above.
Census & demographics
- Census place
- Fishers, IN
- City population
- 92,467
- Population (ZIP)
- 17,891
Population outlook (Hamilton County) Hauer SSP2
- Today (2025)
- 381,938 people
- By 2030
- 417,496 · +9.3%
- By 2040
- 486,684 · +27.4%
- By 2050
- 549,805 · +44.0%
- By 2075
- 687,078 · +79.9%
- By 2100
- 754,495 · +97.5%
Race, ethnicity, and origin ACS 2023
- Neighborhood character
- Predominantly White (83%)
- Race & ethnicity
- White 83% Black 6% Two or more races 4% Asian 4% Hispanic / Latino 2%
- Common ancestry
- Lithuanian 5% Romanian 2% Portuguese 2%
- Foreign-born
- 5% · Canada
- Languages at home
- 94% English-only · Other Indo-European 3% Arabic 1% Spanish 1%
Political lean MEDSL · Hamilton
- 2024 margin
- Lean R (+6.1) · D 46.0% · R 52.1% · Other 1.9%
- 2008→2024 swing
- +16.2pp toward D · 2008: -22.2pp · 2024: -6.1pp
- All cycles
- 2024: R+6.1 2020: R+6.8 2016: R+19.6 2012: R+34.3 2008: R+22.2
Not yet ingested
- Civics
- —
Market trends
- HPI YoY
- ▼ -71.54%
- Current HPI
- 221.8703
- Rent YoY
- —
- Metro
- —
- State GDP YoY
- ▲ 2.90%
- F500 in state
- 18
Industry mix (Fortune 500 HQ in IN)
| Industry | F500 HQs | Revenue |
|---|---|---|
| Industrial Machinery | 2 | $37B |
|
||
| Healthcare | 1 | $177B |
|
||
| Pharmaceuticals | 1 | $45B |
|
||
| Metals / Steel | 1 | $18B |
|
||
| Agriculture | 1 | $17B |
|
||
| Packaging | 1 | $12B |
|
||
Price history
+0.0% since first listed2 events — show timeline
- 2026-06-03 Listed $589,000 IRMLS
- 2026-06-03 Listed $589,000 MIBOR as Distributed by MLS Grid
Property tax history
+4.4%/yrLatest (2025): $5,223 · -3.7% YoY. Source: county tax records.
Cash-flow waterfall
monthlySold comps — $/sqft
last 12 mo · ≤1 miLoading sold comps…