14537 77th Pl N · The Acreage, FL
Flood risk 1/10 · Minimal
- FEMA flood zone
- X (unshaded)
- Chance of flooding over 30 yrs
- 0.0%
- Est. flood insurance / yr
- $507 – $1,088
Fire risk 1/10 · Minimal
- Est. fire insurance / yr
- $947 – $1,759
Heat risk 9/10 · Severe
- Hot days now (above 107°F)
- 7 days/yr
- Hot days in 30 yrs
- 25 days/yr
Wind risk 10/10 · Severe
- Chance of severe wind over 30 yrs
- 99.0%
Air-quality risk 2/10 · Minimal
- Unhealthy air days now
- 1 days/yr
- Unhealthy air days in 30 yrs
- 2 days/yr
Risk factors via First Street. Map © Google.
Why this score? — see what drove the F grade
The composite is a weighted blend of 9 inputs, each scored 0–100. Each bar is that input's sub-score; the figure is the points it added to the 100-point composite (weight × sub-score).
- ARV discount +7.5/15.0
- Cash flow +7.3/30.0
- Rent growth +4.4/5.0
- Schools +4.3/10.0
- Livability +3.4/5.0
- Condition / age +2.5/5.0
- DSCR +1.4/10.0
- 1% rule +1.2/10.0
- Appreciation +0.0/10.0
$649,900
🖨 Deal sheet 📄 Offer letter ✓ Due diligence
Listing remarks MLS
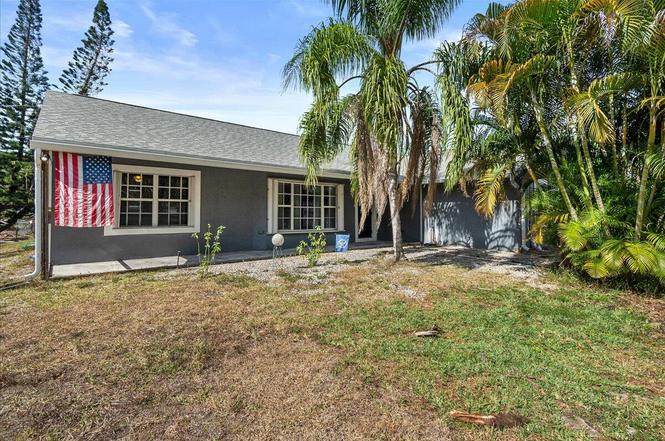
Bank owned ready for a quick close. Large wood frame home with 4 beds. Tile floors, fresh interior paint. This information is deemed reliable but not guaranteed. BUYER is responsible for verifying all information prior to close. Please email LA with any questions you have about property.
Key facts
- Accordion shutters
- Modernized bathrooms
- New roof
Tags
Property features AI
Finance
- Other: Pets allowed with no restrictions
Exterior
- Parking: Attached 1-car garage; 1 covered parking space; Open parking
- Utilities: Well water; Septic tank; Three-phase electric; Cable available; Electricity available; Water available
- Home design: Single-family residence; One story; Resale property; Faces southeast
- Construction: CBS construction; Other roof
- Exterior features: Open patio; Patio; Fenced yard; Not waterfront
Interior
- Kitchen: Dishwasher; Electric range; Microwave; Refrigerator
- Bedrooms: 4 bedrooms on the main level
- Flooring: Ceramic tile
- Bathrooms: 2 full bathrooms on the main level
- Heating & cooling: Central heating (electric); Central air conditioning (electric); Ceiling fans
- Interior features: Walk-in closets; Blinds
Neighborhood map
What this means for you Summary
Snapshot
- This is a 3-bed/2.0-bath single-family listed at $650k.
Deal economics
- At list price, monthly cash flow is $-871 ($-10k/yr) — negative.
- To cash-flow at today's rent, offer at most $496k (23.7% below list).
- To meet the 1% rule (rent ≥ 1% of price), the offer needs to be $402k (38.1% below list).
- Recommended offer: $402k (38.1% below list) — sets the bar for 1% rule.
Location & tenants
- Location reads 67/100 on livability (#550 in FL) — a middle-class / working-renter tenant base. Strengths: crime A+, employment A+, housing A+; Watch: amenities F, commute F, cost of living F.
- Palm Beach (suburban): math 46% / reading 53% proficiency, ranked #34 of 73 in FL (top 47%) — families likely to look elsewhere, expect single-tenant / working-renter base with shorter leases.
- Zoned schools: Acreage Pines Elementary School (math 53% / reading 60%, grade C+, #816 of 2,144 statewide, top 39%, 547 students, 36% FRL); Western Pines Community Middle (math 66% / reading 64%, grade A-, #99 of 571 statewide, top 17%, 991 students, 42% FRL); Seminole Ridge Community High School (math 36% / reading 56%, grade D-, #220 of 667 statewide, top 33%, 2,262 students, 36% FRL).
- Market conditions: Rents rising fast (+7.7%/yr); 594 active listings in the ZIP; 1 comparable units currently listed for rent nearby; high-income renter base; 3,974 units permitted in Palm Beach County in 2024 (1,012 in 5+ unit buildings).
- This rent runs 40% of the median local income ($122k/yr) — at the standard rent-burdened threshold; future hikes will face affordability resistance.
Forward outlook
- Local home prices are declining (-3.0%/yr); year-one equity from $4k of loan paydown is wiped out by about $19k of value loss. Plan a longer hold.
- Palm Beach County population projected at +30% by 2050 — long-run rental-demand tailwind backs the buy-and-hold thesis.
Negotiation context
- It's been on market 107 days — a 9% lower offer ($591k) is reasonable based on typical stale-listing flexibility.
- 6 sale attempts since 24y ago; this cycle's ask has dropped $50k (7%) from the opening price — seller is motivated, your offer sets the floor, not the list.
- Current owner paid $130k; list at $650k implies a 400% gain — meaningful room to come down on a strong offer.
Risks & watch-outs
- Climate carrying-cost: severe wind risk, 99% chance of damaging wind over 30y; extreme-heat days projected 7→25/yr by 2055 (HVAC capex compounding) — expect insurance premiums to compound above CPI over the hold.
Questions for the listing agent
- What do current leases actually rent for vs. the listed asking? Can we see a recent rent roll and the last 12 months of T-12 income?
- It's been on market 107 days. Have you received any prior offers? Is the seller open to a 38% concession, seller financing, or rate buy-down credit?
- Why hasn't it sold? Are there any deal-killer items the seller is aware of (foundation, flood, title, zoning, code violations)?
- Is there a deadline driving the sale (1031 exchange, divorce, estate, relocation)? That informs how much negotiation room exists.
- Schools are B-rated — typically a magnet for longer-tenancy family renters. What's the average tenant stay here, and is there a school-zone premium baked into asking?
- The area grade is low — what's the realistic commute time and amenity access for the typical tenant pool here? Any planned neighborhood developments (good or bad) we should know about?
- What's the average days-on-market for RENTAL listings here right now (not sales)? A rising rental-DOM trend means longer vacancies and softer asking-rent achievability than the comps imply.
- What's the recent tenant-quality profile in this submarket — average credit score on applications, eviction rate, late-payment / NSF rate, and stable-employment percentage? A property-management company in the area should have these aggregated.
- How much new for-sale + rental construction is in the pipeline within 1–3 miles? Heavy new supply typically softens prices + rents 12–24 months out; constrained supply supports both.
Investment metrics
- 1% rule
- 0.62% ✗
- Cap rate
- 4.68%
- Cash-on-cash
- -5.75%
- DSCR
- 0.74
- GRM
- 13.5
CMA / ARV
No comps found within radius.
Projected returns pro-forma
-3.0% appreciation · 7.68% rent growth · sell at horizon
- IRR
- -21.7%
- Equity multiple
- 0.22×
- Total profit
- $-141,184
- Equity at exit
- $96,902
- IRR
- -7.8%
- Equity multiple
- 0.42×
- Total profit
- $-105,594
- Equity at exit
- $56,191
Cash invested: $181,972 (down + closing). Projections, not guarantees.
Landlord ↔ Tenant lean methodology
- Overall (STATE)
- 87 Strongly Landlord-Friendly
- State Florida
- 87 Strongly Landlord-Friendly · R+3
- County
- — inherits STATE
- City
- — inherits STATE
ZIP-level market 33470
- Home prices YoY
- -23.3%
- Rents YoY
- 7.7%
- Active inventory
- 594
- Price-to-rent
- 13.5×
Monthly cashflow live
- Estimated rent
- $4,022 medium interval (Pro) →
- Mortgage (P&I)
- −$3,408
- Tax from tax record
- −$370 /mo · $4,440/yr
- Insurance
- −$271
- HOA
- −$0
- Vacancy / Maint / Mgmt
- −$845
- Net cashflow
- $-871
Break-even live
UW: 25.0% down · 7.5% · 30yr · 1.5% tax · 5.0% vac · 8.0% maint · 8.0% mgmt
Financing live
Cash to close
- Down payment
- $162,475
- Closing costs
- $19,497
- Reserves months
- —
- Total cash needed
- —
Loan-product check · same deal, 3 products live
Conventional
25% down · 7.5% · 30yr
- Down + closing
- —
- Monthly P&I
- —
- Monthly cashflow
- —
- DSCR
- —
- Eligible?
- —
Personal DTI + credit; lowest rate.
DSCR
20% down · 8.5% · 30yr
- Down + closing
- —
- Monthly P&I
- —
- Monthly cashflow
- —
- DSCR
- —
- Eligible?
- —
No personal income docs; deal must DSCR.
Hard money
10% down · 12.0% · 12mo
- Down + closing
- —
- Monthly P&I
- —
- Monthly cashflow
- —
- DSCR
- —
- Eligible?
- —
Short-term bridge; refi at stabilization.
Rent comps 1 comps
| Address | Beds | Baths | Sqft | Rent | $/sqft | DOM | Units | Dist |
|---|---|---|---|---|---|---|---|---|
| 13253 75th Ln N West Palm Beach, FL | 3.0 | 2.0 | 1957 | $4,700 | $2.40 | 17d | 1 | 1.32mi |
Listing history 33 events
-
2026-06-18days on market $649,900 Active 107 DOM
-
2026-06-17days on market $649,900 Active 106 DOM
-
2026-06-16days on market $649,900 Active 105 DOM
-
2026-06-15price $649,900 Active 104 DOM
-
2026-06-15days on market $675,000 Active 104 DOM
-
2026-06-13days on market $675,000 Active 102 DOM
-
2026-06-09days on market $675,000 Active 98 DOM
-
2026-06-08days on market $675,000 Active 97 DOM
-
2026-06-07days on market $675,000 Active 96 DOM
-
2026-06-04days on market $675,000 Active 93 DOM
-
2026-06-03days on market $675,000 Active 92 DOM
-
2026-06-02days on market $675,000 Active 91 DOM
-
2026-06-01days on market $675,000 Active 90 DOM
-
2026-05-31days on market $675,000 Active 89 DOM
-
2026-05-04price $675,000
-
2026-03-03$699,999 Active
-
2014-10-29historical
-
2010-12-10soldstatus $129,900 288-char remark
Show marketing remark (288 chars)
Bank owned ready for a quick close. Large wood frame home with 4 beds. Tile floors, fresh interior paint. This information is deemed reliable but not guaranteed. BUYER is responsible for verifying all information prior to close. Please email LA with any questions you have about property.
-
2010-09-30historical 288-char remark
Show marketing remark (288 chars)
Bank owned ready for a quick close. Large wood frame home with 4 beds. Tile floors, fresh interior paint. This information is deemed reliable but not guaranteed. BUYER is responsible for verifying all information prior to close. Please email LA with any questions you have about property.
-
2010-04-07$129,900 288-char remark
Show marketing remark (288 chars)
Bank owned ready for a quick close. Large wood frame home with 4 beds. Tile floors, fresh interior paint. This information is deemed reliable but not guaranteed. BUYER is responsible for verifying all information prior to close. Please email LA with any questions you have about property.
-
2007-04-09historical
-
2007-02-20$475,000
-
2005-07-12soldstatus $372,900
-
2005-07-01soldstatus $372,900
-
2005-06-24historical
-
2005-04-19$379,000
-
2003-04-15soldstatus $188,000
-
2003-04-11soldstatus $188,000
-
2002-11-21historical
-
2002-10-14$192,500
-
2002-05-01$189,000
-
1997-08-27soldstatus $140,900
-
1996-12-11soldstatus $23,000
ⓘ Source: listings_history table (triggers on properties + properties_extension) + one-shot
backfill from property_details.listing_events for pre-trigger history.
Tax reassessment forecast FL · Resets to sale price
- Current annual tax
- $4,440 · $370/mo
- Projected year-2 tax
- $5,394 · $450/mo
- Expected delta
- +$954/yr (+$79/mo · 21.5%)
ⓘ Screening estimate from a state-policy table — verify with the county assessor before closing.
Climate risk First Street
- Flood 1/10 Low FEMA zone X (unshaded) · 0% chance over 30 yrs
- Wildfire 1/10 Low
- Heat 9/10 Extreme 7 d/yr ≥107°F today · 25 d/yr by 30 yrs out
- Wind 10/10 Extreme 99% chance of damaging wind over 30 yrs
- Air quality 2/10 Low 1 unhealthy d/yr today · 2 by 30 yrs out
Nearby sold comps map
Loading sold comps map…
Walkable amenities ~0.75 mi
Loading nearby amenities…
Taxation est. · year 1
- Rental income
- $48,268
- − Mortgage interest
- −$36,405
- − Property taxes
- −$4,440
- − Insurance
- −$3,250
- − Repairs & maintenance
- −$3,861
- − Management
- −$3,861
- − Depreciation
- −$18,906
- Taxable loss
- −$22,456
- Est. tax savings @ 24.0%
- +$5,389
- After-tax cash flow
- $-5,067/yr
For passive investors: Depreciation is non-cash, so a rental often shows a tax loss while cash-flowing — sheltering income. Rental losses are passive: they offset passive income freely, and up to $25,000/yr can offset ordinary (W-2) income if you actively participate and your MAGI is under $100k (phasing out to $0 by $150k); unused losses carry forward. On sale, claimed depreciation is recaptured at up to 25%, and gains may owe capital-gains tax (a 1031 exchange can defer both). Figures are a year-1 estimate at your 24.0% rate — not tax advice; consult a CPA.
Schools (NCES district)
- District
- Palm Beach
- NCES district ID
- 1201500
- Math proficiency
- 46% ▼ -16.00%
- Reading proficiency
- 53% ▼ -4.00%
- Median HH income
- $53,943
- Composite
- 42.72/100
- National rank
- #3160
- State rank
- #34 of 73 in FL
Livability — The Acreage
- Score
- 67/100
- State rank
- #550
- US rank
- #10381
Category grades
Schools grade is shown separately in the Schools card above.
Census & demographics
- Census place
- The Acreage, FL
- County
- Palm Beach County · 1,438,312 people
- Metro
- Miami-Fort Lauderdale-Pompano Beach, FL
- Population (ZIP)
- 35,610
- Household income
- $122,163
- Rent vs Own
- Severe rent burden
- 43.0
Population outlook (Palm Beach County) Hauer SSP2
- Today (2025)
- 1,637,487 people
- By 2030
- 1,743,255 · +6.5%
- By 2040
- 1,948,712 · +19.0%
- By 2050
- 2,132,979 · +30.3%
- By 2075
- 2,530,027 · +54.5%
- By 2100
- 2,706,979 · +65.3%
Race, ethnicity, and origin ACS 2023
- Neighborhood character
- Diverse neighborhood (Simpson 0.58)
- Race & ethnicity
- White 59% Hispanic / Latino 24% Two or more races 16% Black 10% Asian 2%
- Hispanic origin (detail)
- Mexican 2% Puerto Rican 5% Cuban 6% Dominican 2%
- Common ancestry
- Lithuanian 3% Romanian 2% Italian 2%
- Foreign-born
- 19% · Canada, Jamaica
- Languages at home
- 77% English-only · Spanish 18% French/Haitian/Cajun 2% Other Indo-European 1%
Political lean MEDSL · Palm Beach
- 2024 margin
- Toss-up / Even · D 50.0% · R 49.2%
- 2008→2024 swing
- -22.1pp toward R · 2008: 22.9pp · 2024: 0.8pp
- All cycles
- 2024: D+0.8 2020: D+12.8 2016: D+15.3 2012: D+17.0 2008: D+22.9
Not yet ingested
- Civics
- —
Market trends
- HPI YoY
- ▼ -124.68%
- Current HPI
- 410.2689
- Rent YoY
- ▲ 7.68%
- Metro
- Miami-Fort Lauderdale-Pompano Beach, FL
- State GDP YoY
- ▲ 3.28%
- F500 in state
- 36
Industry mix (Fortune 500 HQ in FL)
| Industry | F500 HQs | Revenue |
|---|---|---|
| Industrial Technology | 2 | $29B |
|
||
| Insurance | 2 | $17B |
|
||
| Retail | 1 | $60B |
|
||
| Technology Distribution | 1 | $58B |
|
||
| Homebuilding | 1 | $35B |
|
||
| Technology Manufacturing | 1 | $35B |
|
||
Price history
+2834.8% since first listed19 events — show timeline
- 2026-05-04 Price Changed $675,000 Beaches MLS
- 2026-03-03 Listed $699,999 Beaches MLS
- 2014-10-29 Listing Removed — Beaches MLS
- 2010-12-10 Sold (MLS) $129,900 Beaches MLS
- 2010-09-30 Listing Removed — Beaches MLS
- 2010-04-07 Listed $129,900 Beaches MLS
- 2007-04-09 Listing Removed — Beaches MLS
- 2007-02-20 Listed $475,000 Beaches MLS
- 2005-07-12 Sold (Public Records) $372,900 Public Records
- 2005-07-01 Sold (MLS) $372,900 Beaches MLS
- 2005-06-24 Listing Removed — Beaches MLS
- 2005-04-19 Listed $379,000 Beaches MLS
- 2003-04-15 Sold (Public Records) $188,000 Public Records
- 2003-04-11 Sold (MLS) $188,000 Beaches MLS
- 2002-11-21 Listing Removed — Beaches MLS
- 2002-10-14 Listed $192,500 Beaches MLS
- 2002-05-01 Listed $189,000 Beaches MLS
- 1997-08-27 Sold (Public Records) $140,900 Public Records
- 1996-12-11 Sold (Public Records) $23,000 Public Records
Property tax history
+2.2%/yrLatest (2025): $4,440 · +4.4% YoY. Source: county tax records.
Cash-flow waterfall
monthlySold comps — $/sqft
last 12 mo · ≤1 miLoading sold comps…