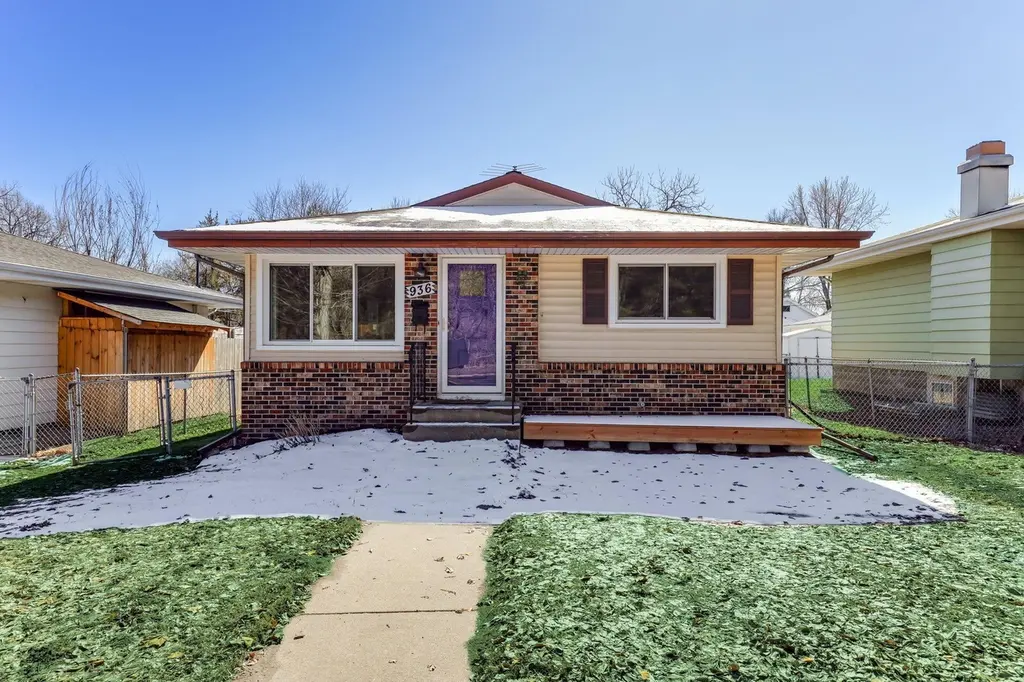
936 Jefferson Ave · St. Paul, MN
Flood risk 6/10 · Moderate
- FEMA flood zone
- X (unshaded)
- Chance of flooding over 30 yrs
- 0.68%
- Est. flood insurance / yr
- $473 – $860
Fire risk 1/10 · Minimal
- Est. fire insurance / yr
- $888 – $1,650
Heat risk 2/10 · Minimal
- Hot days now (above 100°F)
- 7 days/yr
- Hot days in 30 yrs
- 14 days/yr
Wind risk 2/10 · Minimal
- Chance of severe wind over 30 yrs
- —
Air-quality risk 2/10 · Minimal
- Unhealthy air days now
- 1 days/yr
- Unhealthy air days in 30 yrs
- 1 days/yr
Risk factors via First Street. Map © Google.
Why this score? — see what drove the D- grade
The composite is a weighted blend of 9 inputs, each scored 0–100. Each bar is that input's sub-score; the figure is the points it added to the 100-point composite (weight × sub-score).
- Cash flow +11.2/30.0
- ARV discount +7.5/15.0
- 1% rule +3.7/10.0
- DSCR +3.3/10.0
- Rent growth +2.9/5.0
- Livability +2.5/5.0
- Condition / age +2.5/5.0
- Schools +2.4/10.0
- Appreciation +0.0/10.0
$300,000
🖨 Deal sheet 📄 Offer letter ✓ Due diligence
Listing remarks
This Saint Paul home gives you the space and flexibility that can be hard to find. Inside, the main level features beautiful LVP flooring that adds a clean, modern look and is built to handle everyday living. The kitchen is both stylish and functional with granite countertops, a tile backsplash, stainless steel appliances, and a breakfast bar that makes a great spot for quick meals or casual conversation. Outside, the fenced backyard gives you room to enjoy the outdoors, garden, or let pets play, while the detached two-car garage provides convenient parking and extra storage. You’ll also appreciate the location, just minutes from the Ayd Mill Road biking and walking path, the bus line
Key facts
- Lvp flooring
- Granite countertops
- Fenced backyard
Tags
Property features AI
Exterior
- Parking: Detached/attached 2-car garage with garage door opener; Asphalt parking; Garage dimensions approximately 24x25
- Utilities: City water (connected); City sewer (connected); Natural gas; Electric with circuit breakers (100 Amp service)
- Home design: Residential property; One level (single-story) with lower-level living space; Main-level living area with additional finished lower level
- Construction: Frame construction; Block foundation
- Exterior features: Vinyl exterior; Partial chain link fencing; Public transit within about six blocks; Other on-site structure: garage(s)
Interior
- Kitchen: Range; Microwave; Dishwasher; Refrigerator; Stainless steel appliances; Breakfast bar
- Bedrooms: 3 bedrooms on one level (main floor); Additional lower-level bedrooms/rooms available
- Bathrooms: 2 full bathrooms (one on main floor and one in the finished basement)
- Heating & cooling: Forced air heating; Central air conditioning
- Interior features: Finished basement with egress window(s), storage space, and sump pump; Humidifier; Kitchen window; Main floor primary bedroom; Breakfast bar and informal dining area
- Laundry & utility: Washer and dryer; Gas water heater; Utility room in lower level
Neighborhood map
What this means for you Summary
Snapshot
- This is a 5-bed/2.0-bath single-family listed at $300k.
Deal economics
- At list price, monthly cash flow is $-114 ($-1k/yr) — negative.
- To cash-flow at today's rent, offer at most $280k (6.7% below list).
- To meet the 1% rule (rent ≥ 1% of price), the offer needs to be $260k (13.3% below list).
- Recommended offer: $260k (13.3% below list) — sets the bar for 1% rule.
Location & tenants
- Location reads: area grade D — affects rentability + tenant quality, not the cash-flow math above.
- St. Paul Public School District (urban): math 21% / reading 33% proficiency, ranked #270 of 301 in MN (top 90%) — low school quality limits family demand, transient renter base, plan for 1-2y turnover; 64% free/reduced lunch — lower-income household profile, screen leases tightly.
- Market conditions: Rents rising (+1.6%/yr); 145 active listings in the ZIP; solid renter incomes; 1,202 units permitted in Ramsey County in 2024 (880 in 5+ unit buildings).
- This rent runs 41% of the median local income ($76k/yr) — at the standard rent-burdened threshold; future hikes will face affordability resistance.
Forward outlook
- Local home prices are declining (-3.0%/yr); year-one equity from $2k of loan paydown is wiped out by about $9k of value loss. Plan a longer hold.
- Ramsey County population projected at +27% by 2050 — long-run rental-demand tailwind backs the buy-and-hold thesis.
Negotiation context
- Only 14 days on market — expect competitive offers; lowballing is unlikely to land.
- 9 sale attempts since 33y ago with the ask held roughly flat each time — persistent listings suggest the price (not the market) is what's stuck; bring a comps-based counter.
Risks & watch-outs
- Climate carrying-cost: major flood risk — expect insurance premiums to compound above CPI over the hold.
Questions for the listing agent
- What do current leases actually rent for vs. the listed asking? Can we see a recent rent roll and the last 12 months of T-12 income?
- Built in 1979 — when were the roof, HVAC, electrical panel, plumbing, and water heater last replaced?
- Is there a deadline driving the sale (1031 exchange, divorce, estate, relocation)? That informs how much negotiation room exists.
- The area grade is low — what's the realistic commute time and amenity access for the typical tenant pool here? Any planned neighborhood developments (good or bad) we should know about?
- What's the average days-on-market for RENTAL listings here right now (not sales)? A rising rental-DOM trend means longer vacancies and softer asking-rent achievability than the comps imply.
- What's the recent tenant-quality profile in this submarket — average credit score on applications, eviction rate, late-payment / NSF rate, and stable-employment percentage? A property-management company in the area should have these aggregated.
- How much new for-sale + rental construction is in the pipeline within 1–3 miles? Heavy new supply typically softens prices + rents 12–24 months out; constrained supply supports both.
Investment metrics
- 1% rule
- 0.87% ✗
- Cap rate
- 5.84%
- Cash-on-cash
- -1.62%
- DSCR
- 0.93
- GRM
- 9.6
CMA / ARV
No comps found within radius.
Projected returns pro-forma
-3.0% appreciation · 1.6% rent growth · sell at horizon
- IRR
- -20.6%
- Equity multiple
- 0.29×
- Total profit
- $-59,359
- Equity at exit
- $44,731
- IRR
- -17.4%
- Equity multiple
- 0.11×
- Total profit
- $-75,017
- Equity at exit
- $25,939
Cash invested: $84,000 (down + closing). Projections, not guarantees.
Landlord ↔ Tenant lean methodology
- Overall (STATE)
- 46 Balanced
- State Minnesota
- 46 Balanced · D+2
- County
- — inherits STATE
- City
- — inherits STATE
ZIP-level market 55102
- Rents YoY
- 1.6%
- Active inventory
- 145
- Price-to-rent
- 9.6×
Monthly cashflow live
- Estimated rent
- $2,601 medium interval (Pro) →
- Mortgage (P&I)
- −$1,573
- Tax from tax record
- −$470 /mo · $5,640/yr
- Insurance
- −$125
- HOA
- −$0
- Vacancy / Maint / Mgmt
- −$546
- Net cashflow
- $-114
Break-even live
UW: 25.0% down · 7.5% · 30yr · 1.5% tax · 5.0% vac · 8.0% maint · 8.0% mgmt
Financing live
Cash to close
- Down payment
- $75,000
- Closing costs
- $9,000
- Reserves months
- —
- Total cash needed
- —
Loan-product check · same deal, 3 products live
Conventional
25% down · 7.5% · 30yr
- Down + closing
- —
- Monthly P&I
- —
- Monthly cashflow
- —
- DSCR
- —
- Eligible?
- —
Personal DTI + credit; lowest rate.
DSCR
20% down · 8.5% · 30yr
- Down + closing
- —
- Monthly P&I
- —
- Monthly cashflow
- —
- DSCR
- —
- Eligible?
- —
No personal income docs; deal must DSCR.
Hard money
10% down · 12.0% · 12mo
- Down + closing
- —
- Monthly P&I
- —
- Monthly cashflow
- —
- DSCR
- —
- Eligible?
- —
Short-term bridge; refi at stabilization.
Listing history 42 events
-
2026-06-18days on market $300,000 Active 14 DOM
-
2026-06-17days on market $300,000 Active 13 DOM
-
2026-06-16days on market $300,000 Active 12 DOM
-
2026-06-15days on market $300,000 Active 11 DOM
-
2026-06-13days on market $300,000 Active 9 DOM
-
2026-06-09days on market $300,000 Active 5 DOM
-
2026-06-08days on market $300,000 Active 4 DOM
-
2026-06-07pricedays on market $300,000 Active 3 DOM
-
2026-06-04days on market $310,000 Active 48 DOM
-
2026-06-03days on market $310,000 Active 47 DOM
-
2026-06-02days on market $310,000 Active 46 DOM
-
2026-06-01days on market $310,000 Active 45 DOM
-
2026-05-31days on market $310,000 Active 44 DOM
-
2026-05-14price $315,000 762-char remark
-
2026-05-07price $325,000 762-char remark
-
2026-04-30price $335,000 762-char remark
-
2026-04-24price $340,000 762-char remark
-
2026-04-17$350,000 Active 762-char remark
-
2026-03-20status Active
-
2026-03-13$360,000 Active
-
2026-03-12historical
-
2026-03-02soldstatus $283,000
-
2022-02-11historical
-
2022-02-03price $2,060
-
2021-11-17price $289,900
-
2021-10-26price $294,900
-
2021-10-01$299,900 Active
-
2017-12-05soldstatus $244,450
-
2017-11-15soldstatus $244,450 Sold
-
2017-10-01status Pending
-
2017-09-15status Active
-
2017-09-14historical
-
2017-09-12historical Contingent - Inspection
-
2017-09-09$244,900 Active
-
2017-09-07soldstatus $160,000
-
2017-09-01soldstatus $137,500
-
1993-12-21soldstatus $84,000
-
1993-11-24soldstatus $84,000
-
1993-09-28historical
-
1993-06-01historical
-
1993-05-24$91,500
-
1993-05-24$91,500
ⓘ Source: listings_history table (triggers on properties + properties_extension) + one-shot
backfill from property_details.listing_events for pre-trigger history.
Tax reassessment forecast MN · Partial reset (capped growth)
- Current annual tax
- $5,640 · $470/mo
- Projected year-2 tax
- $5,640 · $470/mo
- Expected delta
- $0/yr ($0/mo · 0.0%)
ⓘ Screening estimate from a state-policy table — verify with the county assessor before closing.
Climate risk First Street
- Flood 6/10 Major FEMA zone X (unshaded) · 68% chance over 30 yrs
- Wildfire 1/10 Low
- Heat 2/10 Low 7 d/yr ≥100°F today · 14 d/yr by 30 yrs out
- Wind 2/10 Low
- Air quality 2/10 Low 1 unhealthy d/yr today · 1 by 30 yrs out
Nearby sold comps map
Loading sold comps map…
Walkable amenities ~0.75 mi
Loading nearby amenities…
Taxation est. · year 1
- Rental income
- $31,211
- − Mortgage interest
- −$16,805
- − Property taxes
- −$5,640
- − Insurance
- −$1,500
- − Repairs & maintenance
- −$2,497
- − Management
- −$2,497
- − Depreciation
- −$8,727
- Taxable loss
- −$6,455
- Est. tax savings @ 24.0%
- +$1,549
- After-tax cash flow
- $187/yr
For passive investors: Depreciation is non-cash, so a rental often shows a tax loss while cash-flowing — sheltering income. Rental losses are passive: they offset passive income freely, and up to $25,000/yr can offset ordinary (W-2) income if you actively participate and your MAGI is under $100k (phasing out to $0 by $150k); unused losses carry forward. On sale, claimed depreciation is recaptured at up to 25%, and gains may owe capital-gains tax (a 1031 exchange can defer both). Figures are a year-1 estimate at your 24.0% rate — not tax advice; consult a CPA.
Schools (NCES district)
- District
- St. Paul Public School District
- NCES district ID
- 2733840
- Math proficiency
- 21% ▼ -11.00%
- Reading proficiency
- 33% ▼ -7.00%
- Median HH income
- $48,316
- Composite
- 23.51/100
- National rank
- #7868
- State rank
- #270 of 301 in MN
Livability — St. Paul
No livability data for this city. (Only ~50 U.S. cities are tracked.)
Census & demographics
- Census place
- St. Paul, MN
- County
- Ramsey County · 542,837 people
- City population
- 280,599
- Metro
- Minneapolis-St. Paul-Bloomington, MN-WI
- Population (ZIP)
- 19,630
- Household income
- $76,406
- Rent vs Own
- Severe rent burden
- 1116.0
Population outlook (Ramsey County) Hauer SSP2
- Today (2025)
- 603,431 people
- By 2030
- 636,459 · +5.5%
- By 2040
- 700,596 · +16.1%
- By 2050
- 765,819 · +26.9%
- By 2075
- 929,297 · +54.0%
- By 2100
- 1,053,924 · +74.7%
Race, ethnicity, and origin ACS 2023
- Neighborhood character
- Predominantly White (77%)
- Race & ethnicity
- White 77% Black 10% Two or more races 6% Hispanic / Latino 5% Asian 3%
- Hispanic origin (detail)
- Mexican 4%
- Common ancestry
- Portuguese 10% Lithuanian 5% Romanian 3%
- Foreign-born
- 9% · Canada, South Korea
- Languages at home
- 87% English-only · Spanish 4% Other Indo-European 1% German/W. Germanic 1%
Political lean MEDSL · Ramsey
- 2024 margin
- Solid D (+43.3) · D 70.5% · R 27.2% · Other 2.3%
- 2008→2024 swing
- +9.4pp toward D · 2008: 33.9pp · 2024: 43.3pp
- All cycles
- 2024: D+43.3 2020: D+45.4 2016: D+39.4 2012: D+35.3 2008: D+33.9
Not yet ingested
- Civics
- —
Market trends
- HPI YoY
- ▼ -217.83%
- Current HPI
- 241.7112
- Rent YoY
- ▲ 1.60%
- Metro
- Minneapolis-St. Paul-Bloomington, MN-WI
- State GDP YoY
- ▲ 2.41%
- F500 in state
- 34
Industry mix (Fortune 500 HQ in MN)
| Industry | F500 HQs | Revenue |
|---|---|---|
| Healthcare | 2 | $407B |
|
||
| Retail | 2 | $150B |
|
||
| Consumer Goods | 2 | $32B |
|
||
| Industrial Machinery | 2 | $6B |
|
||
| Agriculture | 1 | $40B |
|
||
| Healthcare / Medical Devices | 1 | $32B |
|
||
Price history
+227.9% since first listed32 events — show timeline
- 2026-06-04 Listed $300,000 NORTHSTARMLS as Distributed by MLS Grid
- 2026-06-04 Listing Removed — NORTHSTARMLS as Distributed by MLS Grid
- 2026-05-26 Price Changed $310,000 NORTHSTARMLS as Distributed by MLS Grid
- 2026-05-14 Price Changed $315,000 NORTHSTARMLS as Distributed by MLS Grid
- 2026-05-07 Price Changed $325,000 NORTHSTARMLS as Distributed by MLS Grid
- 2026-04-30 Price Changed $335,000 NORTHSTARMLS as Distributed by MLS Grid
- 2026-04-24 Price Changed $340,000 NORTHSTARMLS as Distributed by MLS Grid
- 2026-04-17 Listed $350,000 NORTHSTARMLS as Distributed by MLS Grid
- 2026-03-20 Relisted — NORTHSTARMLS as Distributed by MLS Grid
- 2026-03-13 Listed $360,000 NORTHSTARMLS as Distributed by MLS Grid
- 2026-03-12 Coming Soon — NORTHSTARMLS as Distributed by MLS Grid
- 2026-03-02 Sold (Public Records) $283,000 Public Records
- 2022-02-11 Listing Removed — NORTHSTARMLS as Distributed by MLS Grid
- 2022-02-03 Price Changed $2,060 RENT.
- 2021-11-17 Price Changed $289,900 NORTHSTARMLS as Distributed by MLS Grid
- 2021-10-26 Price Changed $294,900 NORTHSTARMLS as Distributed by MLS Grid
- 2021-10-01 Listed $299,900 NORTHSTARMLS as Distributed by MLS Grid
- 2017-12-05 Sold (Public Records) $244,450 Public Records
- 2017-11-15 Sold (MLS) $244,450 NORTHSTARMLS as Distributed by MLS Grid
- 2017-10-01 Pending — NORTHSTARMLS as Distributed by MLS Grid
- 2017-09-15 Relisted — NORTHSTARMLS as Distributed by MLS Grid
- 2017-09-14 Listing Removed — NORTHSTARMLS as Distributed by MLS Grid
- 2017-09-12 Contingent — NORTHSTARMLS as Distributed by MLS Grid
- 2017-09-09 Listed $244,900 NORTHSTARMLS as Distributed by MLS Grid
- 2017-09-07 Sold (Public Records) $160,000 Public Records
- 2017-09-01 Sold (Public Records) $137,500 Public Records
- 1993-12-21 Sold (Public Records) $84,000 Public Records
- 1993-11-24 Sold (MLS) $84,000 NORTHSTARMLS as Distributed by MLS Grid
- 1993-09-28 Listing Removed — NORTHSTARMLS as Distributed by MLS Grid
- 1993-06-01 Listing Removed — NORTHSTARMLS as Distributed by MLS Grid
- 1993-05-24 Listed $91,500 NORTHSTARMLS as Distributed by MLS Grid
- 1993-05-24 Listed $91,500 NORTHSTARMLS as Distributed by MLS Grid
Property tax history
+6.3%/yrLatest (2025): $5,640 · +15.1% YoY. Source: county tax records.
Cash-flow waterfall
monthlySold comps — $/sqft
last 12 mo · ≤1 miLoading sold comps…