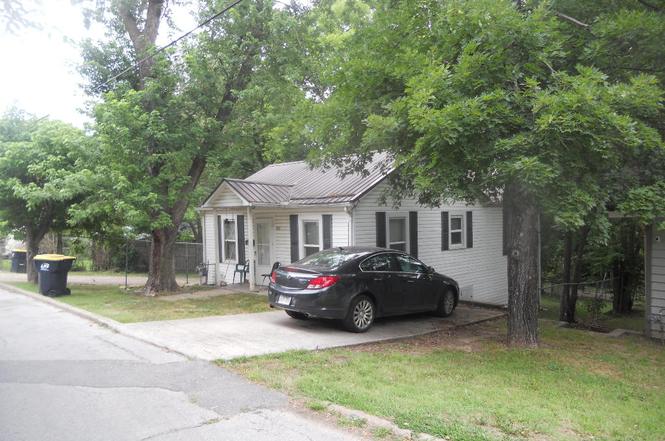
217 Rogers Ave · Harrison, AR
Flood risk 1/10 · Minimal
- FEMA flood zone
- X (unshaded)
- Chance of flooding over 30 yrs
- 0.0%
- Est. flood insurance / yr
- $507 – $1,088
Fire risk 3/10 · Minor
- Est. fire insurance / yr
- $1,499 – $2,785
Heat risk 4/10 · Minor
- Hot days now (above 104°F)
- 7 days/yr
- Hot days in 30 yrs
- 20 days/yr
Wind risk 2/10 · Minimal
- Chance of severe wind over 30 yrs
- 1.0%
Air-quality risk 1/10 · Minimal
- Unhealthy air days now
- 0 days/yr
- Unhealthy air days in 30 yrs
- 0 days/yr
Risk factors via First Street. Map © Google.
Why this score? — see what drove the C- grade
The composite is a weighted blend of 9 inputs, each scored 0–100. Each bar is that input's sub-score; the figure is the points it added to the 100-point composite (weight × sub-score).
- ARV discount +15.0/15.0
- Cash flow +12.6/30.0
- Schools +4.5/10.0
- Appreciation +4.0/10.0
- DSCR +3.8/10.0
- Livability +3.5/5.0
- Rent growth +2.5/5.0
- Condition / age +2.5/5.0
- 1% rule +2.4/10.0
$99,500
🖨 Deal sheet (PDF) 📄 Offer letter ✓ Due diligence
Listing remarks MLS
2BR 1BA home within walking distance of downtown Harrison. Central heat and air, metal roof, insulated windows, fenced back yard, large shade trees. Currently used as a rental, would make a great investment property or a very economical home to live in.
Key facts
- Central heating
- Metal roof
- Off street parking
Tags
Neighborhood map
What this means for you Summary
Snapshot
- This is a 2-bed/1.0-bath single-family listed at $100k.
Deal economics
- At list price, monthly cash flow is $-12 ($-142/yr) — negative.
- To cash-flow at today's rent, offer at most $97k (2.1% below list).
- To meet the 1% rule (rent ≥ 1% of price), the offer needs to be $74k (25.9% below list).
- Recommended offer: $74k (25.9% below list) — sets the bar for 1% rule.
- Cap rate 6.2% vs local median 3.0% in Harrison — top-decile yield for the area; either an underpriced asset or a hidden risk that comps aren't pricing in. Stress-test before assuming the spread holds.
Location & tenants
- Location reads 70/100 on livability (#52 in AR) — a middle-class / working-renter tenant base. Strengths: cost of living A+, housing A+, health & safety A+; Watch: amenities F, commute F, employment F.
- Harrison School District (town): math 53% / reading 54% proficiency, ranked #11 of 238 in AR (top 5%) — acceptable for families but not a draw, mixed tenant base, ~2y average lease.
- Zoned schools: Harrison Middle School (math 57% / reading 58%, grade B, #16 of 201 statewide, top 8%, 830 students, 49% FRL); Harrison High School (math 39% / reading 51%, grade D-, #27 of 292 statewide, top 10%, 868 students, 42% FRL) — zoned schools at 45% FRL track the district average.
- Market conditions: 443 active listings in the ZIP; 2 comparable units currently listed for rent nearby; 92 units permitted in Boone County in 2024 (72 in 5+ unit buildings).
Forward outlook
- Local home prices are declining (-1.9%/yr); year-one equity from $688 of loan paydown is wiped out by about $2k of value loss. Plan a longer hold.
- Boone County population projected to shrink 8% by 2050 — rents likely to lag national; underwrite the cash flow, not the appreciation.
Negotiation context
- It's been on market 47 days — a 3% lower offer ($97k) is reasonable based on typical stale-listing flexibility.
- 3 sale attempts since 2y ago with the ask held roughly flat each time — persistent listings suggest the price (not the market) is what's stuck; bring a comps-based counter.
Questions for the listing agent
- What do current leases actually rent for vs. the listed asking? Can we see a recent rent roll and the last 12 months of T-12 income?
- It's been on market 47 days. Have you received any prior offers? Is the seller open to a 26% concession, seller financing, or rate buy-down credit?
- Built in 1970 — when were the roof, HVAC, electrical panel, plumbing, and water heater last replaced?
- Is there a deadline driving the sale (1031 exchange, divorce, estate, relocation)? That informs how much negotiation room exists.
- What's the average days-on-market for RENTAL listings here right now (not sales)? A rising rental-DOM trend means longer vacancies and softer asking-rent achievability than the comps imply.
- What's the recent tenant-quality profile in this submarket — average credit score on applications, eviction rate, late-payment / NSF rate, and stable-employment percentage? A property-management company in the area should have these aggregated.
- How much new for-sale + rental construction is in the pipeline within 1–3 miles? Heavy new supply typically softens prices + rents 12–24 months out; constrained supply supports both.
Investment metrics
- 1% rule
- 0.74% ✗
- Cap rate
- 6.15%
- Cash-on-cash
- -0.51%
- DSCR
- 0.98
- GRM
- 11.2
CMA / ARV
- ARV (on-the-fly)
- $120,768
- Comps found
- 12
Show comp detail 12 sales within ~0.75 mi
| Address | Dist | Beds/Ba | Sqft | Sold | Price | $/sf | Match |
|---|---|---|---|---|---|---|---|
| 704 S Ash St | 0.30mi | 2/1.0 | 824 (+1%) | 0mo | $72,655 | $88 | 84 |
| 715 Sycamore St | 0.12mi | 2/1.0 | 854 (+5%) | 5mo | $141,500 | $166 | 83 |
| 703 Ash St | 0.32mi | 2/1.0 | 808 (-1%) | 2mo | $124,000 | $153 | 82 |
| 418 N Robinson St | 0.72mi | 2/1.0 | 816 (0%) | 7mo | $100,000 | $123 | 60 |
| 909 S Ash St | 0.46mi | 2/1.0 | 798 (-2%) | 19mo | $122,000 | $153 | 59 |
| 416 Walnut St | 0.12mi | 3/1.0 (+1) | 912 (+12%) | 14mo | $72,500 | $79 | 58 |
| 501 E Milam Ave | 0.32mi | 1/1.0 (-1) | 764 (-6%) | 14mo | $45,000 | $59 | 58 |
| 217 S Spruce St | 0.66mi | 2/1.0 | 840 (+3%) | 12mo | $137,000 | $163 | 54 |
| 723 W Stephenson Ave | 0.73mi | 3/1.0 (+1) | 816 (0%) | 14mo | $112,000 | $137 | 49 |
| 514 Gordon Ave | 0.31mi | 2/1.0 | 924 (+13%) | 19mo | $120,000 | $130 | 48 |
| 712 Sunset Ln | 0.71mi | 2/1.0 | 924 (+13%) | 7mo | $137,000 | $148 | 39 |
| 308 Glines Ct | 0.68mi | 3/2.0 (+1) | 924 (+13%) | 18mo | $156,000 | $169 | 22 |
Match score weights: distance 35% · size 25% · config 20% · recency 20%. Top-matched comps best support the ARV.
Projected returns pro-forma
-1.92% appreciation · 3.0% rent growth · sell at horizon
- IRR
- -11.1%
- Equity multiple
- 0.56×
- Total profit
- $-12,366
- Equity at exit
- $19,684
- IRR
- -3.5%
- Equity multiple
- 0.72×
- Total profit
- $-7,846
- Equity at exit
- $17,166
Cash invested: $27,860 (down + closing). Projections, not guarantees.
Landlord ↔ Tenant lean methodology
- Overall (STATE)
- 92 Strongly Landlord-Friendly
- State Arkansas
- 92 Strongly Landlord-Friendly · R+14
- County
- — inherits STATE
- City
- — inherits STATE
ZIP-level market 72601
- Home prices YoY
- -0.8%
- Active inventory
- 443
- Price-to-rent
- 11.2×
Monthly cashflow live
- Estimated rent
- $737 medium interval (Pro) →
- Mortgage (P&I)
- −$522
- Tax from tax record
- −$31 /mo · $373/yr
- Insurance
- −$41
- HOA
- −$0
- Vacancy / Maint / Mgmt
- −$155
- Net cashflow
- $-12
Break-even live
Sensitivity live
| Price | -10% $44 | -5% $16 | +0% $-12 | +5% $-40 | +10% $-68 |
|---|---|---|---|---|---|
| Rent | -10% $-70 | -5% $-41 | +0% $-12 | +5% $17 | +10% $46 |
| Rate | -1.0pp $38 | -0.5pp $13 | base $-12 | +0.5pp $-38 | +1.0pp $-64 |
UW: 25.0% down · 7.5% · 30yr · 1.5% tax · 5.0% vac · 8.0% maint · 8.0% mgmt
Financing live
Cash to close
- Down payment
- $24,875
- Closing costs
- $2,985
- Reserves months
- —
- Total cash needed
- —
Loan-product check · same deal, 3 products live
Conventional
25% down · 7.5% · 30yr
- Down + closing
- —
- Monthly P&I
- —
- Monthly cashflow
- —
- DSCR
- —
- Eligible?
- —
Personal DTI + credit; lowest rate.
DSCR
20% down · 8.5% · 30yr
- Down + closing
- —
- Monthly P&I
- —
- Monthly cashflow
- —
- DSCR
- —
- Eligible?
- —
No personal income docs; deal must DSCR.
Hard money
10% down · 12.0% · 12mo
- Down + closing
- —
- Monthly P&I
- —
- Monthly cashflow
- —
- DSCR
- —
- Eligible?
- —
Short-term bridge; refi at stabilization.
Rent comps 2 comps
| Address | Beds | Baths | Sqft | Rent | $/sqft | DOM | Units | Dist |
|---|---|---|---|---|---|---|---|---|
| 1101 N Cherry St Unit A Harrison, AR | 2.0 | 1.0 | 1000 | $750 | $0.75 | 45d | 1 | 1.13mi |
| 851 State Highway 123 Harrison, AR | 1.0–2.0 | 1.0–2.0 | 721 | $725 | $1.00 | 45d | 21 | 1.19mi |
Listing history 9 events
-
2026-04-20status Pending
-
2026-03-24status Active
-
2026-03-09historical
-
2026-02-04status Pending
-
2026-01-14$99,500 Active
-
2024-09-04soldstatus $170,000
-
2024-08-30soldstatus $85,000 Closed 253-char remark
Show marketing remark (253 chars)
2BR 1BA home within walking distance of downtown Harrison. Central heat and air, metal roof, insulated windows, fenced back yard, large shade trees. Currently used as a rental, would make a great investment property or a very economical home to live in.
-
2024-07-23historical 253-char remark
Show marketing remark (253 chars)
2BR 1BA home within walking distance of downtown Harrison. Central heat and air, metal roof, insulated windows, fenced back yard, large shade trees. Currently used as a rental, would make a great investment property or a very economical home to live in.
-
2024-06-19$95,000 253-char remark
Show marketing remark (253 chars)
2BR 1BA home within walking distance of downtown Harrison. Central heat and air, metal roof, insulated windows, fenced back yard, large shade trees. Currently used as a rental, would make a great investment property or a very economical home to live in.
ⓘ Source: listings_history table (triggers on properties + properties_extension) + one-shot
backfill from property_details.listing_events for pre-trigger history.
Tax reassessment forecast AR · Resets to sale price
- Current annual tax
- $373 · $31/mo
- Projected year-2 tax
- $637 · $53/mo
- Expected delta
- +$263/yr (+$22/mo · 70.6%)
ⓘ Screening estimate from a state-policy table — verify with the county assessor before closing.
Climate risk First Street
- Flood 1/10 Low FEMA zone X (unshaded) · 0% chance over 30 yrs
- Wildfire 3/10 Moderate
- Heat 4/10 Moderate 7 d/yr ≥104°F today · 20 d/yr by 30 yrs out
- Wind 2/10 Low 100% chance of damaging wind over 30 yrs
- Air quality 1/10 Low 0 unhealthy d/yr today · 0 by 30 yrs out
Nearby sold comps map
Loading sold comps map…
Walkable amenities ~0.75 mi
Loading nearby amenities…
Taxation est. · year 1
- Rental income
- $8,848
- − Mortgage interest
- −$5,574
- − Property taxes
- −$373
- − Insurance
- −$498
- − Repairs & maintenance
- −$708
- − Management
- −$708
- − Depreciation
- −$2,895
- Taxable loss
- −$1,906
- Est. tax savings @ 24.0%
- +$457
- After-tax cash flow
- $315/yr
For passive investors: Depreciation is non-cash, so a rental often shows a tax loss while cash-flowing — sheltering income. Rental losses are passive: they offset passive income freely, and up to $25,000/yr can offset ordinary (W-2) income if you actively participate and your MAGI is under $100k (phasing out to $0 by $150k); unused losses carry forward. On sale, claimed depreciation is recaptured at up to 25%, and gains may owe capital-gains tax (a 1031 exchange can defer both). Figures are a year-1 estimate at your 24.0% rate — not tax advice; consult a CPA.
Schools (NCES district)
- District
- Harrison School District
- NCES district ID
- 0507380
- Math proficiency
- 53% ▼ -9.00%
- Reading proficiency
- 54% ▼ -6.00%
- Median HH income
- $37,726
- Composite
- 44.51/100
- National rank
- #2796
- State rank
- #11 of 238 in AR
Livability — Harrison
- Score
- 70/100
- State rank
- #52
- US rank
- #7654
Category grades
Schools grade is shown separately in the Schools card above.
Census & demographics
- Census place
- Harrison, AR
- Population (ZIP)
- 30,180
Population outlook (Boone County) Hauer SSP2
- Today (2025)
- 37,238 people
- By 2030
- 36,808 · -1.2%
- By 2040
- 35,597 · -4.4%
- By 2050
- 34,197 · -8.2%
- By 2075
- 30,503 · -18.1%
- By 2100
- 25,797 · -30.7%
Race, ethnicity, and origin ACS 2023
- Neighborhood character
- Predominantly White (93%)
- Race & ethnicity
- White 93% Two or more races 4% Hispanic / Latino 3%
- Common ancestry
- Lithuanian 3% Slovak 2% Serbian 2%
- Foreign-born
- 1% · Canada
- Languages at home
- 97% English-only · Spanish 2%
Political lean MEDSL · Boone
- 2024 margin
- Solid R (+65.0) · D 16.7% · R 81.6% · Other 1.7%
- 2008→2024 swing
- -25.3pp toward R · 2008: -39.7pp · 2024: -65.0pp
- All cycles
- 2024: R+65.0 2020: R+61.9 2016: R+58.5 2012: R+48.0 2008: R+39.7
Not yet ingested
- Civics
- —
Market trends
- HPI YoY
- ▼ -1.92%
- Current HPI
- 247.043
- Rent YoY
- —
- Metro
- —
- State GDP YoY
- ▲ 3.80%
- F500 in state
- 10
Industry mix (Fortune 500 HQ in AR)
| Industry | F500 HQs | Revenue |
|---|---|---|
| Retail | 1 | $681B |
|
||
| Food / Agriculture | 1 | $53B |
|
||
| Retail / Energy | 1 | $22B |
|
||
| Transportation / Logistics | 1 | $12B |
|
||
| Energy | 1 | $4B |
|
||
Price history
+4.7% since first listed9 events — show timeline
- 2026-04-20 Pending — NWARMLS
- 2026-03-24 Relisted — NWARMLS
- 2026-03-09 Delisted — NWARMLS
- 2026-02-04 Pending — NWARMLS
- 2026-01-14 Listed $99,500 NWARMLS
- 2024-09-04 Sold (Public Records) $170,000 Public Records
- 2024-08-30 Sold (MLS) $85,000 NWARMLS
- 2024-07-23 Delisted — NWARMLS
- 2024-06-19 Listed $95,000 NWARMLS
Property tax history
+1.8%/yrLatest (2025): $373 · +0.0% YoY. Source: county tax records.
Cash-flow waterfall
monthlySold comps — $/sqft
last 12 mo · ≤1 miLoading sold comps…