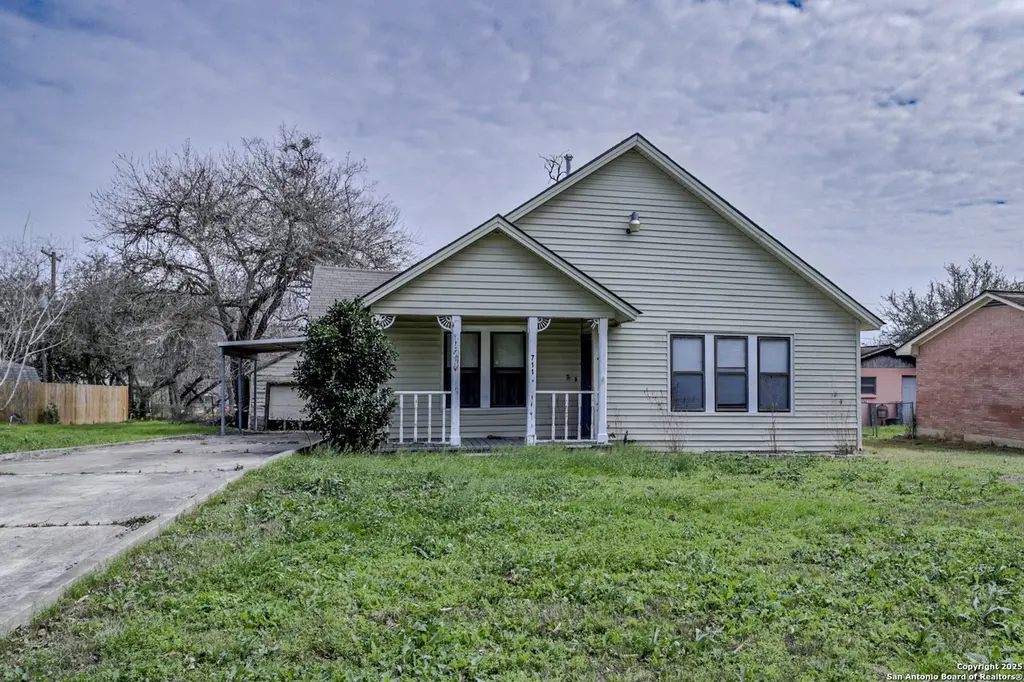
711 S 7th St · Kenedy, TX
Flood risk 1/10 · Minimal
- FEMA flood zone
- X (unshaded)
- Chance of flooding over 30 yrs
- 0.0%
- Est. flood insurance / yr
- $507 – $1,088
Fire risk 4/10 · Minor
- Est. fire insurance / yr
- $1,222 – $2,270
Heat risk 8/10 · Major
- Hot days now (above 110°F)
- 7 days/yr
- Hot days in 30 yrs
- 21 days/yr
Wind risk 8/10 · Major
- Chance of severe wind over 30 yrs
- 99.0%
Air-quality risk 1/10 · Minimal
- Unhealthy air days now
- 0 days/yr
- Unhealthy air days in 30 yrs
- 0 days/yr
Risk factors via First Street. Map © Google.
Why this score? — see what drove the C+ grade
The composite is a weighted blend of 9 inputs, each scored 0–100. Each bar is that input's sub-score; the figure is the points it added to the 100-point composite (weight × sub-score).
- Cash flow +19.9/30.0
- ARV discount +15.0/15.0
- DSCR +6.3/10.0
- Appreciation +5.0/10.0
- 1% rule +4.7/10.0
- Livability +3.2/5.0
- Rent growth +2.5/5.0
- Condition / age +2.5/5.0
- Schools +2.2/10.0
$135,000
🖨 Deal sheet 📄 Offer letter ✓ Due diligence
Listing remarks MLS
A charming, vintage home with lovely curb appeal and a welcoming presence. This home is ready for new owners to give it some TLC and make it their own!
Key facts
- 0.34 acre lot
- Garage
- Built 1938
Neighborhood map
What this means for you Summary
Snapshot
- This is a 3-bed/1.0-bath single-family listed at $135k.
Deal economics
- At list price, monthly cash flow is $163 ($2k/yr) — positive.
- The deal already cash-flows at list — no discount required.
- To meet the 1% rule (rent ≥ 1% of price), the offer needs to be $131k (2.6% below list).
- Recommended offer: $119k (12.0% below list) — sets the bar for market timing.
- Cap rate 7.7% vs local median 5.1% in Kenedy — top-decile yield for the area; either an underpriced asset or a hidden risk that comps aren't pricing in. Stress-test before assuming the spread holds.
Location & tenants
- Location reads 63/100 on livability (#822 in TX) — a middle-class / working-renter tenant base. Strengths: cost of living A+, housing A+; Watch: crime C-, health & safety C-, schools F.
- Kenedy ISD (rural): math 25% / reading 28% proficiency, ranked #698 of 826 in TX (top 84%) — low school quality limits family demand, transient renter base, plan for 1-2y turnover; 71% free/reduced lunch — lower-income household profile, screen leases tightly.
- Market conditions: 1 active listings in the ZIP; 78 units permitted in Karnes County in 2024 (0 in 5+ unit buildings).
Forward outlook
- In year one you build about $5k of equity ($933 loan paydown + $4k appreciation (3.0% local appreciation)).
- Karnes County population projected at +42% by 2050 — long-run rental-demand tailwind backs the buy-and-hold thesis.
- At projected returns (3.0% appreciation + 3.0% rent growth), your $38k cash investment doubles in ~5 years — after that, you're playing with house money.
- By year 7, paydown + projected appreciation supports a ~$32k cash-out refi (75% LTV) — recoverable capital for the next deal without selling this one.
Negotiation context
- It's been on market 461 days — a 12% lower offer ($119k) is reasonable based on typical stale-listing flexibility.
Risks & watch-outs
- Watch-outs: built in 1938 — expect roof / HVAC / electrical / plumbing capex.
- Climate carrying-cost: severe wind risk, 99% chance of damaging wind over 30y; extreme-heat days projected 7→21/yr by 2055 (HVAC capex compounding) — expect insurance premiums to compound above CPI over the hold.
Questions for the listing agent
- It's been on market 461 days. Have you received any prior offers? Is the seller open to a 12% concession, seller financing, or rate buy-down credit?
- Built in 1938 — when were the roof, HVAC, electrical panel, plumbing, and water heater last replaced?
- Why hasn't it sold? Are there any deal-killer items the seller is aware of (foundation, flood, title, zoning, code violations)?
- Is there a deadline driving the sale (1031 exchange, divorce, estate, relocation)? That informs how much negotiation room exists.
- Schools are F-rated, which usually means shorter tenancies and higher turnover. Who's the typical renter profile here, and what's been the actual vacancy rate?
- What's the average days-on-market for RENTAL listings here right now (not sales)? A rising rental-DOM trend means longer vacancies and softer asking-rent achievability than the comps imply.
- What's the recent tenant-quality profile in this submarket — average credit score on applications, eviction rate, late-payment / NSF rate, and stable-employment percentage? A property-management company in the area should have these aggregated.
- How much new for-sale + rental construction is in the pipeline within 1–3 miles? Heavy new supply typically softens prices + rents 12–24 months out; constrained supply supports both.
Investment metrics
- 1% rule
- 0.97% ✗
- Cap rate
- 7.74%
- Cash-on-cash
- 5.18%
- DSCR
- 1.23
- GRM
- 8.6
CMA / ARV
- ARV (median comp)
- $190,554
- List price
- $135,000
- Delta
- -29.15%
- Verdict
- UNDERPRICED
- Comps
- 20 within 1.0 mi
Show comp detail 6 sales within ~0.75 mi
| Address | Dist | Beds/Ba | Sqft | Sold | Price | $/sf | Match |
|---|---|---|---|---|---|---|---|
| 1004 S 7th | 0.19mi | 3/2.0 | 1,888 (-3%) | 4mo | $85,000 | $45 | 79 |
| 803 Carol St | 0.14mi | 3/2.0 | 2,029 (+4%) | 7mo | $103,000 | $51 | 77 |
| 703 S 9th | 0.15mi | 3/2.0 | 1,900 (-3%) | 14mo | $335,000 | $176 | 73 |
| 808 S 8th St | 0.12mi | 3/2.5 | 2,169 (+11%) | 16mo | $360,000 | $166 | 56 |
| 205 4th/tilden | 0.42mi | 3/3.0 | 1,904 (-2%) | 16mo | $285,000 | $150 | 55 |
| 1320 Ruhmann St | 0.66mi | 4/2.0 (+1) | 2,016 (+3%) | 4mo | $130,000 | $64 | 52 |
Match score weights: distance 35% · size 25% · config 20% · recency 20%. Top-matched comps best support the ARV.
Projected returns pro-forma
3.0% appreciation · 3.0% rent growth · sell at horizon
- IRR
- 12.3%
- Equity multiple
- 1.70×
- Total profit
- $26,634
- Equity at exit
- $60,702
- IRR
- 14.4%
- Equity multiple
- 3.12×
- Total profit
- $80,258
- Equity at exit
- $93,549
Cash invested: $37,800 (down + closing). Projections, not guarantees.
Landlord ↔ Tenant lean methodology
- Overall (STATE)
- 87 Strongly Landlord-Friendly
- State Texas
- 87 Strongly Landlord-Friendly · R+5
- County
- — inherits STATE
- City
- — inherits STATE
ZIP-level market 78119-3049
- Active inventory
- 1
- Price-to-rent
- 8.6×
Monthly cashflow live
- Estimated rent
- $1,315 medium interval (Pro) →
- Mortgage (P&I)
- −$708
- Tax from tax record
- −$111 /mo · $1,336/yr
- Insurance
- −$56
- HOA
- −$0
- Vacancy / Maint / Mgmt
- −$276
- Net cashflow
- $163
Break-even live
UW: 25.0% down · 7.5% · 30yr · 1.5% tax · 5.0% vac · 8.0% maint · 8.0% mgmt
Financing live
Cash to close
- Down payment
- $33,750
- Closing costs
- $4,050
- Reserves months
- —
- Total cash needed
- —
Loan-product check · same deal, 3 products live
Conventional
25% down · 7.5% · 30yr
- Down + closing
- —
- Monthly P&I
- —
- Monthly cashflow
- —
- DSCR
- —
- Eligible?
- —
Personal DTI + credit; lowest rate.
DSCR
20% down · 8.5% · 30yr
- Down + closing
- —
- Monthly P&I
- —
- Monthly cashflow
- —
- DSCR
- —
- Eligible?
- —
No personal income docs; deal must DSCR.
Hard money
10% down · 12.0% · 12mo
- Down + closing
- —
- Monthly P&I
- —
- Monthly cashflow
- —
- DSCR
- —
- Eligible?
- —
Short-term bridge; refi at stabilization.
Listing history 16 events
-
2026-06-18days on market $135,000 Active 461 DOM
-
2026-06-17days on market $135,000 Active 460 DOM
-
2026-06-16days on market $135,000 Active 459 DOM
-
2026-06-15days on market $135,000 Active 458 DOM
-
2026-06-13days on market $135,000 Active 456 DOM
-
2026-06-12days on market $135,000 Active 455 DOM
-
2026-06-10days on market $135,000 Active 452 DOM
-
2026-06-08days on market $135,000 Active 451 DOM
-
2026-06-08days on market $135,000 Active 450 DOM
-
2026-06-07days on market $135,000 Active 449 DOM
-
2026-06-03days on market $135,000 Active 446 DOM
-
2026-06-02days on market $135,000 Active 445 DOM
-
2026-06-01days on market $135,000 Active 444 DOM
-
2026-05-31days on market $135,000 Active 443 DOM
-
2025-05-08price $135,000 151-char remark
Show marketing remark (151 chars)
A charming, vintage home with lovely curb appeal and a welcoming presence. This home is ready for new owners to give it some TLC and make it their own!
-
2025-03-14$149,000 New 151-char remark
Show marketing remark (151 chars)
A charming, vintage home with lovely curb appeal and a welcoming presence. This home is ready for new owners to give it some TLC and make it their own!
ⓘ Source: listings_history table (triggers on properties + properties_extension) + one-shot
backfill from property_details.listing_events for pre-trigger history.
Tax reassessment forecast TX · Resets to sale price
- Current annual tax
- $1,336 · $111/mo
- Projected year-2 tax
- $2,470 · $206/mo
- Expected delta
- +$1,134/yr (+$95/mo · 84.9%)
ⓘ Screening estimate from a state-policy table — verify with the county assessor before closing.
Climate risk First Street
- Flood 1/10 Low FEMA zone X (unshaded) · 0% chance over 30 yrs
- Wildfire 4/10 Moderate
- Heat 8/10 Severe 7 d/yr ≥110°F today · 21 d/yr by 30 yrs out
- Wind 8/10 Severe 99% chance of damaging wind over 30 yrs
- Air quality 1/10 Low 0 unhealthy d/yr today · 0 by 30 yrs out
Nearby sold comps map
Loading sold comps map…
Walkable amenities ~0.75 mi
Loading nearby amenities…
Taxation est. · year 1
- Rental income
- $15,777
- − Mortgage interest
- −$7,562
- − Property taxes
- −$1,336
- − Insurance
- −$675
- − Repairs & maintenance
- −$1,262
- − Management
- −$1,262
- − Depreciation
- −$3,927
- Taxable loss
- −$248
- Est. tax savings @ 24.0%
- +$60
- After-tax cash flow
- $2,017/yr
For passive investors: Depreciation is non-cash, so a rental often shows a tax loss while cash-flowing — sheltering income. Rental losses are passive: they offset passive income freely, and up to $25,000/yr can offset ordinary (W-2) income if you actively participate and your MAGI is under $100k (phasing out to $0 by $150k); unused losses carry forward. On sale, claimed depreciation is recaptured at up to 25%, and gains may owe capital-gains tax (a 1031 exchange can defer both). Figures are a year-1 estimate at your 24.0% rate — not tax advice; consult a CPA.
Schools (NCES district)
- District
- Kenedy ISD
- NCES district ID
- 4825440
- Math proficiency
- 25% ▼ -16.00%
- Reading proficiency
- 28% ▼ -6.00%
- Median HH income
- $40,961
- Composite
- 22.43/100
- National rank
- #8111
- State rank
- #698 of 826 in TX
Livability — Kenedy
- Score
- 63/100
- State rank
- #822
- US rank
- #14883
Category grades
Schools grade is shown separately in the Schools card above.
Census & demographics
- Census place
- Kenedy, TX
Population outlook (Karnes County) Hauer SSP2
- Today (2025)
- 16,734 people
- By 2030
- 18,027 · +7.7%
- By 2040
- 20,893 · +24.9%
- By 2050
- 23,689 · +41.6%
- By 2075
- 31,064 · +85.6%
- By 2100
- 34,752 · +107.7%
Not yet ingested
- Political lean
- —
- Race & ethnicity
- —
- Common origin
- —
- Civics
- —
Market trends
- HPI YoY
- —
- Current HPI
- —
- Rent YoY
- —
- Metro
- —
- State GDP YoY
- ▲ 3.95%
- F500 in state
- 110
Industry mix (Fortune 500 HQ in TX)
| Industry | F500 HQs | Revenue |
|---|---|---|
| Energy | 16 | $1,198B |
|
||
| Technology | 5 | $198B |
|
||
| Engineering / Construction | 4 | $72B |
|
||
| Energy Services | 3 | $60B |
|
||
| Utilities | 3 | $41B |
|
||
| Healthcare | 2 | $330B |
|
||
Price history
-9.4% since first listed2 events — show timeline
- 2025-05-08 Price Changed $135,000 LERA
- 2025-03-14 Listed $149,000 LERA
Property tax history
+0.9%/yrLatest (2025): $1,336 · -13.4% YoY. Source: county tax records.
Cash-flow waterfall
monthlySold comps — $/sqft
last 12 mo · ≤1 miLoading sold comps…