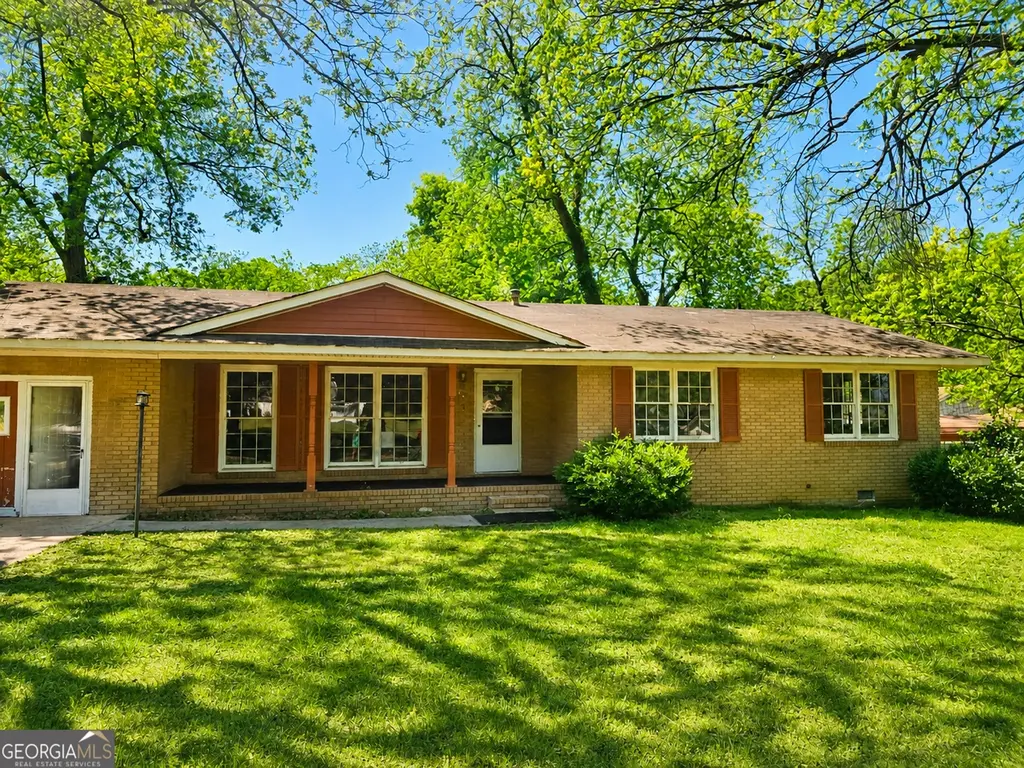
649 Daniel St · Royston, GA
Flood risk 1/10 · Minimal
- FEMA flood zone
- X (unshaded)
- Chance of flooding over 30 yrs
- 0.0%
- Est. flood insurance / yr
- $507 – $1,088
Fire risk 4/10 · Minor
- Est. fire insurance / yr
- $963 – $1,789
Heat risk 5/10 · Moderate
- Hot days now (above 105°F)
- 7 days/yr
- Hot days in 30 yrs
- 16 days/yr
Wind risk 4/10 · Minor
- Chance of severe wind over 30 yrs
- 11.0%
Air-quality risk 3/10 · Minor
- Unhealthy air days now
- 2 days/yr
- Unhealthy air days in 30 yrs
- 4 days/yr
Risk factors via First Street. Map © Google.
Why this score? — see what drove the B+ grade
The composite is a weighted blend of 9 inputs, each scored 0–100. Each bar is that input's sub-score; the figure is the points it added to the 100-point composite (weight × sub-score).
- Cash flow +26.3/30.0
- ARV discount +15.0/15.0
- Appreciation +10.0/10.0
- DSCR +8.9/10.0
- 1% rule +6.0/10.0
- Schools +3.0/10.0
- Livability +2.9/5.0
- Rent growth +2.5/5.0
- Condition / age +2.5/5.0
$180,000
🖨 Deal sheet 📄 Offer letter ✓ Due diligence
Listing remarks
Opportunity in Royston! This 4-bedroom, 2-bath home offers great potential for those looking to renovate and add value. Situated on a level lot, this four-sided brick property provides a solid foundation and lasting durability. The home is in need of cosmetic updates, making it an ideal option for investors or buyers ready to bring their vision to life. Whether you're looking for your next project or a place to make your own, the possibilities here are strong.
Key facts
- Built 1971
- Listed 22 days
Property features AI
Finance
- Other: Located at 649 Daniel Street, Royston, GA 30662
- HOA & community: No HOA
Exterior
- Parking: Open parking; Parking pad
- Utilities: Public water; Public sewer; Electricity available; Sewer connected
- Home design: Single family residence (house); Resale property; Built in 1971
- Construction: Brick construction; Composition roof; Built in 1971
- Exterior features: Composition roof; Brick construction; City lot
Interior
- Kitchen: No appliances listed
- Bedrooms: 4 bedrooms on the main level
- Flooring: Hardwood flooring
- Bathrooms: 2 full bathrooms on the main level
- Heating & cooling: Central heating; No cooling listed
- Interior features: One-level layout; Other interior features
- Laundry & utility: No laundry features listed
Neighborhood map
What this means for you Summary
Snapshot
- This is a 3-bed/2.0-bath single-family listed at $180k.
Deal economics
- At list price, monthly cash flow is $463 ($6k/yr) — positive.
- The deal already cash-flows at list — no discount required.
- Meets the 1% rule at list price ($2k rent vs $180k).
- Recommended offer: $177k (1.5% below list) — sets the bar for market timing.
- Cap rate 9.4% vs local median 4.0% in Royston — top-decile yield for the area; either an underpriced asset or a hidden risk that comps aren't pricing in. Stress-test before assuming the spread holds.
Location & tenants
- Location reads 58/100 on livability (#421 in GA) — a working-class tenant base; expect higher turnover. Strengths: cost of living A+, housing A, crime B+; Watch: amenities F, commute F, employment F.
- Franklin County (rural): math 38% / reading 35% proficiency, ranked #61 of 174 in GA (top 35%) — families likely to look elsewhere, expect single-tenant / working-renter base with shorter leases.
- Zoned schools: Royston Elementary School (math 54% / reading 38%, grade D-, #316 of 1,228 statewide, top 26%, 493 students, 73% FRL); Franklin County Middle School (math 32% / reading 35%, grade F, #206 of 470 statewide, top 45%, 826 students, 60% FRL).
- Market conditions: 95 active listings in the ZIP; 2 comparable units currently listed for rent nearby; 163 units permitted in Franklin County in 2024 (0 in 5+ unit buildings).
- This rent runs 44% of the median local income ($53k/yr) — at the standard rent-burdened threshold; future hikes will face affordability resistance.
Forward outlook
- In year one you build about $19k of equity ($1k loan paydown + $18k appreciation (10.0% local appreciation)).
- At projected returns (10.0% appreciation + 3.0% rent growth), your $50k cash investment doubles in ~2 years — after that, you're playing with house money.
- By year 2, paydown + projected appreciation supports a ~$31k cash-out refi (75% LTV) — recoverable capital for the next deal without selling this one.
Negotiation context
- It's been on market 22 days — a 2% lower offer ($177k) is reasonable based on typical stale-listing flexibility.
Risks & watch-outs
- Climate carrying-cost: extreme-heat days projected 7→16/yr by 2055 (HVAC capex compounding) — expect insurance premiums to compound above CPI over the hold.
Questions for the listing agent
- Built in 1971 — when were the roof, HVAC, electrical panel, plumbing, and water heater last replaced?
- Is there a deadline driving the sale (1031 exchange, divorce, estate, relocation)? That informs how much negotiation room exists.
- Schools are F-rated, which usually means shorter tenancies and higher turnover. Who's the typical renter profile here, and what's been the actual vacancy rate?
- What's the average days-on-market for RENTAL listings here right now (not sales)? A rising rental-DOM trend means longer vacancies and softer asking-rent achievability than the comps imply.
- What's the recent tenant-quality profile in this submarket — average credit score on applications, eviction rate, late-payment / NSF rate, and stable-employment percentage? A property-management company in the area should have these aggregated.
- How much new for-sale + rental construction is in the pipeline within 1–3 miles? Heavy new supply typically softens prices + rents 12–24 months out; constrained supply supports both.
Investment metrics
- 1% rule
- 1.10% ✓
- Cap rate
- 9.38%
- Cash-on-cash
- 11.01%
- DSCR
- 1.49
- GRM
- 7.6
CMA / ARV
- ARV (median comp)
- $227,300
- List price
- $180,000
- Delta
- -20.81%
- Verdict
- UNDERPRICED
- Comps
- 20 within 1.0 mi
Show comp detail 7 sales within ~0.75 mi
| Address | Dist | Beds/Ba | Sqft | Sold | Price | $/sf | Match |
|---|---|---|---|---|---|---|---|
| 285 Bowers St | 0.12mi | 4/2.0 (+1) | 1,955 (+6%) | 3mo | $285,000 | $146 | 77 |
| 134 College St | 0.32mi | 4/2.0 (+1) | 1,800 (-2%) | 1mo | $229,000 | $127 | 76 |
| 641 Church St | 0.28mi | 2/2.0 (-1) | 1,730 (-6%) | 8mo | $225,000 | $130 | 65 |
| 200 College St | 0.29mi | 3/2.0 | 1,987 (+8%) | 11mo | $169,900 | $86 | 64 |
| 35 Adams Place Dr | 0.38mi | 3/2.0 | 1,675 (-9%) | 14mo | $285,000 | $170 | 56 |
| 486 Ty Cobb St | 0.42mi | 2/2.0 (-1) | 1,592 (-14%) | 22mo | $151,000 | $95 | 34 |
| 414 Cherry St | 0.66mi | 4/2.5 (+1) | 2,080 (+13%) | 16mo | $275,000 | $132 | 27 |
Match score weights: distance 35% · size 25% · config 20% · recency 20%. Top-matched comps best support the ARV.
Projected returns pro-forma
10.0% appreciation · 3.0% rent growth · sell at horizon
- IRR
- 32.3%
- Equity multiple
- 3.53×
- Total profit
- $127,435
- Equity at exit
- $162,158
- IRR
- 27.9%
- Equity multiple
- 7.98×
- Total profit
- $351,999
- Equity at exit
- $349,700
Cash invested: $50,400 (down + closing). Projections, not guarantees.
Landlord ↔ Tenant lean methodology
- Overall (STATE)
- 90 Strongly Landlord-Friendly
- State Georgia
- 90 Strongly Landlord-Friendly · R+3
- County
- — inherits STATE
- City
- — inherits STATE
ZIP-level market 30662
- Home prices YoY
- 17.9%
- Active inventory
- 95
- Price-to-rent
- 7.6×
Monthly cashflow live
- Estimated rent
- $1,983 medium interval (Pro) →
- Mortgage (P&I)
- −$944
- Tax from tax record
- −$85 /mo · $1,024/yr
- Insurance
- −$75
- HOA
- −$0
- Vacancy / Maint / Mgmt
- −$416
- Net cashflow
- $463
Break-even live
UW: 25.0% down · 7.5% · 30yr · 1.5% tax · 5.0% vac · 8.0% maint · 8.0% mgmt
Financing live
Cash to close
- Down payment
- $45,000
- Closing costs
- $5,400
- Reserves months
- —
- Total cash needed
- —
Loan-product check · same deal, 3 products live
Conventional
25% down · 7.5% · 30yr
- Down + closing
- —
- Monthly P&I
- —
- Monthly cashflow
- —
- DSCR
- —
- Eligible?
- —
Personal DTI + credit; lowest rate.
DSCR
20% down · 8.5% · 30yr
- Down + closing
- —
- Monthly P&I
- —
- Monthly cashflow
- —
- DSCR
- —
- Eligible?
- —
No personal income docs; deal must DSCR.
Hard money
10% down · 12.0% · 12mo
- Down + closing
- —
- Monthly P&I
- —
- Monthly cashflow
- —
- DSCR
- —
- Eligible?
- —
Short-term bridge; refi at stabilization.
Rent comps 2 comps
| Address | Beds | Baths | Sqft | Rent | $/sqft | DOM | Units | Dist |
|---|---|---|---|---|---|---|---|---|
| 20 Breanna Way Royston, GA | 3.0 | 2.5 | 1380 | $2,500 | $1.81 | 13d | 1 | 0.28mi |
| 22 Freedom Point Rd Royston, GA | 3.0 | 2.0 | 1800 | $1,500 | $0.83 | 13d | 1 | 1.21mi |
Listing history 1 events
-
2026-05-04$180,000 New 464-char remark
ⓘ Source: listings_history table (triggers on properties + properties_extension) + one-shot
backfill from property_details.listing_events for pre-trigger history.
Tax reassessment forecast GA · Resets to sale price
- Current annual tax
- $1,024 · $85/mo
- Projected year-2 tax
- $1,656 · $138/mo
- Expected delta
- +$632/yr (+$53/mo · 61.8%)
ⓘ Screening estimate from a state-policy table — verify with the county assessor before closing.
Climate risk First Street
- Flood 1/10 Low FEMA zone X (unshaded) · 0% chance over 30 yrs
- Wildfire 4/10 Moderate
- Heat 5/10 Major 7 d/yr ≥105°F today · 16 d/yr by 30 yrs out
- Wind 4/10 Moderate 11% chance of damaging wind over 30 yrs
- Air quality 3/10 Moderate 2 unhealthy d/yr today · 4 by 30 yrs out
Nearby sold comps map
Loading sold comps map…
Walkable amenities ~0.75 mi
Loading nearby amenities…
Taxation est. · year 1
- Rental income
- $23,799
- − Mortgage interest
- −$10,083
- − Property taxes
- −$1,024
- − Insurance
- −$900
- − Repairs & maintenance
- −$1,904
- − Management
- −$1,904
- − Depreciation
- −$5,236
- Taxable income
- $2,748
- Est. tax owed @ 24.0%
- −$660
- After-tax cash flow
- $4,891/yr
For passive investors: Depreciation is non-cash, so a rental often shows a tax loss while cash-flowing — sheltering income. Rental losses are passive: they offset passive income freely, and up to $25,000/yr can offset ordinary (W-2) income if you actively participate and your MAGI is under $100k (phasing out to $0 by $150k); unused losses carry forward. On sale, claimed depreciation is recaptured at up to 25%, and gains may owe capital-gains tax (a 1031 exchange can defer both). Figures are a year-1 estimate at your 24.0% rate — not tax advice; consult a CPA.
Schools (NCES district)
- District
- Franklin County
- NCES district ID
- 1302250
- Math proficiency
- 38% ▼ -1.00%
- Reading proficiency
- 35% ▼ -3.00%
- Median HH income
- $35,985
- Composite
- 30.28/100
- National rank
- #6281
- State rank
- #61 of 174 in GA
Livability — Royston
- Score
- 58/100
- State rank
- #421
- US rank
- #20753
Category grades
Schools grade is shown separately in the Schools card above.
Census & demographics
- Census place
- Royston, GA
- County
- Franklin County · 7,950 people
- City population
- 7,950
- Metro
- Athens-Clarke County, GA
- Population (ZIP)
- 7,950
- Household income
- $53,487
- Rent vs Own
- Severe rent burden
- 72.0
Population outlook (Franklin County) Hauer SSP2
- Today (2025)
- 22,625 people
- By 2030
- 22,725 · +0.4%
- By 2040
- 22,806 · +0.8%
- By 2050
- 22,713 · +0.4%
- By 2075
- 22,514 · -0.5%
- By 2100
- 20,768 · -8.2%
Race, ethnicity, and origin ACS 2023
- Neighborhood character
- Predominantly White (77%)
- Race & ethnicity
- White 77% Black 11% Two or more races 5% Hispanic / Latino 4% Asian 4%
- Common ancestry
- Slovak 2% Romanian 1% Lithuanian 1%
- Foreign-born
- 6% · Vietnam, Canada
- Languages at home
- 91% English-only · Vietnamese 4% Spanish 3% German/W. Germanic 1%
Political lean MEDSL · Franklin
- 2024 margin
- Solid R (+72.6) · D 13.6% · R 86.2%
- 2008→2024 swing
- -21.1pp toward R · 2008: -51.5pp · 2024: -72.6pp
- All cycles
- 2024: R+72.6 2020: R+69.5 2016: R+68.6 2012: R+59.5 2008: R+51.5
Not yet ingested
- Civics
- —
Market trends
- HPI YoY
- ▲ 62.43%
- Current HPI
- 410.693
- Rent YoY
- —
- Metro
- Athens-Clarke County, GA
- State GDP YoY
- ▲ 2.66%
- F500 in state
- 28
Industry mix (Fortune 500 HQ in GA)
| Industry | F500 HQs | Revenue |
|---|---|---|
| Paper / Packaging | 2 | $29B |
|
||
| Retail | 1 | $160B |
|
||
| Transportation / Logistics | 1 | $91B |
|
||
| Airlines | 1 | $62B |
|
||
| Consumer Goods | 1 | $47B |
|
||
| Utilities | 1 | $25B |
|
||
Price history
2 events — show timeline
- 2026-05-27 Pending — GAMLS
- 2026-05-04 Listed $180,000 GAMLS
Property tax history
+7.4%/yrLatest (2025): $1,024 · +0.2% YoY. Source: county tax records.
Cash-flow waterfall
monthlySold comps — $/sqft
last 12 mo · ≤1 miLoading sold comps…