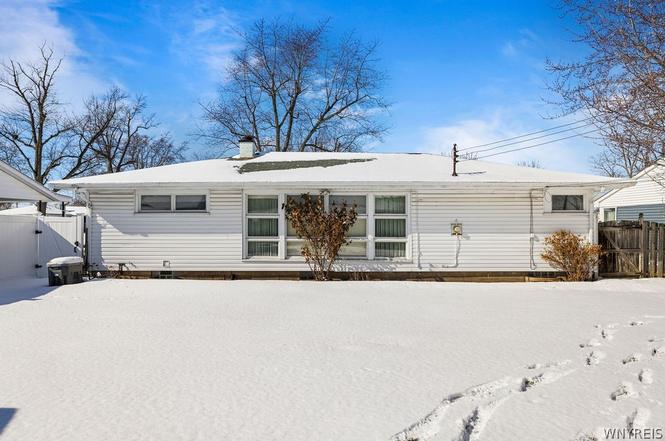
569 Woodstock Ave · Tonawanda Town, NY
Flood risk 4/10 · Minor
- FEMA flood zone
- X (unshaded)
- Chance of flooding over 30 yrs
- 0.24%
- Est. flood insurance / yr
- $473 – $860
Fire risk 1/10 · Minimal
- Est. fire insurance / yr
- $691 – $1,283
Heat risk 3/10 · Minor
- Hot days now (above 93°F)
- 7 days/yr
- Hot days in 30 yrs
- 15 days/yr
Wind risk 1/10 · Minimal
- Chance of severe wind over 30 yrs
- —
Air-quality risk 3/10 · Minor
- Unhealthy air days now
- 2 days/yr
- Unhealthy air days in 30 yrs
- 3 days/yr
Risk factors via First Street. Map © Google.
Why this score? — see what drove the C+ grade
The composite is a weighted blend of 9 inputs, each scored 0–100. Each bar is that input's sub-score; the figure is the points it added to the 100-point composite (weight × sub-score).
- Cash flow +21.1/30.0
- ARV discount +15.0/15.0
- 1% rule +8.4/10.0
- DSCR +6.7/10.0
- Rent growth +4.2/5.0
- Schools +3.9/10.0
- Livability +2.5/5.0
- Condition / age +2.5/5.0
- Appreciation +0.0/10.0
$150,000
🖨 Deal sheet 📄 Offer letter ✓ Due diligence
Listing remarks
Located in the highly desirable Green Acres neighborhood, 569 Woodstock presents a rare opportunity to customize a home in one of the area’s most sought-after communities. Known for its tree-lined streets, established homes, and convenient location, Green Acres continues to be a favorite for buyers looking for both charm and long-term value. This property offers solid rehab potential for renovation. The home is ready for updates and personal touches to truly make it shine. The basement requires remediation, making this an ideal project for investors, contractors, or buyers looking to build equity through improvements. Whether you’re envisioning a full renovation or strategic upd
Key facts
- Tree lined streets
- 6,932 sq ft lot
- Parking
Tags
Neighborhood map
What this means for you Summary
Snapshot
- This is a 3-bed/1.0-bath single-family listed at $150k.
Deal economics
- At list price, monthly cash flow is $213 ($3k/yr) — positive.
- The deal already cash-flows at list — no discount required.
- Meets the 1% rule at list price ($2k rent vs $150k).
- Cap rate 8.0% vs local median 4.1% in Tonawanda Town — top-decile yield for the area; either an underpriced asset or a hidden risk that comps aren't pricing in. Stress-test before assuming the spread holds.
Location & tenants
- Location reads: area grade C — affects rentability + tenant quality, not the cash-flow math above.
- Kenmore-Tonawanda Union Free School District (suburban): math 44% / reading 47% proficiency, ranked #453 of 590 in NY (top 77%) — families likely to look elsewhere, expect single-tenant / working-renter base with shorter leases.
- Market conditions: Rents rising fast (+6.8%/yr); 191 active listings in the ZIP; 11 comparable units currently listed for rent nearby; rentals leasing fast (median 3d on market — plan ~1-2 weeks tenant-placement turnaround); 1,244 units permitted in Erie County in 2024 (563 in 5+ unit buildings).
- This rent runs 34% of the median local income ($71k/yr) — at the standard rent-burdened threshold; future hikes will face affordability resistance.
Forward outlook
- Local home prices are declining (-3.0%/yr); year-one equity from $1k of loan paydown is wiped out by about $4k of value loss. Plan a longer hold.
- At projected returns (-3.0% appreciation + 6.8% rent growth), your $42k cash investment doubles in ~9 years — after that, you're playing with house money.
Negotiation context
- Only 2 days on market — expect competitive offers; lowballing is unlikely to land.
- Current owner paid $109k; 38% above their basis — modest negotiation headroom, anchor on the comps not their cost.
Risks & watch-outs
- Watch-outs: property tax is 4.2% of price; built in 1956 — expect roof / HVAC / electrical / plumbing capex.
Questions for the listing agent
- Built in 1956 — when were the roof, HVAC, electrical panel, plumbing, and water heater last replaced?
- Property tax is high relative to price — has the assessment been appealed recently, and will the sale trigger a re-assessment?
- Is there a deadline driving the sale (1031 exchange, divorce, estate, relocation)? That informs how much negotiation room exists.
- What's the average days-on-market for RENTAL listings here right now (not sales)? A rising rental-DOM trend means longer vacancies and softer asking-rent achievability than the comps imply.
- What's the recent tenant-quality profile in this submarket — average credit score on applications, eviction rate, late-payment / NSF rate, and stable-employment percentage? A property-management company in the area should have these aggregated.
- How much new for-sale + rental construction is in the pipeline within 1–3 miles? Heavy new supply typically softens prices + rents 12–24 months out; constrained supply supports both.
Investment metrics
- 1% rule
- 1.34% ✓
- Cap rate
- 8.00%
- Cash-on-cash
- 6.10%
- DSCR
- 1.27
- GRM
- 6.2
CMA / ARV
- ARV (on-the-fly)
- $258,156
- Comps found
- 12
Show comp detail 12 sales within ~0.75 mi
| Address | Dist | Beds/Ba | Sqft | Sold | Price | $/sf | Match |
|---|---|---|---|---|---|---|---|
| 325 Glenalby Rd | 0.04mi | 3/1.0 | 1,238 (+2%) | 2mo | $285,000 | $230 | 93 |
| 482 Woodstock Ave | 0.16mi | 3/1.0 | 1,199 (-1%) | 3mo | $275,650 | $230 | 88 |
| 25 Jamaica Rd | 0.46mi | 3/1.0 | 1,150 (-5%) | 3mo | $215,000 | $187 | 68 |
| 1283 Brighton Rd | 0.66mi | 3/1.0 | 1,225 (+1%) | 1mo | $230,000 | $188 | 67 |
| 401 Glenalby Rd Rd | 0.15mi | 3/2.0 | 1,389 (+15%) | 0mo | $249,900 | $180 | 64 |
| 716 Brighton Rd | 0.72mi | 3/1.0 | 1,224 (+1%) | 1mo | $260,500 | $213 | 64 |
| 59 Idlewood Dr | 0.44mi | 3/2.0 | 1,119 (-8%) | 2mo | $335,000 | $299 | 61 |
| 236 Koenig Rd | 0.56mi | 3/1.5 | 1,288 (+6%) | 2mo | $211,000 | $164 | 60 |
| 100 Calvin Ct S | 0.74mi | 3/2.0 | 1,230 (+2%) | 1mo | $337,000 | $274 | 58 |
| 1257 Brighton Rd | 0.62mi | 3/2.0 | 1,268 (+5%) | 3mo | $225,000 | $177 | 57 |
| 132 Overbrook Ave | 0.40mi | 2/1.0 (-1) | 1,042 (-14%) | 4mo | $261,000 | $250 | 50 |
| 85 Halladay Ln | 0.71mi | 3/1.5 | 1,350 (+11%) | 2mo | $255,000 | $189 | 44 |
Match score weights: distance 35% · size 25% · config 20% · recency 20%. Top-matched comps best support the ARV.
Projected returns pro-forma
-3.0% appreciation · 6.75% rent growth · sell at horizon
- IRR
- -1.6%
- Equity multiple
- 0.94×
- Total profit
- $-2,600
- Equity at exit
- $22,365
- IRR
- 12.6%
- Equity multiple
- 2.22×
- Total profit
- $51,138
- Equity at exit
- $12,969
Cash invested: $42,000 (down + closing). Projections, not guarantees.
Landlord ↔ Tenant lean methodology
- Overall (STATE)
- 15 Strongly Tenant-Friendly
- State New York
- 15 Strongly Tenant-Friendly · D+10
- County
- — inherits STATE
- City
- — inherits STATE
ZIP-level market 14150
- Rents YoY
- 6.8%
- Active inventory
- 191
- Price-to-rent
- 6.2×
Monthly cashflow live
- Estimated rent
- $2,013 high interval (Pro) →
- Mortgage (P&I)
- −$787
- Tax from tax record
- −$528 /mo · $6,331/yr
- Insurance
- −$62
- HOA
- −$0
- Vacancy / Maint / Mgmt
- −$423
- Net cashflow
- $213
Break-even live
UW: 25.0% down · 7.5% · 30yr · 1.5% tax · 5.0% vac · 8.0% maint · 8.0% mgmt
Financing live
Cash to close
- Down payment
- $37,500
- Closing costs
- $4,500
- Reserves months
- —
- Total cash needed
- —
Loan-product check · same deal, 3 products live
Conventional
25% down · 7.5% · 30yr
- Down + closing
- —
- Monthly P&I
- —
- Monthly cashflow
- —
- DSCR
- —
- Eligible?
- —
Personal DTI + credit; lowest rate.
DSCR
20% down · 8.5% · 30yr
- Down + closing
- —
- Monthly P&I
- —
- Monthly cashflow
- —
- DSCR
- —
- Eligible?
- —
No personal income docs; deal must DSCR.
Hard money
10% down · 12.0% · 12mo
- Down + closing
- —
- Monthly P&I
- —
- Monthly cashflow
- —
- DSCR
- —
- Eligible?
- —
Short-term bridge; refi at stabilization.
Rent comps 11 comps
| Address | Beds | Baths | Sqft | Rent | $/sqft | DOM | Units | Dist |
|---|---|---|---|---|---|---|---|---|
| 200 Koenig Rd Tonawanda, NY | 2.0 | 1.5 | 1481 | $2,200 | $1.49 | 1d | 1 | 0.52mi |
| 2776 Eggert Rd #2 Tonawanda, NY | 3.0 | 1.0 | 972 | $1,600 | $1.65 | 23d | 1 | 0.52mi |
| 1257 Brighton Rd Tonawanda, NY | 4.0 | 1.0 | 1268 | $2,500 | $1.97 | 3d | 1 | 0.61mi |
| 1257 Brighton Rd Tonawanda, NY | 4.0 | 1.0 | 1268 | $2,500 | $1.97 | 16d | 1 | 0.61mi |
| 3948 Ridge Lea Rd Unit D Buffalo, NY | 2.0 | 1.0 | 952 | $1,850 | $1.94 | 1d | 1 | 0.89mi |
| 182 Woodcrest Dr Amherst, NY | 3.0 | 1.5 | 1380 | $2,300 | $1.67 | 19d | 1 | 1.29mi |
| 1410 Deer Lakes Dr Amherst, NY | 2.0 | 2.0 | 1300 | $1,995 | $1.53 | 3d | 5 | 1.31mi |
| 4765 N Bailey Ave Buffalo, NY | 2.0 | 1.0 | 900 | $2,100 | $2.33 | 43d | 1 | 1.37mi |
| 4585 Chestnut Ridge Rd #4 Buffalo, NY | 2.0 | 2.0 | 1197 | $1,600 | $1.34 | 23d | 1 | 1.39mi |
| 103 Raintree Is Tonawanda, NY | 1.0–2.0 | 1.0 | 700 | $1,800 | $2.57 | 1d | 35 | 1.41mi |
| 285 Crestmount Ave Tonawanda, NY | 1.0–2.0 | 1.0 | 725 | $1,905 | $2.63 | 1d | 9 | 1.49mi |
Listing history 5 events
-
2026-03-13status Pending
-
2026-03-11$150,000 Active
-
2004-09-03soldstatus $108,900
-
2000-01-21soldstatus $85,000
-
1998-07-17soldstatus $79,000
ⓘ Source: listings_history table (triggers on properties + properties_extension) + one-shot
backfill from property_details.listing_events for pre-trigger history.
Tax reassessment forecast NY · Partial reset (capped growth)
- Current annual tax
- $6,331 · $528/mo
- Projected year-2 tax
- $6,331 · $528/mo
- Expected delta
- $0/yr ($0/mo · 0.0%)
ⓘ Screening estimate from a state-policy table — verify with the county assessor before closing.
Climate risk First Street
- Flood 4/10 Moderate FEMA zone X (unshaded) · 24% chance over 30 yrs
- Wildfire 1/10 Low
- Heat 3/10 Moderate 7 d/yr ≥93°F today · 15 d/yr by 30 yrs out
- Wind 1/10 Low
- Air quality 3/10 Moderate 2 unhealthy d/yr today · 3 by 30 yrs out
Nearby sold comps map
Loading sold comps map…
Walkable amenities ~0.75 mi
Loading nearby amenities…
Taxation est. · year 1
- Rental income
- $24,152
- − Mortgage interest
- −$8,402
- − Property taxes
- −$6,331
- − Insurance
- −$750
- − Repairs & maintenance
- −$1,932
- − Management
- −$1,932
- − Depreciation
- −$4,364
- Taxable income
- $441
- Est. tax owed @ 24.0%
- −$106
- After-tax cash flow
- $2,454/yr
For passive investors: Depreciation is non-cash, so a rental often shows a tax loss while cash-flowing — sheltering income. Rental losses are passive: they offset passive income freely, and up to $25,000/yr can offset ordinary (W-2) income if you actively participate and your MAGI is under $100k (phasing out to $0 by $150k); unused losses carry forward. On sale, claimed depreciation is recaptured at up to 25%, and gains may owe capital-gains tax (a 1031 exchange can defer both). Figures are a year-1 estimate at your 24.0% rate — not tax advice; consult a CPA.
Schools (NCES district)
- District
- Kenmore-Tonawanda Union Free School District
- NCES district ID
- 3616230
- Math proficiency
- 44% ▼ -12.00%
- Reading proficiency
- 47% ▼ -1.00%
- Median HH income
- $51,433
- Composite
- 39.18/100
- National rank
- #4024
- State rank
- #453 of 590 in NY
Livability — Tonawanda Town
No livability data for this city. (Only ~50 U.S. cities are tracked.)
Census & demographics
- Census place
- Tonawanda Town, NY
- County
- Erie County · 714,559 people
- City population
- 41,260
- Metro
- Buffalo-Cheektowaga, NY
- Population (ZIP)
- 41,260
- Household income
- $71,406
- Rent vs Own
- Severe rent burden
- 1427.0
Population outlook (Erie County) Hauer SSP2
- Today (2025)
- 933,037 people
- By 2030
- 935,181 · +0.2%
- By 2040
- 928,531 · -0.5%
- By 2050
- 905,725 · -2.9%
- By 2075
- 834,037 · -10.6%
- By 2100
- 708,033 · -24.1%
Race, ethnicity, and origin ACS 2023
- Neighborhood character
- Predominantly White (87%)
- Race & ethnicity
- White 87% Two or more races 5% Hispanic / Latino 5% Black 4% Asian 2%
- Common ancestry
- Romanian 13% Lithuanian 3% Slovak 2%
- Foreign-born
- 6% · Canada, Philippines, Vietnam
- Languages at home
- 94% English-only · Other Indo-European 2% Spanish 1% Russian/Polish/Slavic 1%
Political lean MEDSL · Erie
- 2024 margin
- Lean D (+9.7) · D 54.8% · R 45.2%
- 2008→2024 swing
- -7.9pp toward R · 2008: 17.5pp · 2024: 9.7pp
- All cycles
- 2024: D+9.7 2020: D+14.7 2016: D+4.8 2012: D+15.6 2008: D+17.5
Not yet ingested
- Civics
- —
Market trends
- HPI YoY
- ▼ -260.43%
- Current HPI
- 334.5893
- Rent YoY
- ▲ 6.75%
- Metro
- Buffalo-Cheektowaga, NY
- State GDP YoY
- ▲ 2.60%
- F500 in state
- 92
Industry mix (Fortune 500 HQ in NY)
| Industry | F500 HQs | Revenue |
|---|---|---|
| Financial Services | 10 | $950B |
|
||
| Consumer Goods | 9 | $162B |
|
||
| Insurance | 4 | $225B |
|
||
| Telecommunications | 2 | $144B |
|
||
| Pharmaceuticals | 2 | $112B |
|
||
| Media / Entertainment | 2 | $69B |
|
||
Price history
+89.9% since first listed5 events — show timeline
- 2026-03-13 Pending — WNYREIS
- 2026-03-11 Listed $150,000 WNYREIS
- 2004-09-03 Sold (Public Records) $108,900 Public Records
- 2000-01-21 Sold (Public Records) $85,000 Public Records
- 1998-07-17 Sold (Public Records) $79,000 Public Records
Property tax history
+7.2%/yrLatest (2025): $6,331 · +1.2% YoY. Source: county tax records.
Cash-flow waterfall
monthlySold comps — $/sqft
last 12 mo · ≤1 miLoading sold comps…