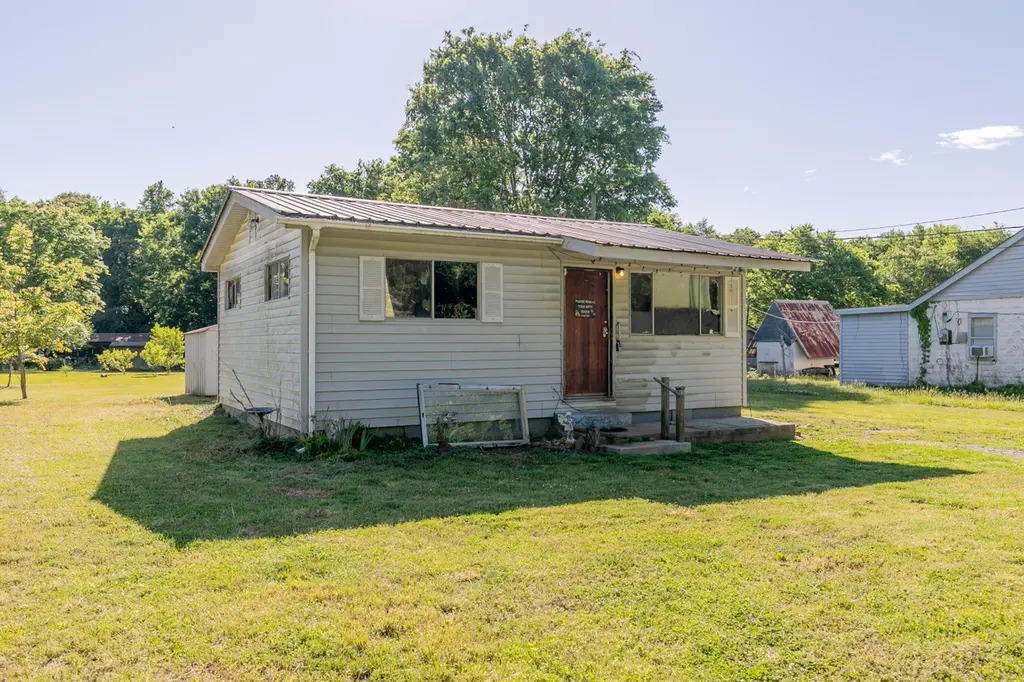
15000 Back Valley Rd · Sale Creek, TN
Flood risk 3/10 · Minor
- FEMA flood zone
- X (unshaded)
- Chance of flooding over 30 yrs
- 0.2%
- Est. flood insurance / yr
- $507 – $1,088
Fire risk 5/10 · Moderate
- Est. fire insurance / yr
- $949 – $1,763
Heat risk 5/10 · Moderate
- Hot days now (above 105°F)
- 8 days/yr
- Hot days in 30 yrs
- 22 days/yr
Wind risk 3/10 · Minor
- Chance of severe wind over 30 yrs
- 8.0%
Air-quality risk 3/10 · Minor
- Unhealthy air days now
- 2 days/yr
- Unhealthy air days in 30 yrs
- 3 days/yr
Risk factors via First Street. Map © Google.
Why this score? — see what drove the B grade
The composite is a weighted blend of 9 inputs, each scored 0–100. Each bar is that input's sub-score; the figure is the points it added to the 100-point composite (weight × sub-score).
- Cash flow +30.0/30.0
- DSCR +10.0/10.0
- 1% rule +9.4/10.0
- ARV discount +7.5/15.0
- Appreciation +6.8/10.0
- Livability +3.1/5.0
- Schools +2.7/10.0
- Rent growth +2.5/5.0
- Condition / age +2.5/5.0
$65,000
🖨 Deal sheet 📄 Offer letter ✓ Due diligence
Listing remarks
Cozy 2-bedroom, 1-bath cottage offering the perfect opportunity for investors or buyers ready to add their own personal touches and build sweat equity. Tucked away in the peaceful countryside of Sale Creek, this home provides the charm of quiet living while still being conveniently located to shopping, dining, and everyday essentials in nearby Hixson and downtown Chattanooga. Easy access to Highway 27 makes commuting simple while keeping you close to everything the Scenic City has to offer. Outdoor enthusiasts will love being near Chickamauga Lake, the Tennessee River, hiking trails, fishing, boating, kayaking, and endless opportunities for exploring the natural beauty of the area. Whether
Key facts
- 5,662 sq ft lot
- Built 1957
- Listed 44 days
Property features AI
Exterior
- Parking: Off-street parking
- Utilities: Public water; Septic tank; Electricity available and connected; Water available and connected
- Home design: Single-family residence; Residential property
- Construction: Vinyl siding; Concrete perimeter foundation; Built area of 520 (above grade)
- Exterior features: Storage; Metal roof
Interior
- Bathrooms: 1 full bathroom
- Heating & cooling: Window unit cooling
- Interior features: Window cooling units
Neighborhood map
What this means for you Summary
Snapshot
- This is a 2-bed/1.0-bath single-family listed at $65k.
Deal economics
- At list price, monthly cash flow is $353 ($4k/yr) — positive.
- The deal already cash-flows at list — no discount required.
- Meets the 1% rule at list price ($934 rent vs $65k).
- Recommended offer: $63k (3.0% below list) — sets the bar for market timing.
- Cap rate 12.8% vs local median 2.2% in Sale Creek — top-decile yield for the area; either an underpriced asset or a hidden risk that comps aren't pricing in. Stress-test before assuming the spread holds.
Location & tenants
- Location reads 62/100 on livability (#211 in TN) — a middle-class / working-renter tenant base. Strengths: cost of living A+, housing A+, crime A; Watch: health & safety C-, employment D, amenities F.
- Hamilton County (urban): math 31% / reading 31% proficiency, ranked #42 of 139 in TN (top 30%) — families likely to look elsewhere, expect single-tenant / working-renter base with shorter leases.
- Zoned schools: North Hamilton Elementary (math 47% / reading 42%, grade F, #164 of 952 statewide, top 19%, 387 students, 0% FRL); Sale Creek Middle / High School (math 31% / reading 32%, grade F, #69 of 332 statewide, top 21%, 611 students, 0% FRL) — zoned schools average 0% FRL vs 52% district-wide (52 pts lower); this property's tenant base skews higher-income than the district average.
- Market conditions: 46 active listings in the ZIP; 2,133 units permitted in Hamilton County in 2024 (405 in 5+ unit buildings).
Forward outlook
- In year one you build about $3k of equity ($449 loan paydown + $2k appreciation (3.6% local appreciation)).
- Hamilton County population projected at +23% by 2050 — long-run rental-demand tailwind backs the buy-and-hold thesis.
- At projected returns (3.6% appreciation + 3.0% rent growth), your $18k cash investment doubles in ~3 years — after that, you're playing with house money.
Negotiation context
- It's been on market 44 days — a 3% lower offer ($63k) is reasonable based on typical stale-listing flexibility.
Risks & watch-outs
- Watch-outs: built in 1957 — expect roof / HVAC / electrical / plumbing capex.
- Climate carrying-cost: moderate wildfire risk; extreme-heat days projected 8→22/yr by 2055 (HVAC capex compounding) — expect insurance premiums to compound above CPI over the hold.
Questions for the listing agent
- It's been on market 44 days. Have you received any prior offers? Is the seller open to a 3% concession, seller financing, or rate buy-down credit?
- Built in 1957 — when were the roof, HVAC, electrical panel, plumbing, and water heater last replaced?
- Is there a deadline driving the sale (1031 exchange, divorce, estate, relocation)? That informs how much negotiation room exists.
- Schools are D-rated, which usually means shorter tenancies and higher turnover. Who's the typical renter profile here, and what's been the actual vacancy rate?
- What's the average days-on-market for RENTAL listings here right now (not sales)? A rising rental-DOM trend means longer vacancies and softer asking-rent achievability than the comps imply.
- What's the recent tenant-quality profile in this submarket — average credit score on applications, eviction rate, late-payment / NSF rate, and stable-employment percentage? A property-management company in the area should have these aggregated.
- How much new for-sale + rental construction is in the pipeline within 1–3 miles? Heavy new supply typically softens prices + rents 12–24 months out; constrained supply supports both.
Investment metrics
- 1% rule
- 1.44% ✓
- Cap rate
- 12.81%
- Cash-on-cash
- 23.28%
- DSCR
- 2.04
- GRM
- 5.8
CMA / ARV
No comps found within radius.
Projected returns pro-forma
3.65% appreciation · 3.0% rent growth · sell at horizon
- IRR
- 30.7%
- Equity multiple
- 2.79×
- Total profit
- $32,568
- Equity at exit
- $31,649
- IRR
- 30.4%
- Equity multiple
- 5.49×
- Total profit
- $81,658
- Equity at exit
- $50,747
Cash invested: $18,200 (down + closing). Projections, not guarantees.
Landlord ↔ Tenant lean methodology
- Overall (STATE)
- 87 Strongly Landlord-Friendly
- State Tennessee
- 87 Strongly Landlord-Friendly · R+13
- County
- — inherits STATE
- City
- — inherits STATE
ZIP-level market 37373
- Home prices YoY
- 1.3%
- Active inventory
- 46
- Price-to-rent
- 5.8×
Monthly cashflow live
- Estimated rent
- $934 medium interval (Pro) →
- Mortgage (P&I)
- −$341
- Tax from tax record
- −$17 /mo · $201/yr
- Insurance
- −$27
- HOA
- −$0
- Vacancy / Maint / Mgmt
- −$196
- Net cashflow
- $353
Break-even live
UW: 25.0% down · 7.5% · 30yr · 1.5% tax · 5.0% vac · 8.0% maint · 8.0% mgmt
Financing live
Cash to close
- Down payment
- $16,250
- Closing costs
- $1,950
- Reserves months
- —
- Total cash needed
- —
Loan-product check · same deal, 3 products live
Conventional
25% down · 7.5% · 30yr
- Down + closing
- —
- Monthly P&I
- —
- Monthly cashflow
- —
- DSCR
- —
- Eligible?
- —
Personal DTI + credit; lowest rate.
DSCR
20% down · 8.5% · 30yr
- Down + closing
- —
- Monthly P&I
- —
- Monthly cashflow
- —
- DSCR
- —
- Eligible?
- —
No personal income docs; deal must DSCR.
Hard money
10% down · 12.0% · 12mo
- Down + closing
- —
- Monthly P&I
- —
- Monthly cashflow
- —
- DSCR
- —
- Eligible?
- —
Short-term bridge; refi at stabilization.
Listing history 17 events
-
2026-06-18days on market $65,000 Active 44 DOM
-
2026-06-17days on market $65,000 Active 43 DOM
-
2026-06-16days on market $65,000 Active 42 DOM
-
2026-06-15days on market $65,000 Active 41 DOM
-
2026-06-14days on market $65,000 Active 39 DOM
-
2026-06-10days on market $65,000 Active 36 DOM
-
2026-06-09days on market $65,000 Active 35 DOM
-
2026-06-08days on market $65,000 Active 34 DOM
-
2026-06-07days on market $65,000 Active 33 DOM
-
2026-06-05days on market $65,000 Active 30 DOM
-
2026-06-03days on market $65,000 Active 29 DOM
-
2026-06-02days on market $65,000 Active 28 DOM
-
2026-06-01days on market $65,000 Active 27 DOM
-
2026-05-31days on market $65,000 Active 26 DOM
-
2026-05-30days on market $65,000 Active 25 DOM
-
2026-05-14price $65,000
-
2026-05-05$75,000 Active
ⓘ Source: listings_history table (triggers on properties + properties_extension) + one-shot
backfill from property_details.listing_events for pre-trigger history.
Tax reassessment forecast TN · Resets to sale price
- Current annual tax
- $201 · $17/mo
- Projected year-2 tax
- $462 · $38/mo
- Expected delta
- +$260/yr (+$22/mo · 129.0%)
ⓘ Screening estimate from a state-policy table — verify with the county assessor before closing.
Climate risk First Street
- Flood 3/10 Moderate FEMA zone X (unshaded) · 20% chance over 30 yrs
- Wildfire 5/10 Major
- Heat 5/10 Major 8 d/yr ≥105°F today · 22 d/yr by 30 yrs out
- Wind 3/10 Moderate 8% chance of damaging wind over 30 yrs
- Air quality 3/10 Moderate 2 unhealthy d/yr today · 3 by 30 yrs out
Nearby sold comps map
Loading sold comps map…
Walkable amenities ~0.75 mi
Loading nearby amenities…
Taxation est. · year 1
- Rental income
- $11,207
- − Mortgage interest
- −$3,641
- − Property taxes
- −$201
- − Insurance
- −$325
- − Repairs & maintenance
- −$897
- − Management
- −$897
- − Depreciation
- −$1,891
- Taxable income
- $3,356
- Est. tax owed @ 24.0%
- −$805
- After-tax cash flow
- $3,431/yr
For passive investors: Depreciation is non-cash, so a rental often shows a tax loss while cash-flowing — sheltering income. Rental losses are passive: they offset passive income freely, and up to $25,000/yr can offset ordinary (W-2) income if you actively participate and your MAGI is under $100k (phasing out to $0 by $150k); unused losses carry forward. On sale, claimed depreciation is recaptured at up to 25%, and gains may owe capital-gains tax (a 1031 exchange can defer both). Figures are a year-1 estimate at your 24.0% rate — not tax advice; consult a CPA.
Schools (NCES district)
- District
- Hamilton County
- NCES district ID
- 4701590
- Math proficiency
- 31% ▼ -10.00%
- Reading proficiency
- 31% ▼ -3.00%
- Median HH income
- $47,456
- Composite
- 26.8/100
- National rank
- #7122
- State rank
- #42 of 139 in TN
Livability — Sale Creek
- Score
- 62/100
- State rank
- #211
- US rank
- #16188
Category grades
Schools grade is shown separately in the Schools card above.
Census & demographics
- Census place
- Sale Creek, TN
- City population
- 2,949
- Population (ZIP)
- 2,949
Population outlook (Hamilton County) Hauer SSP2
- Today (2025)
- 393,784 people
- By 2030
- 412,983 · +4.9%
- By 2040
- 449,502 · +14.1%
- By 2050
- 484,341 · +23.0%
- By 2075
- 565,746 · +43.7%
- By 2100
- 618,394 · +57.0%
Race, ethnicity, and origin ACS 2023
- Neighborhood character
- Predominantly White (91%)
- Race & ethnicity
- White 91% Two or more races 6% Hispanic / Latino 5%
- Common ancestry
- Slovak 3% Lithuanian 3% Serbian 3%
- Foreign-born
- 2% · Canada, Jamaica
- Languages at home
- 96% English-only · Spanish 4%
Political lean MEDSL · Hamilton
- 2024 margin
- R (+13.1) · D 42.7% · R 55.7% · Other 1.6%
- 2008→2024 swing
- -1.2pp toward R · 2008: -11.8pp · 2024: -13.1pp
- All cycles
- 2024: R+13.1 2020: R+9.7 2016: R+16.6 2012: R+14.8 2008: R+11.8
Not yet ingested
- Civics
- —
Market trends
- HPI YoY
- ▲ 3.65%
- Current HPI
- 286.284
- Rent YoY
- —
- Metro
- —
- State GDP YoY
- ▲ 2.78%
- F500 in state
- 22
Industry mix (Fortune 500 HQ in TN)
| Industry | F500 HQs | Revenue |
|---|---|---|
| Healthcare | 3 | $91B |
|
||
| Retail | 3 | $72B |
|
||
| Transportation / Logistics | 1 | $88B |
|
||
| Paper / Packaging | 1 | $19B |
|
||
| Insurance | 1 | $13B |
|
||
| Energy | 1 | $12B |
|
||
Price history
-13.3% since first listed2 events — show timeline
- 2026-05-14 Price Changed $65,000 GCAR
- 2026-05-05 Listed $75,000 GCAR
Property tax history
+0.7%/yrLatest (2025): $201 · -0.2% YoY. Source: county tax records.
Cash-flow waterfall
monthlySold comps — $/sqft
last 12 mo · ≤1 miLoading sold comps…