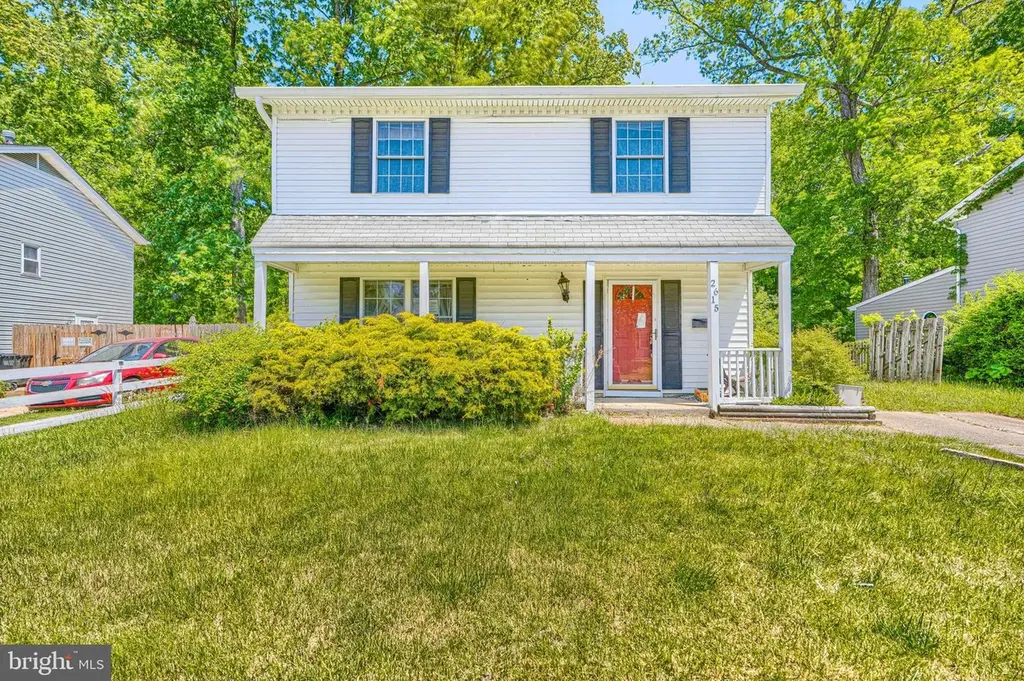
2615 Thornberry Dr · Edgewood, MD
Flood risk 1/10 · Minimal
- FEMA flood zone
- X (unshaded)
- Chance of flooding over 30 yrs
- 0.0%
- Est. flood insurance / yr
- $507 – $1,088
Fire risk 1/10 · Minimal
- Est. fire insurance / yr
- $755 – $1,403
Heat risk 7/10 · Major
- Hot days now (above 104°F)
- 7 days/yr
- Hot days in 30 yrs
- 15 days/yr
Wind risk 6/10 · Moderate
- Chance of severe wind over 30 yrs
- 27.0%
Air-quality risk 4/10 · Minor
- Unhealthy air days now
- 4 days/yr
- Unhealthy air days in 30 yrs
- 6 days/yr
Risk factors via First Street. Map © Google.
Why this score? — see what drove the C grade
The composite is a weighted blend of 9 inputs, each scored 0–100. Each bar is that input's sub-score; the figure is the points it added to the 100-point composite (weight × sub-score).
- Cash flow +19.1/30.0
- ARV discount +14.0/15.0
- DSCR +6.0/10.0
- 1% rule +4.3/10.0
- Rent growth +3.7/5.0
- Livability +3.7/5.0
- Schools +2.9/10.0
- Condition / age +2.5/5.0
- Appreciation +0.0/10.0
$249,900
🖨 Deal sheet 📄 Offer letter ✓ Due diligence
Listing remarks
This is a combination Estate sale and Pre-approved short sale. 4Bd/1.5ba Colonial (no basement), off street prking, covered deck off of kitchen PR requests property be on the market for 7 days before reviewing offer(s). Asset Manager and PR prefer using Gemini Title.
Key facts
- 7,680 sq ft lot
- Built 1971
- Listed 37 days
Property features AI
Finance
- Other: Above-grade finished area reported as 1,400 (source: Assessor); No basement / below-grade area reported as 0; Land and improvement assessed values available (financial details omitted)
- Financial info: Fee simple ownership
- HOA & community: Ground rent paid annually
Exterior
- Parking: Driveway parking
- Utilities: Public water; Public sewer
- Home design: Detached property; Below average condition
- Construction: Vinyl siding; Asphalt roof; Slab foundation; Building winterized; Built year source: Assessor
- Exterior features: Driveway
Interior
- Kitchen: Kitchen (appliances not specified)
- Bedrooms: 4 bedrooms on the first upper level
- Bathrooms: 1 full bathroom; 5 half bathrooms
- Heating & cooling: Forced air heating; Central air conditioning; Natural gas fuel for heating and cooling; Natural gas hot water
- Interior features: Living room; Dining room; Kitchen
Neighborhood map
What this means for you Summary
Snapshot
- This is a 4-bed/1.5-bath single-family listed at $250k.
Deal economics
- At list price, monthly cash flow is $263 ($3k/yr) — positive.
- The deal already cash-flows at list — no discount required.
- To meet the 1% rule (rent ≥ 1% of price), the offer needs to be $233k (6.7% below list).
- Recommended offer: $233k (6.7% below list) — sets the bar for 1% rule.
- Cap rate 7.6% vs local median 5.5% in Edgewood — top-decile yield for the area; either an underpriced asset or a hidden risk that comps aren't pricing in. Stress-test before assuming the spread holds.
Location & tenants
- Location reads 73/100 on livability (#118 in MD, #4,991 nationally) — a middle-class / working-renter tenant base. Strengths: commute A+, housing A+, health & safety A+; Watch: schools D, amenities D, crime F.
- Harford County Public Schools (suburban): math 22% / reading 39% proficiency, ranked #9 of 24 in MD (top 38%) — families likely to look elsewhere, expect single-tenant / working-renter base with shorter leases.
- Market conditions: Rents rising fast (+4.9%/yr); 94 active listings in the ZIP; 13 comparable units currently listed for rent nearby; rentals lingering (median 44d on market — plan ~5-8 weeks vacancy on turnover, expect pricing pressure); 54% of comp listings sitting > 30 days — soft ceiling on asking rent; solid renter incomes; 803 units permitted in Harford County in 2024 (26 in 5+ unit buildings).
- This rent runs 34% of the median local income ($82k/yr) — at the standard rent-burdened threshold; future hikes will face affordability resistance.
Forward outlook
- Local home prices are declining (-3.0%/yr); year-one equity from $2k of loan paydown is wiped out by about $7k of value loss. Plan a longer hold.
Negotiation context
- It's been on market 37 days — a 3% lower offer ($242k) is reasonable based on typical stale-listing flexibility.
- 3 sale attempts since 19y ago with the ask held roughly flat each time — persistent listings suggest the price (not the market) is what's stuck; bring a comps-based counter.
Risks & watch-outs
- Climate carrying-cost: major wind risk, 27% chance of damaging wind over 30y; extreme-heat days projected 7→15/yr by 2055 (HVAC capex compounding) — expect insurance premiums to compound above CPI over the hold.
Questions for the listing agent
- It's been on market 37 days. Have you received any prior offers? Is the seller open to a 7% concession, seller financing, or rate buy-down credit?
- Built in 1971 — when were the roof, HVAC, electrical panel, plumbing, and water heater last replaced?
- Is there a deadline driving the sale (1031 exchange, divorce, estate, relocation)? That informs how much negotiation room exists.
- Schools are D-rated, which usually means shorter tenancies and higher turnover. Who's the typical renter profile here, and what's been the actual vacancy rate?
- Crime grade is F in this area — have there been break-ins, vandalism, or insurance claims at this property in the last 3 years? What carrier currently insures it and at what premium?
- What's the average days-on-market for RENTAL listings here right now (not sales)? A rising rental-DOM trend means longer vacancies and softer asking-rent achievability than the comps imply.
- What's the recent tenant-quality profile in this submarket — average credit score on applications, eviction rate, late-payment / NSF rate, and stable-employment percentage? A property-management company in the area should have these aggregated.
- How much new for-sale + rental construction is in the pipeline within 1–3 miles? Heavy new supply typically softens prices + rents 12–24 months out; constrained supply supports both.
Investment metrics
- 1% rule
- 0.93% ✗
- Cap rate
- 7.56%
- Cash-on-cash
- 4.52%
- DSCR
- 1.20
- GRM
- 8.9
CMA / ARV
- ARV (median comp)
- $292,157
- List price
- $249,900
- Delta
- -14.46%
- Verdict
- UNDERPRICED
- Comps
- 20 within 1.0 mi
Show comp detail 12 sales within ~0.75 mi
| Address | Dist | Beds/Ba | Sqft | Sold | Price | $/sf | Match |
|---|---|---|---|---|---|---|---|
| 2506 Hanson Rd | 0.37mi | 4/2.0 | 1,404 (+0%) | 15mo | $248,000 | $177 | 68 |
| 2414A Willoughby Beach Rd | 0.33mi | 3/2.0 (-1) | 1,352 (-3%) | 11mo | $267,000 | $197 | 63 |
| 2203 Willoughby Beach Rd | 0.64mi | 3/2.0 (-1) | 1,461 (+4%) | 2mo | $318,000 | $218 | 54 |
| 606 Harbour Oak Dr | 0.61mi | 3/1.5 (-1) | 1,496 (+7%) | 2mo | $300,000 | $201 | 54 |
| 3048 Ebbtide Dr | 0.62mi | 4/2.5 | 1,496 (+7%) | 5mo | $354,900 | $237 | 52 |
| 3011 Ebbtide Dr | 0.51mi | 4/2.5 | 1,496 (+7%) | 11mo | $340,000 | $227 | 52 |
| 2029 Cherry Ct | 0.75mi | 4/2.0 | 1,449 (+4%) | 8mo | $355,000 | $245 | 50 |
| 609 Harbour Oak Dr | 0.64mi | 3/2.0 (-1) | 1,448 (+3%) | 15mo | $349,900 | $242 | 45 |
| 604 Pier Dr | 0.67mi | 3/2.0 (-1) | 1,354 (-3%) | 16mo | $315,000 | $233 | 43 |
| 3040 Ebbtide Dr | 0.58mi | 3/2.0 (-1) | 1,326 (-5%) | 17mo | $331,000 | $250 | 43 |
| 600 Harbour Oak Dr | 0.62mi | 3/1.5 (-1) | 1,496 (+7%) | 14mo | $326,500 | $218 | 43 |
| 2216 Perry Ave | 0.40mi | 3/1.0 (-1) | 1,593 (+14%) | 12mo | $325,000 | $204 | 41 |
Match score weights: distance 35% · size 25% · config 20% · recency 20%. Top-matched comps best support the ARV.
Projected returns pro-forma
-3.0% appreciation · 4.92% rent growth · sell at horizon
- IRR
- -7.3%
- Equity multiple
- 0.73×
- Total profit
- $-19,181
- Equity at exit
- $37,261
- IRR
- 4.4%
- Equity multiple
- 1.35×
- Total profit
- $24,262
- Equity at exit
- $21,607
Cash invested: $69,972 (down + closing). Projections, not guarantees.
Landlord ↔ Tenant lean methodology
- Overall (STATE)
- 27 Tenant-Leaning
- State Maryland
- 27 Tenant-Leaning · D+14
- County
- — inherits STATE
- City
- — inherits STATE
ZIP-level market 21040
- Home prices YoY
- -29.4%
- Rents YoY
- 4.9%
- Active inventory
- 94
- Price-to-rent
- 8.9×
Monthly cashflow live
- Estimated rent
- $2,331 high interval (Pro) →
- Mortgage (P&I)
- −$1,311
- Tax from tax record
- −$163 /mo · $1,960/yr
- Insurance
- −$104
- HOA
- −$0
- Vacancy / Maint / Mgmt
- −$489
- Net cashflow
- $263
Break-even live
UW: 25.0% down · 7.5% · 30yr · 1.5% tax · 5.0% vac · 8.0% maint · 8.0% mgmt
Financing live
Cash to close
- Down payment
- $62,475
- Closing costs
- $7,497
- Reserves months
- —
- Total cash needed
- —
Loan-product check · same deal, 3 products live
Conventional
25% down · 7.5% · 30yr
- Down + closing
- —
- Monthly P&I
- —
- Monthly cashflow
- —
- DSCR
- —
- Eligible?
- —
Personal DTI + credit; lowest rate.
DSCR
20% down · 8.5% · 30yr
- Down + closing
- —
- Monthly P&I
- —
- Monthly cashflow
- —
- DSCR
- —
- Eligible?
- —
No personal income docs; deal must DSCR.
Hard money
10% down · 12.0% · 12mo
- Down + closing
- —
- Monthly P&I
- —
- Monthly cashflow
- —
- DSCR
- —
- Eligible?
- —
Short-term bridge; refi at stabilization.
Rent comps 13 comps
| Address | Beds | Baths | Sqft | Rent | $/sqft | DOM | Units | Dist |
|---|---|---|---|---|---|---|---|---|
| 619 Hartwood Ln Edgewood, MD | 4.0 | 1.5 | 1716 | $2,300 | $1.34 | 43d | 1 | 0.04mi |
| 2816 Profitt Path Edgewood, MD | 4.0 | 3.0 | 1660 | $2,900 | $1.75 | 43d | 1 | 0.47mi |
| 2120 Cedar Dr Apt F Edgewood, MD | 3.0 | 1.5 | 1000 | $1,295 | $1.29 | 43d | 1 | 0.61mi |
| 313 Winterberry Dr Edgewood, MD | 3.0 | 2.5 | 1798 | $2,095 | $1.17 | 19d | 1 | 0.80mi |
| 1046 Agate Dr Unit 1 Edgewood, MD | 4.0 | 2.5 | 1440 | $2,150 | $1.49 | 17d | 1 | 0.86mi |
| 3184 Ebbtide Dr Edgewood, MD | 3.0 | 3.0 | 1224 | $2,600 | $2.12 | 20d | 1 | 0.90mi |
| 3184 Ebbtide Dr Edgewood, MD | 3.0 | 3.0 | 1224 | $2,600 | $2.12 | 43d | 1 | 0.90mi |
| 2828 Beckon Dr Edgewood, MD | 3.0 | 2.5 | 1764 | $2,300 | $1.30 | 43d | 1 | 0.96mi |
| 2842 Beckon Dr Unit 1 Edgewood, MD | 4.0 | 1.5 | 1296 | $2,100 | $1.62 | 43d | 1 | 0.98mi |
| 2033 Armstrong St Edgewood, MD | 1.0–4.0 | 1.0–2.0 | 1000 | $1,974 | $1.97 | 1d | 6 | 1.01mi |
| 705 Bayberry Rd Edgewood, MD | 3.0 | 1.5 | 1657 | $2,600 | $1.57 | 17d | 1 | 1.10mi |
| 8 Lasonia Ct Edgewood, MD | 3.0 | 3.0 | 1468 | $2,224 | $1.51 | 14d | 1 | 1.23mi |
| 1857 Simons Ct Edgewood, MD | 3.0 | 1.5 | 1240 | $1,700 | $1.37 | 43d | 1 | 1.45mi |
Listing history 18 events
-
2026-06-18days on market $249,900 Active 37 DOM
-
2026-06-17days on market $249,900 Active 36 DOM
-
2026-06-16days on market $249,900 Active 35 DOM
-
2026-06-15days on market $249,900 Active 34 DOM
-
2026-06-13days on market $249,900 Active 32 DOM
-
2026-06-09days on market $249,900 Active 28 DOM
-
2026-06-08days on market $249,900 Active 27 DOM
-
2026-06-07days on market $249,900 Active 26 DOM
-
2026-06-04days on market $249,900 Active 23 DOM
-
2026-06-03days on market $249,900 Active 22 DOM
-
2026-06-02days on market $249,900 Active 21 DOM
-
2026-06-01days on market $249,900 Active 20 DOM
-
2026-05-31days on market $249,900 Active 19 DOM
-
2026-05-12$259,900 Active 267-char remark
-
2008-12-17historical
-
2008-09-16
-
2008-07-11historical
-
2007-07-10
ⓘ Source: listings_history table (triggers on properties + properties_extension) + one-shot
backfill from property_details.listing_events for pre-trigger history.
Tax reassessment forecast MD · Partial reset (capped growth)
- Current annual tax
- $1,960 · $163/mo
- Projected year-2 tax
- $2,342 · $195/mo
- Expected delta
- +$382/yr (+$32/mo · 19.5%)
ⓘ Screening estimate from a state-policy table — verify with the county assessor before closing.
Climate risk First Street
- Flood 1/10 Low FEMA zone X (unshaded) · 0% chance over 30 yrs
- Wildfire 1/10 Low
- Heat 7/10 Severe 7 d/yr ≥104°F today · 15 d/yr by 30 yrs out
- Wind 6/10 Major 27% chance of damaging wind over 30 yrs
- Air quality 4/10 Moderate 4 unhealthy d/yr today · 6 by 30 yrs out
Nearby sold comps map
Loading sold comps map…
Walkable amenities ~0.75 mi
Loading nearby amenities…
Taxation est. · year 1
- Rental income
- $27,971
- − Mortgage interest
- −$13,998
- − Property taxes
- −$1,960
- − Insurance
- −$1,250
- − Repairs & maintenance
- −$2,238
- − Management
- −$2,238
- − Depreciation
- −$7,270
- Taxable loss
- −$982
- Est. tax savings @ 24.0%
- +$236
- After-tax cash flow
- $3,397/yr
For passive investors: Depreciation is non-cash, so a rental often shows a tax loss while cash-flowing — sheltering income. Rental losses are passive: they offset passive income freely, and up to $25,000/yr can offset ordinary (W-2) income if you actively participate and your MAGI is under $100k (phasing out to $0 by $150k); unused losses carry forward. On sale, claimed depreciation is recaptured at up to 25%, and gains may owe capital-gains tax (a 1031 exchange can defer both). Figures are a year-1 estimate at your 24.0% rate — not tax advice; consult a CPA.
Schools (NCES district)
- District
- Harford County Public Schools
- NCES district ID
- 2400390
- Math proficiency
- 22% ▼ -23.00%
- Reading proficiency
- 39% ▼ -12.00%
- Median HH income
- $79,569
- Composite
- 29.38/100
- National rank
- #6527
- State rank
- #9 of 24 in MD
Livability — Edgewood
- Score
- 73/100
- State rank
- #118
- US rank
- #4991
Category grades
Schools grade is shown separately in the Schools card above.
Census & demographics
- Census place
- Edgewood, MD
- County
- Harford County · 198,512 people
- City population
- 24,960
- Metro
- Baltimore-Columbia-Towson, MD
- Population (ZIP)
- 24,960
- Household income
- $81,704
- Rent vs Own
- Severe rent burden
- 859.0
Population outlook (Harford County) Hauer SSP2
- Today (2025)
- 262,292 people
- By 2030
- 266,437 · +1.6%
- By 2040
- 269,954 · +2.9%
- By 2050
- 265,659 · +1.3%
- By 2075
- 252,886 · -3.6%
- By 2100
- 224,014 · -14.6%
Race, ethnicity, and origin ACS 2023
- Neighborhood character
- Diverse neighborhood (Simpson 0.66)
- Race & ethnicity
- Black 45% White 36% Two or more races 11% Hispanic / Latino 10% Asian 2%
- Hispanic origin (detail)
- Mexican 1% Puerto Rican 2%
- Common ancestry
- Romanian 4% Slovak 1% Italian 1%
- Foreign-born
- 8% · Canada, South Korea
- Languages at home
- 89% English-only · Spanish 5% Russian/Polish/Slavic 2% German/W. Germanic 1%
Political lean MEDSL · Harford
- 2024 margin
- R (+13.8) · D 41.9% · R 55.7% · Other 2.4%
- 2008→2024 swing
- +5.0pp toward D · 2008: -18.8pp · 2024: -13.8pp
- All cycles
- 2024: R+13.8 2020: R+12.0 2016: R+24.5 2012: R+19.5 2008: R+18.8
Not yet ingested
- Civics
- —
Market trends
- HPI YoY
- ▼ -106.14%
- Current HPI
- 254.2305
- Rent YoY
- ▲ 4.92%
- Metro
- Baltimore-Columbia-Towson, MD
- State GDP YoY
- ▲ 2.97%
- F500 in state
- 12
Industry mix (Fortune 500 HQ in MD)
| Industry | F500 HQs | Revenue |
|---|---|---|
| Aerospace / Defense | 1 | $71B |
|
||
| Utilities | 1 | $25B |
|
||
| Hotels | 1 | $24B |
|
||
| Consumer Goods | 1 | $7B |
|
||
| Real Estate | 1 | $6B |
|
||
| Chemicals | 1 | $2B |
|
||
Price history
-3.8% since first listed6 events — show timeline
- 2026-05-21 Price Changed $249,900 BRIGHT MLS
- 2026-05-12 Listed $259,900 BRIGHT MLS
- 2008-12-17 Delisted — MRIS
- 2008-09-16 Listed — MRIS
- 2008-07-11 Delisted — MRIS
- 2007-07-10 Listed — MRIS
Property tax history
+0.6%/yrLatest (2025): $1,960 · +28.0% YoY. Source: county tax records.
Cash-flow waterfall
monthlySold comps — $/sqft
last 12 mo · ≤1 miLoading sold comps…