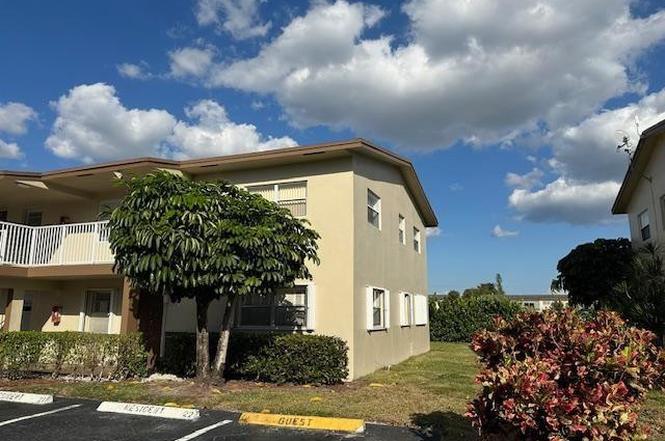
600 NW 77th Ave #208 · Margate, FL
Flood risk 1/10 · Minimal
- FEMA flood zone
- X (shaded)
- Chance of flooding over 30 yrs
- 0.0%
- Est. flood insurance / yr
- $507 – $1,088
Fire risk 1/10 · Minimal
- Est. fire insurance / yr
- $947 – $1,759
Heat risk 10/10 · Severe
- Hot days now (above 106°F)
- 7 days/yr
- Hot days in 30 yrs
- 27 days/yr
Wind risk 10/10 · Severe
- Chance of severe wind over 30 yrs
- 99.0%
Air-quality risk 3/10 · Minor
- Unhealthy air days now
- 3 days/yr
- Unhealthy air days in 30 yrs
- 3 days/yr
Risk factors via First Street. Map © Google.
Why this score? — see what drove the C- grade
The composite is a weighted blend of 9 inputs, each scored 0–100. Each bar is that input's sub-score; the figure is the points it added to the 100-point composite (weight × sub-score).
- Cash flow +17.7/30.0
- 1% rule +10.0/10.0
- ARV discount +7.5/15.0
- DSCR +5.5/10.0
- Schools +4.1/10.0
- Livability +4.0/5.0
- Rent growth +3.0/5.0
- Condition / age +2.5/5.0
- Appreciation +0.0/10.0
$104,900
🖨 Deal sheet 📄 Offer letter ✓ Due diligence
Listing remarks
ABSOLUTELY BEAUTIFUL, WELL KEEP TWO BEDROOM, TWO BATH, HIGHLY DESIRABLE CORNER UNIT IN ORIOLE GARDENS SECTION TWO. UPDATED KITCHEN, GORGEOUS DIAMOND SHAPE TILE IN LIVING ROOM AND DINING AREA. BALCONY HAS BEEN OPENED FOR EXTRA LIVING SPACE. PADDLE FANS. IDEALLY SITUATED CLOSE TO THE CLUBHOUSE AND POOLS. CLUBHOUSE HAS BILLIARDS, CARD ROOM, LIBRARY, EXERCISE ROOM, LARGE AUDITORIUM, AND FULL KITCHEN. ASSOCIATION STATES 55+, REQUIRES $25000 - $30000 INCOME, 700+ CREDIT SCORE. 20% DOWN IF FINANCING, HOWEVER MOST LENDERS REQUIRE 25%, SECURITY DEPOSIT, IN PERSON INTERVIEW. CLOSE TO SHOPPING/MALL, BANKS, WALGREENS, PUBLIX, RESTAURANTS, AND SHORT DRIVE TO THE BEACH. TOWNHOMES BEING BUILT ON THE LAND
Key facts
- Diamond shape tile
- Extra living space
- Close to pools
Tags
Property features AI
Finance
- HOA & community: Association with community amenities including billiard room, clubhouse, fitness center, picnic area, pool, community room, kitchen facilities and library; Quarterly HOA fee; HOA covers grounds & structure maintenance, pest control, sewer, trash, water, common areas, recreation facility and pool service; Part of a 560-unit community; Senior community
Exterior
- Parking: Assigned parking; Guest parking
- Utilities: Cable available
- Home design: Condominium; Resale property; 2 stories; Entry on second level; Faces west
- Construction: Built with CBS construction
- Exterior features: Second-floor entry; Foyer entry; Not waterfront
Interior
- Kitchen: Disposal; Electric range; Refrigerator
- Bedrooms: 2 bedrooms on the main level
- Flooring: Carpet; Tile
- Bathrooms: 2 full bathrooms
- Heating & cooling: Central heating (electric); Central air conditioning; Ceiling fans
- Interior features: Entrance foyer
Neighborhood map
What this means for you Summary
Snapshot
- This is a 2-bed/2.0-bath condo listed at $105k.
Deal economics
- At list price, monthly cash flow is $84 ($1k/yr) — positive.
- The deal already cash-flows at list — no discount required.
- Meets the 1% rule at list price ($2k rent vs $105k).
- Recommended offer: $95k (9.0% below list) — sets the bar for market timing.
- Cap rate 7.3% vs local median 4.3% in Margate — top-decile yield for the area; either an underpriced asset or a hidden risk that comps aren't pricing in. Stress-test before assuming the spread holds.
Location & tenants
- Location reads 81/100 on livability (#85 in FL, #1,398 nationally) — a professional / high-income tenant draw. Strengths: commute A+, housing A+, health & safety A+; Watch: amenities F.
- Broward (suburban): math 42% / reading 53% proficiency, ranked #46 of 73 in FL (top 63%) — families likely to look elsewhere, expect single-tenant / working-renter base with shorter leases.
- Market conditions: Rents rising (+1.9%/yr); 548 active listings in the ZIP; 40 comparable units currently listed for rent nearby; rentals at typical pace (median 25d on market — plan ~3-4 weeks tenant-placement turnaround); 2,111 units permitted in Broward County in 2024 (1,265 in 5+ unit buildings).
- This rent runs 33% of the median local income ($63k/yr) — at the standard rent-burdened threshold; future hikes will face affordability resistance.
Forward outlook
- Local home prices are declining (-3.0%/yr); year-one equity from $725 of loan paydown is wiped out by about $3k of value loss. Plan a longer hold.
- Broward County population projected at +34% by 2050 — long-run rental-demand tailwind backs the buy-and-hold thesis.
Negotiation context
- It's been on market 99 days — a 9% lower offer ($95k) is reasonable based on typical stale-listing flexibility.
- 2 sale attempts since 2y ago with the ask held roughly flat each time — persistent listings suggest the price (not the market) is what's stuck; bring a comps-based counter.
- Current owner paid $60k; list at $105k implies a 75% gain — meaningful room to come down on a strong offer.
Risks & watch-outs
- Watch-outs: HOA is 28% of rent.
- Climate carrying-cost: severe wind risk, 99% chance of damaging wind over 30y; extreme-heat days projected 7→27/yr by 2055 (HVAC capex compounding) — expect insurance premiums to compound above CPI over the hold.
Questions for the listing agent
- It's been on market 99 days. Have you received any prior offers? Is the seller open to a 9% concession, seller financing, or rate buy-down credit?
- Built in 1974 — when were the roof, HVAC, electrical panel, plumbing, and water heater last replaced?
- What does the HOA fee cover, when was the last increase, and are there any pending special assessments or reserve-fund shortfalls?
- Any open or pending special assessments — roof, HVAC, plumbing, elevator, façade? What's the per-unit balance and payoff schedule, and is the seller paying it off at close or rolling it to the buyer?
- Why hasn't it sold? Are there any deal-killer items the seller is aware of (foundation, flood, title, zoning, code violations)?
- Is there a deadline driving the sale (1031 exchange, divorce, estate, relocation)? That informs how much negotiation room exists.
- What's the average days-on-market for RENTAL listings here right now (not sales)? A rising rental-DOM trend means longer vacancies and softer asking-rent achievability than the comps imply.
- What's the recent tenant-quality profile in this submarket — average credit score on applications, eviction rate, late-payment / NSF rate, and stable-employment percentage? A property-management company in the area should have these aggregated.
- How much new apartment / multifamily construction is in the pipeline within 1–3 miles? Heavy new supply (>2% of stock underway) typically softens rents 12–24 months out; light construction supports rent growth.
Investment metrics
- 1% rule
- 1.66% ✓
- Cap rate
- 7.25%
- Cash-on-cash
- 3.42%
- DSCR
- 1.15
- GRM
- 5.0
CMA / ARV
No comps found within radius.
Projected returns pro-forma
-3.0% appreciation · 1.94% rent growth · sell at horizon
- IRR
- -12.6%
- Equity multiple
- 0.55×
- Total profit
- $-13,132
- Equity at exit
- $15,641
- IRR
- -5.9%
- Equity multiple
- 0.64×
- Total profit
- $-10,438
- Equity at exit
- $9,070
Cash invested: $29,372 (down + closing). Projections, not guarantees.
Landlord ↔ Tenant lean methodology
- Overall (STATE)
- 87 Strongly Landlord-Friendly
- State Florida
- 87 Strongly Landlord-Friendly · R+3
- County
- — inherits STATE
- City
- — inherits STATE
ZIP-level market 33063
- Home prices YoY
- -18.1%
- Rents YoY
- 1.9%
- Active inventory
- 548
- Price-to-rent
- 5.0×
Monthly cashflow live
- Estimated rent
- $1,745 high interval (Pro) →
- Mortgage (P&I)
- −$550
- Tax from tax record
- −$206 /mo · $2,468/yr
- Insurance
- −$44
- HOA
- −$495
- Vacancy / Maint / Mgmt
- −$366
- Net cashflow
- $84
Break-even live
UW: 25.0% down · 7.5% · 30yr · 1.5% tax · 5.0% vac · 8.0% maint · 8.0% mgmt
Financing live
Cash to close
- Down payment
- $26,225
- Closing costs
- $3,147
- Reserves months
- —
- Total cash needed
- —
Loan-product check · same deal, 3 products live
Conventional
25% down · 7.5% · 30yr
- Down + closing
- —
- Monthly P&I
- —
- Monthly cashflow
- —
- DSCR
- —
- Eligible?
- —
Personal DTI + credit; lowest rate.
DSCR
20% down · 8.5% · 30yr
- Down + closing
- —
- Monthly P&I
- —
- Monthly cashflow
- —
- DSCR
- —
- Eligible?
- —
No personal income docs; deal must DSCR.
Hard money
10% down · 12.0% · 12mo
- Down + closing
- —
- Monthly P&I
- —
- Monthly cashflow
- —
- DSCR
- —
- Eligible?
- —
Short-term bridge; refi at stabilization.
Rent comps 40 comps
| Address | Beds | Baths | Sqft | Rent | $/sqft | DOM | Units | Dist |
|---|---|---|---|---|---|---|---|---|
| 7600 NW 4th Pl #207 Margate, FL | 2.0 | 2.0 | 990 | $1,700 | $1.72 | 24d | 1 | 0.17mi |
| 7605 NW 5th Pl #106 Margate, FL | 2.0 | 2.0 | 990 | $1,500 | $1.52 | 24d | 1 | 0.17mi |
| 7605 NW 5th Ct #204 Margate, FL | 1.0 | 1.0 | 670 | $1,350 | $2.01 | 24d | 1 | 0.17mi |
| 7600 NW 5th Pl #106 Margate, FL | 2.0 | 2.0 | 990 | $1,600 | $1.62 | 24d | 1 | 0.17mi |
| 7500 NW 5th Pl #204 Margate, FL | 1.0 | 1.0 | 670 | $1,400 | $2.09 | 24d | 1 | 0.22mi |
| 7500 NW 5th Pl #204 Margate, FL | 1.0 | 1.0 | 670 | $1,400 | $2.09 | 17d | 1 | 0.22mi |
| 7500 NW 4th Pl Margate, FL | 2.0 | 2.0 | 990 | $1,850 | $1.87 | 3d | 1 | 0.23mi |
| 7500 NW 4th Pl Margate, FL | 2.0 | 2.0 | 990 | $1,850 | $1.87 | 24d | 1 | 0.23mi |
| 480 NW 76th Ave #105 Margate, FL | 1.0 | 2.0 | 960 | $1,500 | $1.56 | 24d | 1 | 0.24mi |
| 1005 Country Club Dr Margate, FL | 2.0 | 2.0 | 925 | $1,475 | $1.59 | 22d | 2 | 0.27mi |
| 370 NW 76th Ave #202 Margate, FL | 2.0 | 2.0 | 1100 | $1,950 | $1.77 | 11d | 1 | 0.29mi |
| 1010 Country Club Dr #206 Margate, FL | 1.0 | 1.5 | 775 | $1,450 | $1.87 | 24d | 1 | 0.30mi |
| 1025 Country Club Dr #302 Margate, FL | 2.0 | 2.0 | 920 | $1,475 | $1.60 | 24d | 1 | 0.32mi |
| 260 NW 76th Ave #404 Margate, FL | 1.0 | 2.0 | 960 | $1,500 | $1.56 | 24d | 1 | 0.34mi |
| 260 NW 76th Ave #406 Margate, FL | 2.0 | 2.0 | 1100 | $1,700 | $1.55 | 24d | 1 | 0.34mi |
| 7897 Golf Circle Dr #108 Margate, FL | 1.0 | 1.5 | 775 | $1,450 | $1.87 | 17d | 1 | 0.34mi |
| 1030 Country Club Dr #401 Margate, FL | 2.0 | 2.0 | 930 | $1,450 | $1.56 | 18d | 1 | 0.36mi |
| 1030 Country Club Dr #401 Margate, FL | 2.0 | 2.0 | 930 | $1,450 | $1.56 | 4d | 1 | 0.36mi |
| 1030 Country Club Dr #309 Margate, FL | 2.0 | 2.0 | 1038 | $1,450 | $1.40 | 24d | 1 | 0.36mi |
| 7305 NW 5th Pl #206 Margate, FL | 2.0 | 2.0 | 990 | $1,650 | $1.67 | 24d | 1 | 0.36mi |
| 7300 NW 4th Pl #101 Margate, FL | 2.0 | 2.0 | 990 | $1,400 | $1.41 | 20d | 1 | 0.36mi |
| 7305 NW 5th Ct #204 Margate, FL | 1.0 | 1.0 | 670 | $1,375 | $2.05 | 24d | 1 | 0.37mi |
| 1035 Country Club Dr Margate, FL | 1.0–2.0 | 1.0–2.0 | 925 | $1,499 | $1.62 | 24d | 2 | 0.38mi |
| 7300 Lake Circle Dr #107 Margate, FL | 2.0 | 2.0 | 1100 | $1,850 | $1.68 | 14d | 1 | 0.38mi |
| 7205 W Atlantic Blvd #101 Margate, FL | 2.0 | 2.0 | 990 | $1,500 | $1.52 | 24d | 1 | 0.40mi |
| 7897 Golf Circle Dr Margate, FL | 1.0–2.0 | 1.0–1.5 | 757 | $1,450 | $1.92 | 5d | 2 | 0.40mi |
| 1020 NW 80th Ave #203 Margate, FL | 2.0 | 2.0 | 1000 | $1,900 | $1.90 | 2d | 1 | 0.44mi |
| 1020 NW 80th Ave #203 Margate, FL | 2.0 | 2.0 | 1000 | $1,900 | $1.90 | 12d | 1 | 0.44mi |
| 7431 NW 1st St Margate, FL | 2.0 | 2.0 | 1100 | $1,900 | $1.73 | 24d | 1 | 0.49mi |
| 1045 NW 73rd Ave Margate, FL | 2.0 | 1.0 | 1036 | $2,500 | $2.41 | 24d | 1 | 0.51mi |
| 7797 Golf Circle Dr Margate, FL | 1.0–2.0 | 1.0–2.0 | 834 | $1,800 | $2.16 | 4d | 2 | 0.52mi |
| 7797 Golf Circle Dr #310 Margate, FL | 2.0 | 2.0 | 930 | $1,800 | $1.94 | 24d | 1 | 0.52mi |
| 1010 NW 72nd Ter Margate, FL | 2.0 | 1.5 | 1061 | $2,200 | $2.07 | 7d | 1 | 0.53mi |
| 1010 NW 72nd Ter Margate, FL | 2.0 | 1.5 | 1061 | $2,250 | $2.12 | 17d | 1 | 0.53mi |
| 7561 NW 1st St #204 Margate, FL | 1.0 | 2.0 | 960 | $1,750 | $1.82 | 5d | 1 | 0.54mi |
| 357 N Rock Island Rd #207 Margate, FL | 2.0 | 2.0 | 1100 | $1,720 | $1.56 | 24d | 1 | 0.55mi |
| 357 N Rock Island Rd #407 Margate, FL | 2.0 | 2.0 | 1100 | $1,700 | $1.55 | 3d | 1 | 0.55mi |
| 357 N Rock Island Rd #207 Margate, FL | 2.0 | 2.0 | 1100 | $1,720 | $1.56 | 10d | 1 | 0.55mi |
| 7807 Golf Circle Dr Margate, FL | 1.0 | 1.0–1.5 | 757 | $1,525 | $2.01 | 20d | 4 | 0.59mi |
| 7807 Golf Circle Dr Margate, FL | 1.0 | 1.0–1.5 | 749 | $1,575 | $2.10 | 17d | 2 | 0.59mi |
HOA detail condo
- Monthly dues
- $495 · $5,940/yr
- Likely covers
- poolsecurity
- Assessments
- None detected in remarks — confirm with the listing agent.
Listing history 20 events
-
2026-06-18days on market $104,900 Active 99 DOM
-
2026-06-17days on market $104,900 Active 98 DOM
-
2026-06-16days on market $104,900 Active 97 DOM
-
2026-06-15days on market $104,900 Active 96 DOM
-
2026-06-13days on market $104,900 Active 94 DOM
-
2026-06-09days on market $104,900 Active 90 DOM
-
2026-06-07days on market $104,900 Active 88 DOM
-
2026-06-04days on market $104,900 Active 85 DOM
-
2026-06-03days on market $104,900 Active 84 DOM
-
2026-06-02days on market $104,900 Active 83 DOM
-
2026-06-01days on market $104,900 Active 82 DOM
-
2026-05-31days on market $104,900 Active 81 DOM
-
2026-05-22price $104,900
-
2026-05-20status Active
-
2026-05-16historical Active Under Contract
-
2024-02-22$109,900 Active
-
2017-01-13soldstatus $60,000
-
2014-01-31soldstatus $37,100
-
2000-01-19soldstatus $31,800
-
1974-08-01soldstatus $24,800
ⓘ Source: listings_history table (triggers on properties + properties_extension) + one-shot
backfill from property_details.listing_events for pre-trigger history.
Tax reassessment forecast FL · Resets to sale price
- Current annual tax
- $2,468 · $206/mo
- Projected year-2 tax
- $2,468 · $206/mo
- Expected delta
- $0/yr ($0/mo · 0.0%)
ⓘ Screening estimate from a state-policy table — verify with the county assessor before closing.
Climate risk First Street
- Flood 1/10 Low FEMA zone X (shaded) · 0% chance over 30 yrs
- Wildfire 1/10 Low
- Heat 10/10 Extreme 7 d/yr ≥106°F today · 27 d/yr by 30 yrs out
- Wind 10/10 Extreme 99% chance of damaging wind over 30 yrs
- Air quality 3/10 Moderate 3 unhealthy d/yr today · 3 by 30 yrs out
Nearby sold comps map
Loading sold comps map…
Walkable amenities ~0.75 mi
Loading nearby amenities…
Taxation est. · year 1
- Rental income
- $20,934
- − Mortgage interest
- −$5,876
- − Property taxes
- −$2,468
- − Insurance
- −$524
- − Repairs & maintenance
- −$1,675
- − Management
- −$1,675
- − HOA
- −$5,940
- − Depreciation
- −$3,052
- Taxable loss
- −$275
- Est. tax savings @ 24.0%
- +$66
- After-tax cash flow
- $1,070/yr
For passive investors: Depreciation is non-cash, so a rental often shows a tax loss while cash-flowing — sheltering income. Rental losses are passive: they offset passive income freely, and up to $25,000/yr can offset ordinary (W-2) income if you actively participate and your MAGI is under $100k (phasing out to $0 by $150k); unused losses carry forward. On sale, claimed depreciation is recaptured at up to 25%, and gains may owe capital-gains tax (a 1031 exchange can defer both). Figures are a year-1 estimate at your 24.0% rate — not tax advice; consult a CPA.
Schools (NCES district)
- District
- Broward
- NCES district ID
- 1200180
- Math proficiency
- 42% ▼ -18.00%
- Reading proficiency
- 53% ▼ -5.00%
- Median HH income
- $52,139
- Composite
- 40.88/100
- National rank
- #3621
- State rank
- #46 of 73 in FL
Livability — Margate
- Score
- 81/100
- State rank
- #85
- US rank
- #1398
Category grades
Schools grade is shown separately in the Schools card above.
Census & demographics
- Census place
- Margate, FL
- County
- Broward County · 1,963,430 people
- City population
- 55,466
- Metro
- Miami-Fort Lauderdale-Pompano Beach, FL
- Population (ZIP)
- 55,466
- Household income
- $62,918
- Rent vs Own
- Severe rent burden
- 2290.0
Population outlook (Broward County) Hauer SSP2
- Today (2025)
- 2,207,033 people
- By 2030
- 2,360,704 · +7.0%
- By 2040
- 2,661,208 · +20.6%
- By 2050
- 2,946,698 · +33.5%
- By 2075
- 3,602,273 · +63.2%
- By 2100
- 3,970,984 · +79.9%
Race, ethnicity, and origin ACS 2023
- Neighborhood character
- Highly diverse neighborhood (Simpson 0.72)
- Race & ethnicity
- White 34% Hispanic / Latino 29% Black 28% Two or more races 18% Asian 4%
- Hispanic origin (detail)
- Mexican 2% Puerto Rican 7% Cuban 3% Dominican 3%
- Common ancestry
- Hispanic 6% Romanian 2% Estonian 2%
- Foreign-born
- 36% · Canada, Jamaica, Vietnam
- Languages at home
- 61% English-only · Spanish 24% French/Haitian/Cajun 7% Other Indo-European 4%
Political lean MEDSL · Broward
- 2024 margin
- D (+17.0) · D 58.0% · R 41.0%
- 2008→2024 swing
- -17.8pp toward R · 2008: 34.7pp · 2024: 17.0pp
- All cycles
- 2024: D+17.0 2020: D+29.8 2016: D+35.0 2012: D+34.9 2008: D+34.7
Not yet ingested
- Civics
- —
Market trends
- HPI YoY
- ▼ -87.17%
- Current HPI
- 393.9225
- Rent YoY
- ▲ 1.94%
- Metro
- Miami-Fort Lauderdale-Pompano Beach, FL
- State GDP YoY
- ▲ 3.28%
- F500 in state
- 36
Industry mix (Fortune 500 HQ in FL)
| Industry | F500 HQs | Revenue |
|---|---|---|
| Industrial Technology | 2 | $29B |
|
||
| Insurance | 2 | $17B |
|
||
| Retail | 1 | $60B |
|
||
| Technology Distribution | 1 | $58B |
|
||
| Homebuilding | 1 | $35B |
|
||
| Technology Manufacturing | 1 | $35B |
|
||
Price history
+323.0% since first listed8 events — show timeline
- 2026-05-22 Price Changed $104,900 Beaches MLS
- 2026-05-20 Relisted — Beaches MLS
- 2026-05-16 Contingent — Beaches MLS
- 2024-02-22 Listed $109,900 Beaches MLS
- 2017-01-13 Sold (Public Records) $60,000 Public Records
- 2014-01-31 Sold (Public Records) $37,100 Public Records
- 2000-01-19 Sold (Public Records) $31,800 Public Records
- 1974-08-01 Sold (Public Records) $24,800 Public Records
Property tax history
+18.7%/yrLatest (2025): $2,468 · +3.9% YoY. Source: county tax records.
Cash-flow waterfall
monthlySold comps — $/sqft
last 12 mo · ≤1 miLoading sold comps…