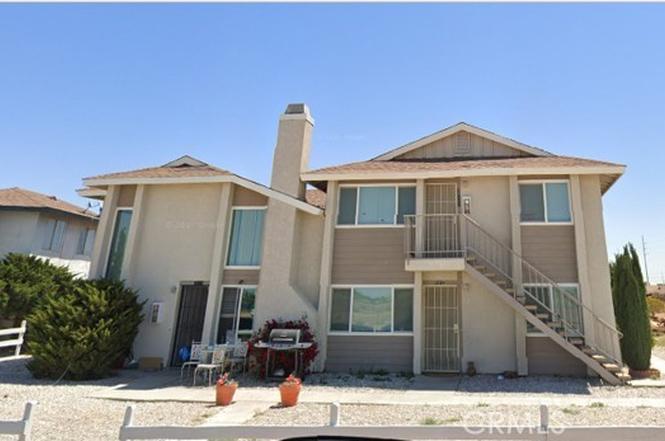
 Fourplex
18117 Poinciana · Adelanto, CA
Flood risk 1/10 · Minimal
- FEMA flood zone
- X (shaded)
- Chance of flooding over 30 yrs
- 0.0%
- Est. flood insurance / yr
- $507 – $1,088
Fire risk 4/10 · Minor
- Est. fire insurance / yr
- $659 – $1,223
Heat risk 7/10 · Major
- Hot days now (above 99°F)
- 6 days/yr
- Hot days in 30 yrs
- 15 days/yr
Wind risk 1/10 · Minimal
- Chance of severe wind over 30 yrs
- —
Air-quality risk 8/10 · Major
- Unhealthy air days now
- 16 days/yr
- Unhealthy air days in 30 yrs
- 20 days/yr
Risk factors via First Street. Map © Google.
Why this score? — see what drove the C- grade
The composite is a weighted blend of 9 inputs, each scored 0–100. Each bar is that input's sub-score; the figure is the points it added to the 100-point composite (weight × sub-score).
- Cash flow +18.6/30.0
- Appreciation +10.0/10.0
- DSCR +5.9/10.0
- ARV discount +5.7/15.0
- 1% rule +3.7/10.0
- Rent growth +3.7/5.0
- Condition / age +2.5/5.0
- Livability +2.4/5.0
- Schools +2.2/10.0
$725,000
🖨 Deal sheet 📄 Offer letter ✓ Due diligence
Multi-family units
County records classify this as Multi-Family (2-4 Unit). Listing-text estimate: 4 units. confirmed
Listing remarks MLS
Great investment opportunity! Fourplex in Adelanto features a two story, 3 bedroom 2 bath with fireplace in living room, two 2 bedroom, 2 bath units and one 1 bedroom, 1 bath unit. Fresh paint and carpet in all units! Laundry room in common area. Purchase this property for as little as 3% down! This property is approved for HomePath Mortgage and HomePath Renovation Mortgage Financing.
Key facts
- 8,658 sq ft lot
- 4 garage spots
- Built 1983
Tags
Property features AI
Finance
- Other: No ADU
- Financial info: Total building area: 3,576; 4 total units; Gross scheduled income: $66,720; Gross income: $66,720; Net operating income: $46,704; Operating expenses: $20,016 (includes $3,000 trash, $2,500 insurance, $1,920 water/sewer); Operating expense percent listed as 25
- HOA & community: Community features include biking; Property is subject to rent control
Exterior
- Parking: 4 total parking spaces; Each unit includes 1 garage space (4 garages total)
- Utilities: Public (district) water; Septic (type unknown) sewer; 4 separate gas meters; 4 separate electric meters; 1 separate water meter
- Home design: Attached community apartment; Single-story; Rectangular lot, level with street
- Construction: One building
- Exterior features: No pool; Front yard
Interior
- Bedrooms: Unit A: 1 bedroom; Unit B: 3 bedrooms; Unit C: 2 bedrooms; Unit D: 2 bedrooms
- Bathrooms: Unit A: 1 full bath; Unit B: 2 full baths; Unit C: 1 full bath; Unit D: 1 full bath
- Interior features: Front entry; Entry level: 1
- Laundry & utility: On-site laundry area
Neighborhood map
What this means for you Summary
Snapshot
- This is a 4 × 2-bed/1.2-bath units multifamily listed at $725k.
Deal economics
- At list price, monthly cash flow is $707 ($8k/yr) — positive. Per door: $177/mo.
- The deal already cash-flows at list — no discount required.
- To meet the 1% rule (rent ≥ 1% of price), the offer needs to be $633k (12.7% below list).
- Recommended offer: $633k (12.7% below list) — sets the bar for 1% rule.
- Cap rate 7.5% vs local median 4.2% in Adelanto — top-decile yield for the area; either an underpriced asset or a hidden risk that comps aren't pricing in. Stress-test before assuming the spread holds.
Location & tenants
- Location reads 47/100 on livability (#1,250 in CA) — a working-class tenant base; expect higher turnover. Strengths: housing A+; Watch: crime D, schools F, amenities F.
- Victor Valley Union High (urban): math 25% / reading 25% proficiency, ranked #407 of 517 in CA (top 79%) — low school quality limits family demand, transient renter base, plan for 1-2y turnover; 72% free/reduced lunch — lower-income household profile, screen leases tightly.
- Market conditions: Rents rising fast (+4.7%/yr); 615 active listings in the ZIP; 5,458 units permitted in San Bernardino County in 2024 (1,500 in 5+ unit buildings).
- At $6,329/mo this rent would consume 111% of the median local household income ($69k/yr) (locally 1345% of renters already pay >50% of income on rent) — very limited rent-growth headroom before tenants either downsize or default.
Forward outlook
- In year one you build about $78k of equity ($5k loan paydown + $72k appreciation (10.0% local appreciation)).
- San Bernardino County population projected at +15% by 2050 — modest demand growth; plan on rents tracking national, not racing it.
- At projected returns (10.0% appreciation + 4.7% rent growth), your $203k cash investment doubles in ~3 years — after that, you're playing with house money.
- By year 2, paydown + projected appreciation supports a ~$125k cash-out refi (75% LTV) — recoverable capital for the next deal without selling this one.
Negotiation context
- It's been on market 106 days — a 9% lower offer ($660k) is reasonable based on typical stale-listing flexibility.
- 3 sale attempts since 24y ago with the ask held roughly flat each time — persistent listings suggest the price (not the market) is what's stuck; bring a comps-based counter.
- Current owner paid $132k; list at $725k implies a 448% gain — meaningful room to come down on a strong offer.
Risks & watch-outs
- Climate carrying-cost: extreme-heat days projected 6→15/yr by 2055 (HVAC capex compounding) — expect insurance premiums to compound above CPI over the hold.
Questions for the listing agent
- It's been on market 106 days. Have you received any prior offers? Is the seller open to a 13% concession, seller financing, or rate buy-down credit?
- Can we see the unit-by-unit rent roll, current vacancy, and any below-market leases? What's the average tenancy length?
- What capital expenditures (roof, boiler, parking lot, exteriors) have been made in the last 5 years, and what's planned in the next 2?
- Why hasn't it sold? Are there any deal-killer items the seller is aware of (foundation, flood, title, zoning, code violations)?
- Is there a deadline driving the sale (1031 exchange, divorce, estate, relocation)? That informs how much negotiation room exists.
- Schools are F-rated, which usually means shorter tenancies and higher turnover. Who's the typical renter profile here, and what's been the actual vacancy rate?
- Crime grade is D in this area — have there been break-ins, vandalism, or insurance claims at this property in the last 3 years? What carrier currently insures it and at what premium?
- What's the average days-on-market for RENTAL listings here right now (not sales)? A rising rental-DOM trend means longer vacancies and softer asking-rent achievability than the comps imply.
- What's the recent tenant-quality profile in this submarket — average credit score on applications, eviction rate, late-payment / NSF rate, and stable-employment percentage? A property-management company in the area should have these aggregated.
- How much new apartment / multifamily construction is in the pipeline within 1–3 miles? Heavy new supply (>2% of stock underway) typically softens rents 12–24 months out; light construction supports rent growth.
Investment metrics
- 1% rule
- 0.87% ✗
- Cap rate
- 7.46%
- Cash-on-cash
- 4.18%
- DSCR
- 1.19
- GRM
- 9.5
CMA / ARV
- ARV (on-the-fly)
- $697,320
- Comps found
- 3
Show comp detail 3 sales within ~0.75 mi
| Address | Dist | Beds/Ba | Sqft | Sold | Price | $/sf | Match |
|---|---|---|---|---|---|---|---|
| 18140 Poinciana Rd | 0.05mi | 8/5.0 | 3,338 (-7%) | 6mo | $650,000 | $195 | 80 |
| 18202 Casaba Rd | 0.15mi | 8/6.0 | 3,312 (-7%) | 24mo | $570,000 | $172 | 56 |
| 10943 Aztec Ln | 0.19mi | 8/4.0 | 3,224 (-10%) | 19mo | $643,500 | $200 | 56 |
Match score weights: distance 35% · size 25% · config 20% · recency 20%. Top-matched comps best support the ARV.
Projected returns pro-forma
10.0% appreciation · 4.68% rent growth · sell at horizon
- IRR
- 27.8%
- Equity multiple
- 3.22×
- Total profit
- $450,416
- Equity at exit
- $653,137
- IRR
- 24.7%
- Equity multiple
- 7.47×
- Total profit
- $1,313,934
- Equity at exit
- $1,408,516
Cash invested: $203,000 (down + closing). Projections, not guarantees.
Landlord ↔ Tenant lean methodology
- Overall (STATE)
- 18 Strongly Tenant-Friendly
- State California
- 18 Strongly Tenant-Friendly · D+13
- County
- — inherits STATE
- City
- — inherits STATE
ZIP-level market 92301
- Home prices YoY
- 10.0%
- Rents YoY
- 4.7%
- Active inventory
- 615
- Price-to-rent
- 38.2×
Monthly cashflow live
- Estimated rent
- $6,329 high interval (Pro) →
- Mortgage (P&I)
- −$3,802
- Tax from tax record
- −$189 /mo · $2,266/yr
- Insurance
- −$302
- HOA
- −$0
- Vacancy / Maint / Mgmt
- −$1,329
- Net cashflow
- $707
Break-even live
4-unit breakdown (identical units grouped — click to expand)
| Units | Beds | Baths | Est. rent |
|---|---|---|---|
| 4× units | 2 | 1.2 | $6,328 |
| #1 | 2 | 1.2 | $1,582 |
| #2 | 2 | 1.2 | $1,582 |
| #3 | 2 | 1.2 | $1,582 |
| #4 | 2 | 1.2 | $1,582 |
| Total (4 units) | $6,329 | ||
UW: 25.0% down · 7.5% · 30yr · 1.5% tax · 5.0% vac · 8.0% maint · 8.0% mgmt
Financing live
Cash to close
- Down payment
- $181,250
- Closing costs
- $21,750
- Reserves months
- —
- Total cash needed
- —
Loan-product check · same deal, 3 products live
Conventional
25% down · 7.5% · 30yr
- Down + closing
- —
- Monthly P&I
- —
- Monthly cashflow
- —
- DSCR
- —
- Eligible?
- —
Personal DTI + credit; lowest rate.
DSCR
20% down · 8.5% · 30yr
- Down + closing
- —
- Monthly P&I
- —
- Monthly cashflow
- —
- DSCR
- —
- Eligible?
- —
No personal income docs; deal must DSCR.
Hard money
10% down · 12.0% · 12mo
- Down + closing
- —
- Monthly P&I
- —
- Monthly cashflow
- —
- DSCR
- —
- Eligible?
- —
Short-term bridge; refi at stabilization.
Listing history 22 events
-
2026-06-18days on market $725,000 Active 106 DOM
-
2026-06-17days on market $725,000 Active 105 DOM
-
2026-06-16days on market $725,000 Active 104 DOM
-
2026-06-15days on market $725,000 Active 103 DOM
-
2026-06-13days on market $725,000 Active 101 DOM
-
2026-06-09days on market $725,000 Active 97 DOM
-
2026-06-08days on market $725,000 Active 96 DOM
-
2026-06-07days on market $725,000 Active 95 DOM
-
2026-06-04days on market $725,000 Active 92 DOM
-
2026-06-03days on market $725,000 Active 91 DOM
-
2026-06-02days on market $725,000 Active 90 DOM
-
2026-06-01days on market $725,000 Active 89 DOM
-
2026-05-31days on market $725,000 Active 88 DOM
-
2026-03-04$725,000 Active
-
2023-12-19historical $1,400
-
2022-12-17$1,400
-
2013-04-30soldstatus $132,283 387-char remark
Show marketing remark (387 chars)
Great investment opportunity! Fourplex in Adelanto features a two story, 3 bedroom 2 bath with fireplace in living room, two 2 bedroom, 2 bath units and one 1 bedroom, 1 bath unit. Fresh paint and carpet in all units! Laundry room in common area. Purchase this property for as little as 3% down! This property is approved for HomePath Mortgage and HomePath Renovation Mortgage Financing.
-
2003-10-31soldstatus $699,500 88-char remark
Show marketing remark (88 chars)
5 QUADRUPLEX, NEW REMODELED FULLY OCCUPIED PLEASE DO NOT DISTURB TENANTS. DRIVE BY ONLY.
-
2003-04-16soldstatus $135,000
-
2002-07-23$699,500 88-char remark
Show marketing remark (88 chars)
5 QUADRUPLEX, NEW REMODELED FULLY OCCUPIED PLEASE DO NOT DISTURB TENANTS. DRIVE BY ONLY.
-
1998-10-30soldstatus $134,000
-
1990-09-28soldstatus $80,000
ⓘ Source: listings_history table (triggers on properties + properties_extension) + one-shot
backfill from property_details.listing_events for pre-trigger history.
Tax reassessment forecast CA · Resets to sale price
- Current annual tax
- $2,266 · $189/mo
- Projected year-2 tax
- $5,510 · $459/mo
- Expected delta
- +$3,244/yr (+$270/mo · 143.2%)
ⓘ Screening estimate from a state-policy table — verify with the county assessor before closing.
Climate risk First Street
- Flood 1/10 Low FEMA zone X (shaded) · 0% chance over 30 yrs
- Wildfire 4/10 Moderate
- Heat 7/10 Severe 6 d/yr ≥99°F today · 15 d/yr by 30 yrs out
- Wind 1/10 Low
- Air quality 8/10 Severe 16 unhealthy d/yr today · 20 by 30 yrs out
Nearby sold comps map
Loading sold comps map…
Walkable amenities ~0.75 mi
Loading nearby amenities…
Taxation est. · year 1
- Rental income
- $75,948
- − Mortgage interest
- −$40,611
- − Property taxes
- −$2,266
- − Insurance
- −$3,625
- − Repairs & maintenance
- −$6,076
- − Management
- −$6,076
- − Depreciation
- −$21,091
- Taxable loss
- −$3,797
- Est. tax savings @ 24.0%
- +$911
- After-tax cash flow
- $9,395/yr
For passive investors: Depreciation is non-cash, so a rental often shows a tax loss while cash-flowing — sheltering income. Rental losses are passive: they offset passive income freely, and up to $25,000/yr can offset ordinary (W-2) income if you actively participate and your MAGI is under $100k (phasing out to $0 by $150k); unused losses carry forward. On sale, claimed depreciation is recaptured at up to 25%, and gains may owe capital-gains tax (a 1031 exchange can defer both). Figures are a year-1 estimate at your 24.0% rate — not tax advice; consult a CPA.
Schools (NCES district)
- District
- Victor Valley Union High
- NCES district ID
- 0636972
- Math proficiency
- 25% ▲ 6.00%
- Reading proficiency
- 25% ▼ -12.00%
- Median HH income
- $45,112
- Composite
- 21.6/100
- National rank
- #8296
- State rank
- #407 of 517 in CA
Livability — Adelanto
- Score
- 47/100
- State rank
- #1250
- US rank
- #26338
Category grades
Schools grade is shown separately in the Schools card above.
Census & demographics
- Census place
- Adelanto, CA
- County
- San Bernardino County · 2,030,291 people
- City population
- 38,577
- Metro
- Riverside-San Bernardino-Ontario, CA
- Population (ZIP)
- 38,577
- Household income
- $68,676
- Rent vs Own
- Severe rent burden
- 1345.0
Population outlook (San Bernardino County) Hauer SSP2
- Today (2025)
- 2,300,329 people
- By 2030
- 2,378,907 · +3.4%
- By 2040
- 2,523,137 · +9.7%
- By 2050
- 2,642,388 · +14.9%
- By 2075
- 2,880,769 · +25.2%
- By 2100
- 2,909,436 · +26.5%
Race, ethnicity, and origin ACS 2023
- Neighborhood character
- Predominantly Hispanic (69%)
- Race & ethnicity
- Hispanic / Latino 69% Two or more races 34% Black 15% White 9% Asian 2% Native American 1%
- Hispanic origin (detail)
- Mexican 58%
- Foreign-born
- 18% · Canada
- Languages at home
- 52% English-only · Spanish 46%
Political lean MEDSL · San Bernardino
- 2024 margin
- Toss-up / Even · D 47.5% · R 49.7% · Other 2.8%
- 2008→2024 swing
- -8.5pp toward R · 2008: 6.3pp · 2024: -2.1pp
- All cycles
- 2024: R+2.1 2020: D+10.7 2016: D+9.8 2012: D+5.4 2008: D+6.3
Not yet ingested
- Civics
- —
Market trends
- HPI YoY
- ▲ 41.09%
- Current HPI
- 453.6071
- Rent YoY
- ▲ 4.68%
- Metro
- Riverside-San Bernardino-Ontario, CA
- State GDP YoY
- ▲ 3.21%
- F500 in state
- 116
Industry mix (Fortune 500 HQ in CA)
| Industry | F500 HQs | Revenue |
|---|---|---|
| Technology | 27 | $1,492B |
|
||
| Financial Services | 3 | $174B |
|
||
| Retail | 3 | $44B |
|
||
| Insurance | 3 | $26B |
|
||
| Media / Entertainment | 2 | $115B |
|
||
| Pharmaceuticals / Biotech | 2 | $62B |
|
||
Price history
+806.2% since first listed9 events — show timeline
- 2026-03-04 Listed $725,000 CRMLS
- 2023-12-19 Rental Removed $1,400 CRMLS
- 2022-12-17 Listed for Rent $1,400 CRMLS
- 2013-04-30 Sold (MLS) $132,283 CRMLS
- 2003-10-31 Sold (MLS) $699,500 CRMLS
- 2003-04-16 Sold (Public Records) $135,000 Public Records
- 2002-07-23 Listed $699,500 CRMLS
- 1998-10-30 Sold (Public Records) $134,000 Public Records
- 1990-09-28 Sold (Public Records) $80,000 Public Records
Property tax history
+1.9%/yrLatest (2025): $2,266 · +7.1% YoY. Source: county tax records.
Cash-flow waterfall
monthlySold comps — $/sqft
last 12 mo · ≤1 miLoading sold comps…