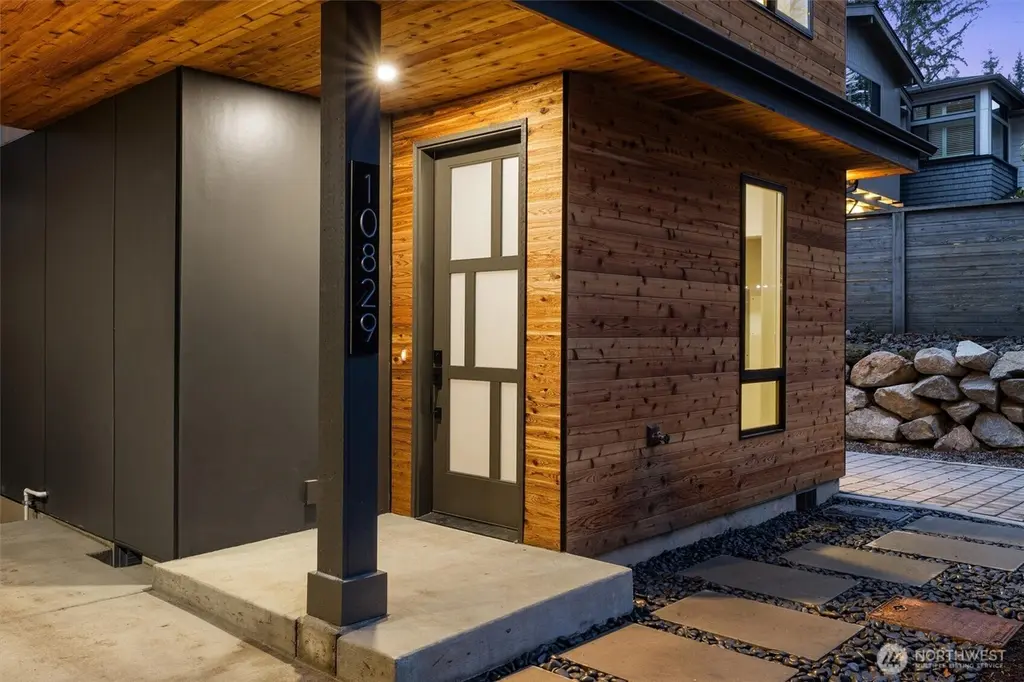
10829 104th Ave NE · Kirkland, WA
Flood risk 1/10 · Minimal
- FEMA flood zone
- X (unshaded)
- Chance of flooding over 30 yrs
- 0.0%
- Est. flood insurance / yr
- $507 – $1,088
Fire risk 1/10 · Minimal
- Est. fire insurance / yr
- $604 – $1,122
Heat risk 3/10 · Minor
- Hot days now (above 86°F)
- 7 days/yr
- Hot days in 30 yrs
- 15 days/yr
Wind risk 1/10 · Minimal
- Chance of severe wind over 30 yrs
- —
Air-quality risk 7/10 · Major
- Unhealthy air days now
- 9 days/yr
- Unhealthy air days in 30 yrs
- 10 days/yr
Risk factors via First Street. Map © Google.
Why this score? — see what drove the D- grade
The composite is a weighted blend of 9 inputs, each scored 0–100. Each bar is that input's sub-score; the figure is the points it added to the 100-point composite (weight × sub-score).
- ARV discount +15.0/15.0
- Schools +7.5/10.0
- Cash flow +5.8/30.0
- Livability +4.2/5.0
- Rent growth +3.2/5.0
- Condition / age +2.5/5.0
- 1% rule +0.6/10.0
- DSCR +0.2/10.0
- Appreciation +0.0/10.0
$899,000
🖨 Deal sheet 📄 Offer letter ✓ Due diligence
Listing remarks
Stunning new construction by Holden Development Group in sought-after South Juanita. Thoughtfully designed with modern elegance and quality craftsmanship, this light-filled home features an open-concept main level ideal for everyday living and entertaining. The gourmet kitchen offers a spacious island with seating, premium stainless appliances, sleek cabinetry, and generous prep space, flowing seamlessly into the dining area and inviting living room. Upstairs, retreat to the luxurious primary suite complete with a spa-inspired bath and generous walk-in closet. A second spacious bedroom, full bath, and conveniently located upper-level laundry enhance functionality and comfort. Enjoy a privat
Key facts
- New construction
- Gourmet kitchen
- Private fenced yard
Tags
Neighborhood map
What this means for you Summary
Snapshot
- This is a 5-bed/4.5-bath single-family listed at $899k.
Deal economics
- At list price, monthly cash flow is $-2k ($-22k/yr) — negative.
- To cash-flow at today's rent, offer at most $581k (35.4% below list).
- To meet the 1% rule (rent ≥ 1% of price), the offer needs to be $503k (44.0% below list).
- Recommended offer: $503k (44.0% below list) — sets the bar for 1% rule.
- Cap rate 3.9% vs local median 1.1% in Kirkland — top-decile yield for the area; either an underpriced asset or a hidden risk that comps aren't pricing in. Stress-test before assuming the spread holds.
Location & tenants
- Location reads 84/100 on livability (#46 in WA, #792 nationally) — a professional / high-income tenant draw. Strengths: schools A+, commute A+, employment A+; Watch: cost of living F.
- Lake Washington School District (suburban): math 79% / reading 85% proficiency, ranked #3 of 291 in WA (top 1%) — strong family-tenant draw, lease renewals of 3-5y typical; only 10% free/reduced lunch — higher-income household profile.
- Market conditions: Rents rising (+2.7%/yr); 453 active listings in the ZIP; 1 comparable units currently listed for rent nearby; high-income renter base; 10,555 units permitted in King County in 2024 (7,119 in 5+ unit buildings).
- This rent runs 33% of the median local income ($182k/yr) — at the standard rent-burdened threshold; future hikes will face affordability resistance.
Forward outlook
- Local home prices are declining (-3.0%/yr); year-one equity from $6k of loan paydown is wiped out by about $27k of value loss. Plan a longer hold.
- King County population projected at +44% by 2050 — long-run rental-demand tailwind backs the buy-and-hold thesis.
Negotiation context
- It's been on market 69 days — a 6% lower offer ($845k) is reasonable based on typical stale-listing flexibility.
- 2 sale attempts since 4y ago with the ask held roughly flat each time — persistent listings suggest the price (not the market) is what's stuck; bring a comps-based counter.
Questions for the listing agent
- What do current leases actually rent for vs. the listed asking? Can we see a recent rent roll and the last 12 months of T-12 income?
- It's been on market 69 days. Have you received any prior offers? Is the seller open to a 44% concession, seller financing, or rate buy-down credit?
- What does the HOA fee cover, when was the last increase, and are there any pending special assessments or reserve-fund shortfalls?
- Why hasn't it sold? Are there any deal-killer items the seller is aware of (foundation, flood, title, zoning, code violations)?
- Is there a deadline driving the sale (1031 exchange, divorce, estate, relocation)? That informs how much negotiation room exists.
- Schools are A-rated — typically a magnet for longer-tenancy family renters. What's the average tenant stay here, and is there a school-zone premium baked into asking?
- The area grade is low — what's the realistic commute time and amenity access for the typical tenant pool here? Any planned neighborhood developments (good or bad) we should know about?
- What's the average days-on-market for RENTAL listings here right now (not sales)? A rising rental-DOM trend means longer vacancies and softer asking-rent achievability than the comps imply.
- What's the recent tenant-quality profile in this submarket — average credit score on applications, eviction rate, late-payment / NSF rate, and stable-employment percentage? A property-management company in the area should have these aggregated.
- How much new for-sale + rental construction is in the pipeline within 1–3 miles? Heavy new supply typically softens prices + rents 12–24 months out; constrained supply supports both.
Investment metrics
- 1% rule
- 0.56% ✗
- Cap rate
- 3.89%
- Cash-on-cash
- -8.59%
- DSCR
- 0.62
- GRM
- 14.9
CMA / ARV
- ARV (median comp)
- $1,266,684
- List price
- $899,000
- Delta
- -29.03%
- Verdict
- UNDERPRICED
- Comps
- 20 within 1.0 mi
Show comp detail 12 sales within ~0.75 mi
| Address | Dist | Beds/Ba | Sqft | Sold | Price | $/sf | Match |
|---|---|---|---|---|---|---|---|
| 10829 101st Pl NE | 0.13mi | 5/3.5 | 3,880 (+3%) | 8mo | $2,595,000 | $669 | 79 |
| 558 20th Ave | 0.39mi | 5/4.0 | 3,550 (-6%) | 1mo | $2,315,000 | $652 | 69 |
| 10133 NE 113th Pl | 0.29mi | 5/4.5 | 3,410 (-10%) | 4mo | $2,045,000 | $600 | 66 |
| 720 20th Ave W | 0.47mi | 5/4.0 | 3,540 (-6%) | 3mo | $2,950,000 | $833 | 63 |
| 1808 2nd St | 0.54mi | 5/5.0 | 3,620 (-4%) | 4mo | $2,650,000 | $732 | 63 |
| 11019 NE 104TH St | 0.59mi | 4/3.5 (-1) | 3,760 (-0%) | 2mo | $2,350,000 | $625 | 61 |
| 335 18th Ave | 0.59mi | 5/4.5 | 3,900 (+3%) | 7mo | $3,075,000 | $788 | 61 |
| 1923 3rd St | 0.40mi | 5/5.0 | 3,362 (-11%) | 5mo | $2,300,000 | $684 | 57 |
| 11216 NE 103rd Pl | 0.75mi | 4/4.5 (-1) | 3,887 (+3%) | 6mo | $3,195,000 | $822 | 51 |
| 912 18th Ave W | 0.60mi | 5/4.5 | 4,315 (+14%) | 4mo | $3,838,000 | $889 | 45 |
| 1525 4th St | 0.67mi | 5/4.0 | 4,330 (+15%) | 1mo | $3,400,000 | $785 | 42 |
| 11120 NE 106th Pl | 0.62mi | 4/3.5 (-1) | 3,415 (-10%) | 6mo | $1,700,000 | $498 | 41 |
Match score weights: distance 35% · size 25% · config 20% · recency 20%. Top-matched comps best support the ARV.
Projected returns pro-forma
-3.0% appreciation · 2.71% rent growth · sell at horizon
- IRR
- -31.8%
- Equity multiple
- -0.04×
- Total profit
- $-262,158
- Equity at exit
- $134,044
- IRR
- -37.8%
- Equity multiple
- -0.52×
- Total profit
- $-382,889
- Equity at exit
- $77,729
Cash invested: $251,720 (down + closing). Projections, not guarantees.
Landlord ↔ Tenant lean methodology
- Overall (STATE)
- 28 Tenant-Leaning
- State Washington
- 28 Tenant-Leaning · D+8
- County
- — inherits STATE
- City
- — inherits STATE
ZIP-level market 98033
- Rents YoY
- 2.7%
- Active inventory
- 453
- Price-to-rent
- 14.9×
Monthly cashflow live
- Estimated rent
- $5,033 medium interval (Pro) →
- Mortgage (P&I)
- −$4,714
- Tax from tax record
- −$573 /mo · $6,876/yr
- Insurance
- −$375
- HOA
- −$117
- Vacancy / Maint / Mgmt
- −$1,057
- Net cashflow
- $-1,803
Break-even live
UW: 25.0% down · 7.5% · 30yr · 1.5% tax · 5.0% vac · 8.0% maint · 8.0% mgmt
Financing live
Cash to close
- Down payment
- $224,750
- Closing costs
- $26,970
- Reserves months
- —
- Total cash needed
- —
Loan-product check · same deal, 3 products live
Conventional
25% down · 7.5% · 30yr
- Down + closing
- —
- Monthly P&I
- —
- Monthly cashflow
- —
- DSCR
- —
- Eligible?
- —
Personal DTI + credit; lowest rate.
DSCR
20% down · 8.5% · 30yr
- Down + closing
- —
- Monthly P&I
- —
- Monthly cashflow
- —
- DSCR
- —
- Eligible?
- —
No personal income docs; deal must DSCR.
Hard money
10% down · 12.0% · 12mo
- Down + closing
- —
- Monthly P&I
- —
- Monthly cashflow
- —
- DSCR
- —
- Eligible?
- —
Short-term bridge; refi at stabilization.
Rent comps 1 comps
| Address | Beds | Baths | Sqft | Rent | $/sqft | DOM | Units | Dist |
|---|---|---|---|---|---|---|---|---|
| 12301 NE 107th St Kirkland, WA | 5.0 | 3.0 | 3190 | $7,500 | $2.35 | 43d | 1 | 1.23mi |
HOA detail
- Monthly dues
- $117 · $1,404/yr
Listing history 9 events
-
2026-05-06status Pending
-
2026-02-26$899,000 Active
-
2022-12-12soldstatus $920,000 Closed
-
2022-12-12soldstatus $920,000
-
2022-10-30status Pending
-
2022-10-13$950,000 Active
-
2003-07-09soldstatus $225,000
-
1996-06-28soldstatus $130,000
-
1984-11-05soldstatus $65,000
ⓘ Source: listings_history table (triggers on properties + properties_extension) + one-shot
backfill from property_details.listing_events for pre-trigger history.
Tax reassessment forecast WA · Resets to sale price
- Current annual tax
- $6,876 · $573/mo
- Projected year-2 tax
- $8,810 · $734/mo
- Expected delta
- +$1,934/yr (+$161/mo · 28.1%)
ⓘ Screening estimate from a state-policy table — verify with the county assessor before closing.
Climate risk First Street
- Flood 1/10 Low FEMA zone X (unshaded) · 0% chance over 30 yrs
- Wildfire 1/10 Low
- Heat 3/10 Moderate 7 d/yr ≥86°F today · 15 d/yr by 30 yrs out
- Wind 1/10 Low
- Air quality 7/10 Severe 9 unhealthy d/yr today · 10 by 30 yrs out
Nearby sold comps map
Loading sold comps map…
Walkable amenities ~0.75 mi
Loading nearby amenities…
Taxation est. · year 1
- Rental income
- $60,398
- − Mortgage interest
- −$50,358
- − Property taxes
- −$6,876
- − Insurance
- −$4,495
- − Repairs & maintenance
- −$4,832
- − Management
- −$4,832
- − HOA
- −$1,404
- − Depreciation
- −$26,153
- Taxable loss
- −$38,552
- Est. tax savings @ 24.0%
- +$9,252
- After-tax cash flow
- $-12,382/yr
For passive investors: Depreciation is non-cash, so a rental often shows a tax loss while cash-flowing — sheltering income. Rental losses are passive: they offset passive income freely, and up to $25,000/yr can offset ordinary (W-2) income if you actively participate and your MAGI is under $100k (phasing out to $0 by $150k); unused losses carry forward. On sale, claimed depreciation is recaptured at up to 25%, and gains may owe capital-gains tax (a 1031 exchange can defer both). Figures are a year-1 estimate at your 24.0% rate — not tax advice; consult a CPA.
Schools (NCES district)
- District
- Lake Washington School District
- NCES district ID
- 5304230
- Math proficiency
- 79% ▬ 0.00%
- Reading proficiency
- 85% ▲ 1.00%
- Median HH income
- $103,849
- Composite
- 75.15/100
- National rank
- #251
- State rank
- #3 of 291 in WA
Livability — Kirkland
- Score
- 84/100
- State rank
- #46
- US rank
- #792
Category grades
Schools grade is shown separately in the Schools card above.
Census & demographics
- Census place
- Kirkland, WA
- County
- King County · 2,251,916 people
- City population
- 93,513
- Metro
- Seattle-Tacoma-Bellevue, WA
- Population (ZIP)
- 40,982
- Household income
- $182,500
- Rent vs Own
- Severe rent burden
- 1188.0
Population outlook (King County) Hauer SSP2
- Today (2025)
- 2,576,485 people
- By 2030
- 2,803,316 · +8.8%
- By 2040
- 3,255,921 · +26.4%
- By 2050
- 3,706,444 · +43.9%
- By 2075
- 4,746,063 · +84.2%
- By 2100
- 5,407,730 · +109.9%
Race, ethnicity, and origin ACS 2023
- Neighborhood character
- Predominantly White (67%)
- Race & ethnicity
- White 67% Asian 18% Two or more races 8% Hispanic / Latino 6% Black 2%
- Hispanic origin (detail)
- Mexican 4%
- Common ancestry
- Portuguese 4% Lithuanian 4% Italian 3%
- Foreign-born
- 24% · China, Canada, South Korea
- Languages at home
- 74% English-only · Chinese 6% Other Indo-European 6% Spanish 3%
Political lean MEDSL · King
- 2024 margin
- Solid D (+51.7) · D 74.2% · R 22.5% · Other 3.4%
- 2008→2024 swing
- +9.6pp toward D · 2008: 42.1pp · 2024: 51.7pp
- All cycles
- 2024: D+51.7 2020: D+52.7 2016: D+50.4 2012: D+39.9 2008: D+42.1
Not yet ingested
- Civics
- —
Market trends
- HPI YoY
- ▼ -1417.82%
- Current HPI
- 440.1978
- Rent YoY
- ▲ 2.71%
- Metro
- Seattle-Tacoma-Bellevue, WA
- State GDP YoY
- ▲ 4.65%
- F500 in state
- 22
Industry mix (Fortune 500 HQ in WA)
| Industry | F500 HQs | Revenue |
|---|---|---|
| Retail | 2 | $269B |
|
||
| Technology / Retail | 1 | $638B |
|
||
| Technology | 1 | $245B |
|
||
| Telecommunications | 1 | $38B |
|
||
| Food / Beverage | 1 | $36B |
|
||
| Automotive / Trucks | 1 | $34B |
|
||
Price history
+1283.1% since first listed9 events — show timeline
- 2026-05-06 Pending — NWMLS as Distributed by MLS Grid
- 2026-02-26 Listed $899,000 NWMLS as Distributed by MLS Grid
- 2022-12-12 Sold (Public Records) $920,000 Public Records
- 2022-12-12 Sold (MLS) $920,000 NWMLS as Distributed by MLS Grid
- 2022-10-30 Pending — NWMLS as Distributed by MLS Grid
- 2022-10-13 Listed $950,000 NWMLS as Distributed by MLS Grid
- 2003-07-09 Sold (Public Records) $225,000 Public Records
- 1996-06-28 Sold (Public Records) $130,000 Public Records
- 1984-11-05 Sold (Public Records) $65,000 Public Records
Property tax history
+5.2%/yrLatest (2024): $6,876 · -5.7% YoY. Source: county tax records.
Cash-flow waterfall
monthlySold comps — $/sqft
last 12 mo · ≤1 miLoading sold comps…