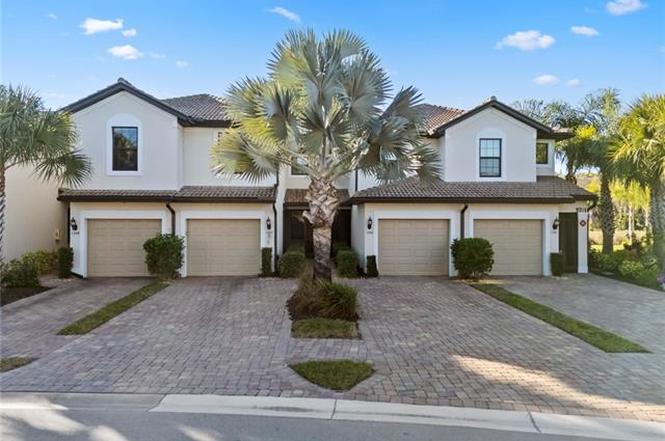
5701 Mayflower Way #1302 · Ave Maria, FL
Flood risk 1/10 · Minimal
- FEMA flood zone
- X (unshaded)
- Chance of flooding over 30 yrs
- 0.0%
- Est. flood insurance / yr
- $507 – $1,088
Fire risk 5/10 · Moderate
- Est. fire insurance / yr
- $947 – $1,759
Heat risk 10/10 · Severe
- Hot days now (above 111°F)
- 7 days/yr
- Hot days in 30 yrs
- 28 days/yr
Wind risk 10/10 · Severe
- Chance of severe wind over 30 yrs
- 99.0%
Air-quality risk 2/10 · Minimal
- Unhealthy air days now
- 0 days/yr
- Unhealthy air days in 30 yrs
- 1 days/yr
Risk factors via First Street. Map © Google.
Why this score? — see what drove the D- grade
The composite is a weighted blend of 9 inputs, each scored 0–100. Each bar is that input's sub-score; the figure is the points it added to the 100-point composite (weight × sub-score).
- ARV discount +7.5/15.0
- Cash flow +7.2/30.0
- 1% rule +5.1/10.0
- Schools +5.0/10.0
- Appreciation +4.5/10.0
- Rent growth +3.2/5.0
- Livability +2.5/5.0
- Condition / age +2.5/5.0
- DSCR +1.4/10.0
$312,900
🖨 Deal sheet 📄 Offer letter ✓ Due diligence
Listing remarks
This partially FURNISHED, FIRST FLOOR carriage home is located in the 55+ Del Webb Naples community and showcases the popular EGRET FLOOR PLAN with 2 bedrooms plus a den. Thoughtfully upgraded and beautifully styled, this home features CUSTOM electronic window treatments, colorful designer wallpaper, custom lighting, and TILE laid on the diagonal throughout the main living areas. The bright and spacious KITCHEN and dining area is designed for both function and style, offering white cabinetry, quartz countertops, and convenient roll-out drawers. The inviting PRIMARY SUITE features a generous walk-in closet and an en-suite bathroom with dual sinks and a walk-in shower. A well-appointed guest
Key facts
- Private pool
- Impact glass windows
- Sunset views
Tags
Property features AI
Finance
- Financial info: Total units in complex: 24; units in building: 8; one unit per floor; building has 2 floors
- HOA & community: Mandatory HOA; HOA fees billed quarterly; Master HOA fee $203 quarterly; HOA fee $794 quarterly; Condo fee $1,269 quarterly; Professional management; Maintenance covers cable, golf course, internet/Wi‑Fi, irrigation water, lawn/land maintenance, legal/accounting, manager, exterior pest control, recreation facilities, repairs, reserves, sewer, street lights, street maintenance, and water; Community amenities include clubhouse, community pool and spa/hot tub, exercise room, tennis, pickleball, basketball, golf course (non-equity), putting green, play area, dog park, bike/jog paths, library, restaurant, beauty salon, hobby room, billiards, shopping, sidewalks, streetlights, underground utilities; Gated golf-course community; Total annual recurring fees $9,064; Total one-time fees $1,920; One-time other fee $295; One-time special assessment fee $1,375
Exterior
- Parking: Attached garage (1 car); Paved driveway
- Security: Gated community
- Utilities: Central water (assessment paid); Central sewer; Cable available
- Home design: Residential carriage/coach style; Low-rise building (1-3 stories); Built in 2021; Rear exposure facing west; Located in Ave Maria development
- Construction: Concrete block construction
- Exterior features: Screened lanai/porch; Patio; Automatic sprinkler system; Impact resistant windows and doors; Stucco exterior; Tile roof; Gated community
Interior
- Kitchen: Island; Pantry; Electric cooktop; Range; Microwave; Dishwasher; Disposal; Refrigerator/freezer
- Bedrooms: 2 bedrooms plus den; First-floor bedroom; Split bedrooms layout
- Flooring: Carpet; Tile
- Bathrooms: 2 full bathrooms; Master bath with dual sinks and shower (no tub)
- Heating & cooling: Central electric heat; Central electric air conditioning; Ceiling fans
- Interior features: Cable prewire; French doors; Pantry; Smoke detectors; Walk-in closet; Window coverings; Great room; Split bedroom floor plan; Partially furnished
- Laundry & utility: Washer and dryer in residence; Auto garage door
Neighborhood map
What this means for you Summary
Snapshot
- This is a 2-bed/2.0-bath condo listed at $313k.
Deal economics
- At list price, monthly cash flow is $-430 ($-5k/yr) — negative.
- To cash-flow at today's rent, offer at most $237k (24.3% below list).
- Meets the 1% rule at list price ($3k rent vs $313k).
- Recommended offer: $237k (24.3% below list) — sets the bar for cash-flow.
Location & tenants
- Location reads: area grade D — affects rentability + tenant quality, not the cash-flow math above.
- Collier (suburban): math 60% / reading 56% proficiency, ranked #16 of 73 in FL (top 22%) — acceptable for families but not a draw, mixed tenant base, ~2y average lease.
- Market conditions: Rents rising (+3.0%/yr); 449 active listings in the ZIP; 40 comparable units currently listed for rent nearby; rentals at typical pace (median 23d on market — plan ~3-4 weeks tenant-placement turnaround); 3,520 units permitted in Collier County in 2024 (959 in 5+ unit buildings).
- At $3,145/mo this rent would consume 61% of the median local household income ($62k/yr) (locally 1093% of renters already pay >50% of income on rent) — very limited rent-growth headroom before tenants either downsize or default.
Forward outlook
- Local home prices are declining (-1.1%/yr); year-one equity from $2k of loan paydown is wiped out by about $3k of value loss. Plan a longer hold.
- Collier County population projected at +30% by 2050 — long-run rental-demand tailwind backs the buy-and-hold thesis.
Negotiation context
- It's been on market 139 days — a 12% lower offer ($275k) is reasonable based on typical stale-listing flexibility.
Risks & watch-outs
- Watch-outs: HOA is 25% of rent.
- Climate carrying-cost: severe wind risk, 99% chance of damaging wind over 30y; moderate wildfire risk; extreme-heat days projected 7→28/yr by 2055 (HVAC capex compounding) — expect insurance premiums to compound above CPI over the hold.
Questions for the listing agent
- What do current leases actually rent for vs. the listed asking? Can we see a recent rent roll and the last 12 months of T-12 income?
- It's been on market 139 days. Have you received any prior offers? Is the seller open to a 24% concession, seller financing, or rate buy-down credit?
- What does the HOA fee cover, when was the last increase, and are there any pending special assessments or reserve-fund shortfalls?
- Any open or pending special assessments — roof, HVAC, plumbing, elevator, façade? What's the per-unit balance and payoff schedule, and is the seller paying it off at close or rolling it to the buyer?
- Why hasn't it sold? Are there any deal-killer items the seller is aware of (foundation, flood, title, zoning, code violations)?
- Is there a deadline driving the sale (1031 exchange, divorce, estate, relocation)? That informs how much negotiation room exists.
- The area grade is low — what's the realistic commute time and amenity access for the typical tenant pool here? Any planned neighborhood developments (good or bad) we should know about?
- What's the average days-on-market for RENTAL listings here right now (not sales)? A rising rental-DOM trend means longer vacancies and softer asking-rent achievability than the comps imply.
- What's the recent tenant-quality profile in this submarket — average credit score on applications, eviction rate, late-payment / NSF rate, and stable-employment percentage? A property-management company in the area should have these aggregated.
- How much new apartment / multifamily construction is in the pipeline within 1–3 miles? Heavy new supply (>2% of stock underway) typically softens rents 12–24 months out; light construction supports rent growth.
Investment metrics
- 1% rule
- 1.01% ✓
- Cap rate
- 4.65%
- Cash-on-cash
- -5.88%
- DSCR
- 0.74
- GRM
- 8.3
CMA / ARV
No comps found within radius.
Projected returns pro-forma
-1.05% appreciation · 2.95% rent growth · sell at horizon
- IRR
- -13.7%
- Equity multiple
- 0.42×
- Total profit
- $-51,246
- Equity at exit
- $74,807
- IRR
- -6.8%
- Equity multiple
- 0.39×
- Total profit
- $-53,644
- Equity at exit
- $77,937
Cash invested: $87,612 (down + closing). Projections, not guarantees.
Landlord ↔ Tenant lean methodology
- Overall (STATE)
- 87 Strongly Landlord-Friendly
- State Florida
- 87 Strongly Landlord-Friendly · R+3
- County
- — inherits STATE
- City
- — inherits STATE
ZIP-level market 34142
- Home prices YoY
- -0.5%
- Rents YoY
- 3.0%
- Active inventory
- 449
- Price-to-rent
- 8.3×
Monthly cashflow live
- Estimated rent
- $3,145 high interval (Pro) →
- Mortgage (P&I)
- −$1,641
- Tax from tax record
- −$344 /mo · $4,126/yr
- Insurance
- −$130
- HOA
- −$799
- Vacancy / Maint / Mgmt
- −$660
- Net cashflow
- $-430
Break-even live
UW: 25.0% down · 7.5% · 30yr · 1.5% tax · 5.0% vac · 8.0% maint · 8.0% mgmt
Financing live
Cash to close
- Down payment
- $78,225
- Closing costs
- $9,387
- Reserves months
- —
- Total cash needed
- —
Loan-product check · same deal, 3 products live
Conventional
25% down · 7.5% · 30yr
- Down + closing
- —
- Monthly P&I
- —
- Monthly cashflow
- —
- DSCR
- —
- Eligible?
- —
Personal DTI + credit; lowest rate.
DSCR
20% down · 8.5% · 30yr
- Down + closing
- —
- Monthly P&I
- —
- Monthly cashflow
- —
- DSCR
- —
- Eligible?
- —
No personal income docs; deal must DSCR.
Hard money
10% down · 12.0% · 12mo
- Down + closing
- —
- Monthly P&I
- —
- Monthly cashflow
- —
- DSCR
- —
- Eligible?
- —
Short-term bridge; refi at stabilization.
Rent comps 40 comps
| Address | Beds | Baths | Sqft | Rent | $/sqft | DOM | Units | Dist |
|---|---|---|---|---|---|---|---|---|
| 5705 Mayflower Way #1407 Ave Maria, FL | 2.0 | 2.0 | 1536 | $2,250 | $1.46 | 23d | 1 | 0.04mi |
| 5697 Mayflower Way Ave Maria, FL | 2.0 | 2.0 | 1538 | $2,495 | $1.62 | 23d | 1 | 0.05mi |
| 5728 Mayflower Way Ave Maria, FL | 3.0 | 3.0 | 2087 | $2,650 | $1.27 | 23d | 1 | 0.10mi |
| 5690 Mayflower Way #601 Ave Maria, FL | 3.0 | 2.0 | 1815 | $5,500 | $3.03 | 23d | 1 | 0.11mi |
| 5690 Mayflower Way Ave Maria, FL | 3.0 | 2.0 | 1815 | $3,295 | $1.82 | 23d | 1 | 0.11mi |
| 5769 Mayflower Way Ave Maria, FL | 2.0 | 2.0 | 1554 | $4,000 | $2.57 | 23d | 1 | 0.14mi |
| 5709 Constitution St Ave Maria, FL | 2.0 | 2.0 | 1900 | $2,400 | $1.26 | 23d | 1 | 0.19mi |
| 5935 Mayflower Way Ave Maria, FL | 2.0 | 2.0 | 1460 | $2,550 | $1.75 | 23d | 1 | 0.40mi |
| 5988 Mayflower Way Ave Maria, FL | 2.0 | 2.0 | 1602 | $5,200 | $3.25 | 23d | 1 | 0.46mi |
| 5309 Beckton Rd Ave Maria, FL | 3.0 | 2.5 | 2051 | $2,395 | $1.17 | 23d | 1 | 0.53mi |
| 5538 Useppa Dr Ave Maria, FL | 2.0 | 2.5 | 1850 | $10,995 | $5.94 | 23d | 1 | 0.74mi |
| 5374 Ferris Ave Ave Maria, FL | 3.0 | 2.5 | 1933 | $2,350 | $1.22 | 23d | 1 | 0.78mi |
| 5657 Agostino Way Ave Maria, FL | 3.0 | 2.5 | 1981 | $2,400 | $1.21 | 13d | 1 | 0.81mi |
| 5661 Agostino Way Ave Maria, FL | 3.0 | 2.5 | 2200 | $2,350 | $1.07 | 13d | 1 | 0.81mi |
| 5474 Cassidy Ln Ave Maria, FL | 3.0 | 2.5 | 2032 | $2,650 | $1.30 | 23d | 1 | 0.82mi |
| 5435 Pikewood Ct Ave Maria, FL | 2.0 | 2.5 | 1850 | $3,695 | $2.00 | 21d | 1 | 0.83mi |
| 6421 Liberty St Ave Maria, FL | 3.0 | 2.0 | 1922 | $5,800 | $3.02 | 23d | 1 | 0.85mi |
| 5573 Cobalto Way Unit 5573 Ave Maria, FL | 3.0 | 2.0 | 1921 | $2,400 | $1.25 | 13d | 1 | 0.87mi |
| 5573 Cobalto Way Ave Maria, FL | 3.0 | 2.0 | 1921 | $2,400 | $1.25 | 13d | 1 | 0.87mi |
| 6441 Liberty St Ave Maria, FL | 3.0 | 2.0 | 1685 | $5,795 | $3.44 | 23d | 1 | 0.88mi |
| 6168 Harmony Dr Immokalee, FL | 3.0 | 2.0 | 1570 | $5,495 | $3.50 | 13d | 1 | 0.92mi |
| 5574 Cassidy Ln Ave Maria, FL | 3.0 | 2.0 | 1630 | $2,250 | $1.38 | 21d | 1 | 0.95mi |
| 8010 Helena Ct Ave Maria, FL | 2.0 | 2.0 | 1554 | $2,500 | $1.61 | 21d | 1 | 0.96mi |
| 6189 Harmony Dr Immokalee, FL | 3.0 | 2.0 | 1558 | $6,295 | $4.04 | 23d | 1 | 0.96mi |
| 5265 Messina St Ave Maria, FL | 3.0 | 2.5 | 1929 | $4,995 | $2.59 | 23d | 1 | 0.97mi |
| 5476 Katia Ct Ave Maria, FL | 3.0 | 2.5 | 1983 | $4,300 | $2.17 | 23d | 1 | 0.99mi |
| 6205 Harmony Dr Immokalee, FL | 3.0 | 2.0 | 1558 | $5,000 | $3.21 | 23d | 1 | 0.99mi |
| 5639 Argento Dr Ave Maria, FL | 3.0 | 2.5 | 1400 | $2,500 | $1.79 | 23d | 1 | 1.01mi |
| 5688 Cassidy Ln Ave Maria, FL | 2.0 | 2.0 | 1366 | $2,500 | $1.83 | 13d | 1 | 1.02mi |
| 5716 Cassidy Ln Ave Maria, FL | 3.0 | 2.5 | 1933 | $2,300 | $1.19 | 23d | 1 | 1.03mi |
| 5322 Nevola Ave Ave Maria, FL | 3.0 | 3.0 | 1918 | $2,700 | $1.41 | 13d | 1 | 1.05mi |
| 5478 Double Eagle Cir #3521 Ave Maria, FL | 2.0 | 2.0 | 1569 | $4,995 | $3.18 | 23d | 1 | 1.08mi |
| 5454 Double Eagle Cir #3325 Ave Maria, FL | 2.0 | 2.0 | 1355 | $2,495 | $1.84 | 23d | 1 | 1.11mi |
| 5835 Double Eagle Cir #4726 Ave Maria, FL | 2.0 | 2.0 | 1154 | $2,095 | $1.82 | 13d | 1 | 1.11mi |
| 6012 Ellerston WAY #1121 Ave Maria, FL | 3.0 | 2.0 | 2110 | $6,295 | $2.98 | 23d | 1 | 1.11mi |
| 5651 Double Eagle Cir #4316 Ave Maria, FL | 2.0 | 2.0 | 1154 | $5,495 | $4.76 | 23d | 1 | 1.11mi |
| 5629 Double Eagle Cir #4218 Ave Maria, FL | 3.0 | 2.0 | 1301 | $6,295 | $4.84 | 23d | 1 | 1.11mi |
| 6039 Ellerston WAY #2017 Ave Maria, FL | 2.0 | 2.0 | 1355 | $6,295 | $4.65 | 23d | 1 | 1.11mi |
| 5710 Melbourne Ct #6511 Ave Maria, FL | 3.0 | 2.0 | 1741 | $7,295 | $4.19 | 23d | 1 | 1.11mi |
| 5629 Double Eagle Cir #4217 Ave Maria, FL | 2.0 | 2.0 | 1154 | $5,795 | $5.02 | 23d | 1 | 1.11mi |
HOA detail condo
- Monthly dues
- $799 · $9,588/yr
- Assessments
- None detected in remarks — confirm with the listing agent.
Listing history 15 events
-
2026-06-18days on market $312,900 Active 139 DOM
-
2026-06-17days on market $312,900 Active 138 DOM
-
2026-06-16days on market $312,900 Active 137 DOM
-
2026-06-15days on market $312,900 Active 136 DOM
-
2026-06-14days on market $312,900 Active 134 DOM
-
2026-06-10days on market $312,900 Active 131 DOM
-
2026-06-09days on market $312,900 Active 130 DOM
-
2026-06-08days on market $312,900 Active 129 DOM
-
2026-06-07days on market $312,900 Active 128 DOM
-
2026-06-03days on market $312,900 Active 124 DOM
-
2026-06-02days on market $312,900 Active 123 DOM
-
2026-06-01days on market $312,900 Active 122 DOM
-
2026-05-31days on market $312,900 Active 121 DOM
-
2026-05-30days on market $312,900 Active 120 DOM
-
2026-01-30$312,900 Active
ⓘ Source: listings_history table (triggers on properties + properties_extension) + one-shot
backfill from property_details.listing_events for pre-trigger history.
Tax reassessment forecast FL · Resets to sale price
- Current annual tax
- $4,126 · $344/mo
- Projected year-2 tax
- $4,126 · $344/mo
- Expected delta
- $0/yr ($0/mo · 0.0%)
ⓘ Screening estimate from a state-policy table — verify with the county assessor before closing.
Climate risk First Street
- Flood 1/10 Low FEMA zone X (unshaded) · 0% chance over 30 yrs
- Wildfire 5/10 Major
- Heat 10/10 Extreme 7 d/yr ≥111°F today · 28 d/yr by 30 yrs out
- Wind 10/10 Extreme 99% chance of damaging wind over 30 yrs
- Air quality 2/10 Low 0 unhealthy d/yr today · 1 by 30 yrs out
Nearby sold comps map
Loading sold comps map…
Walkable amenities ~0.75 mi
Loading nearby amenities…
Taxation est. · year 1
- Rental income
- $37,740
- − Mortgage interest
- −$17,527
- − Property taxes
- −$4,126
- − Insurance
- −$1,564
- − Repairs & maintenance
- −$3,019
- − Management
- −$3,019
- − HOA
- −$9,588
- − Depreciation
- −$9,103
- Taxable loss
- −$10,207
- Est. tax savings @ 24.0%
- +$2,450
- After-tax cash flow
- $-2,705/yr
For passive investors: Depreciation is non-cash, so a rental often shows a tax loss while cash-flowing — sheltering income. Rental losses are passive: they offset passive income freely, and up to $25,000/yr can offset ordinary (W-2) income if you actively participate and your MAGI is under $100k (phasing out to $0 by $150k); unused losses carry forward. On sale, claimed depreciation is recaptured at up to 25%, and gains may owe capital-gains tax (a 1031 exchange can defer both). Figures are a year-1 estimate at your 24.0% rate — not tax advice; consult a CPA.
Schools (NCES district)
- District
- Collier
- NCES district ID
- 1200330
- Math proficiency
- 60% ▼ -4.00%
- Reading proficiency
- 56% ▼ -2.00%
- Median HH income
- $58,275
- Composite
- 50.23/100
- National rank
- #1892
- State rank
- #16 of 73 in FL
Livability — Ave Maria
No livability data for this city. (Only ~50 U.S. cities are tracked.)
Census & demographics
- Census place
- Ave Maria, FL
- County
- Collier County · 396,295 people
- Metro
- Naples-Marco Island, FL
- Population (ZIP)
- 35,149
- Household income
- $62,333
- Rent vs Own
- Severe rent burden
- 1093.0
Population outlook (Collier County) Hauer SSP2
- Today (2025)
- 420,858 people
- By 2030
- 450,054 · +6.9%
- By 2040
- 502,232 · +19.3%
- By 2050
- 544,932 · +29.5%
- By 2075
- 627,203 · +49.0%
- By 2100
- 659,015 · +56.6%
Race, ethnicity, and origin ACS 2023
- Neighborhood character
- Majority Hispanic (63%)
- Race & ethnicity
- Hispanic / Latino 63% Two or more races 39% Black 19% White 16% Native American 7%
- Hispanic origin (detail)
- Mexican 43% Puerto Rican 3% Cuban 2% Dominican 1%
- Common ancestry
- Hispanic 8% Slovak 1% Serbian 1%
- Foreign-born
- 32% · Canada, Jamaica
- Languages at home
- 34% English-only · Spanish 53% French/Haitian/Cajun 12%
Political lean MEDSL · Collier
- 2024 margin
- Solid R (+33.1) · D 33.1% · R 66.2%
- 2008→2024 swing
- -10.6pp toward R · 2008: -22.5pp · 2024: -33.1pp
- All cycles
- 2024: R+33.1 2020: R+24.7 2016: R+26.0 2012: R+30.1 2008: R+22.5
Not yet ingested
- Civics
- —
Market trends
- HPI YoY
- ▼ -1.05%
- Current HPI
- 226.9105
- Rent YoY
- ▲ 2.95%
- Metro
- Naples-Marco Island, FL
- State GDP YoY
- ▲ 3.28%
- F500 in state
- 36
Industry mix (Fortune 500 HQ in FL)
| Industry | F500 HQs | Revenue |
|---|---|---|
| Industrial Technology | 2 | $29B |
|
||
| Insurance | 2 | $17B |
|
||
| Retail | 1 | $60B |
|
||
| Technology Distribution | 1 | $58B |
|
||
| Homebuilding | 1 | $35B |
|
||
| Technology Manufacturing | 1 | $35B |
|
||
Price history
1 event — show timeline
- 2026-01-30 Listed $312,900 NAPLESMLS
Property tax history
+29.7%/yrLatest (2025): $4,126 · +8.4% YoY. Source: county tax records.
Cash-flow waterfall
monthlySold comps — $/sqft
last 12 mo · ≤1 miLoading sold comps…