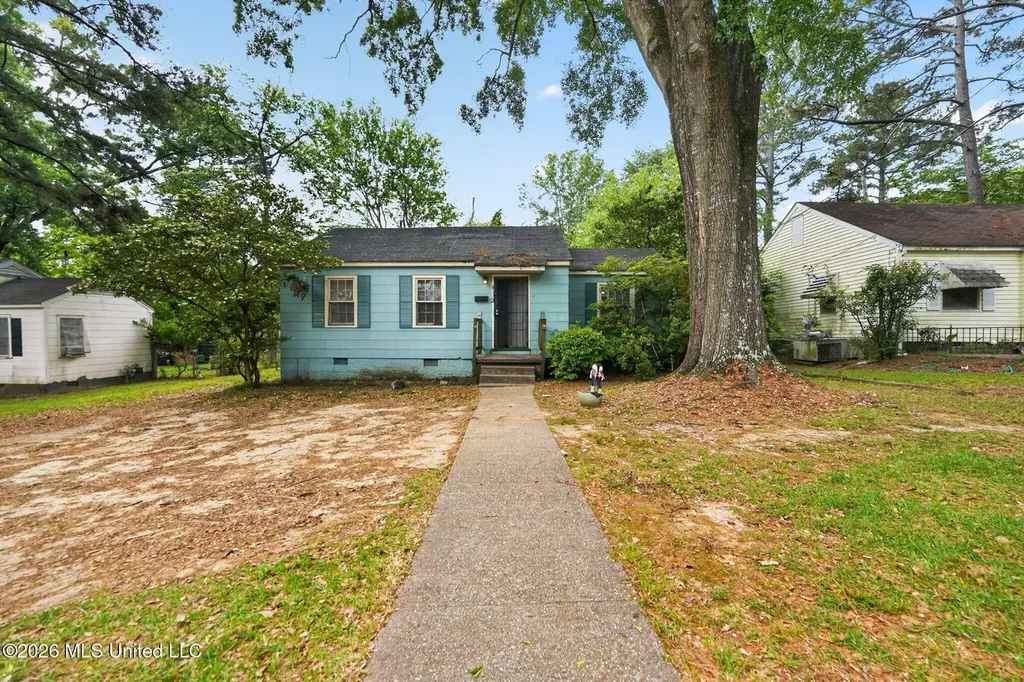
617 Woodbury Rd · Jackson, MS
Flood risk 1/10 · Minimal
- FEMA flood zone
- X (unshaded)
- Chance of flooding over 30 yrs
- 0.0%
- Est. flood insurance / yr
- $507 – $1,088
Fire risk 1/10 · Minimal
- Est. fire insurance / yr
- $1,241 – $2,305
Heat risk 7/10 · Major
- Hot days now (above 108°F)
- 7 days/yr
- Hot days in 30 yrs
- 18 days/yr
Wind risk 8/10 · Major
- Chance of severe wind over 30 yrs
- 80.0%
Air-quality risk 2/10 · Minimal
- Unhealthy air days now
- 0 days/yr
- Unhealthy air days in 30 yrs
- 1 days/yr
Risk factors via First Street. Map © Google.
Why this score? — see what drove the B- grade
The composite is a weighted blend of 9 inputs, each scored 0–100. Each bar is that input's sub-score; the figure is the points it added to the 100-point composite (weight × sub-score).
- Cash flow +30.0/30.0
- 1% rule +10.0/10.0
- DSCR +10.0/10.0
- ARV discount +7.5/15.0
- Livability +3.4/5.0
- Rent growth +3.2/5.0
- Condition / age +2.5/5.0
- Schools +1.1/10.0
- Appreciation +0.0/10.0
$69,900
🖨 Deal sheet 📄 Offer letter ✓ Due diligence
Listing remarks
Charming residential opportunity located in established North Jackson within the 39206 area. This property offers a traditional single-family layout typical of the neighborhood, featuring a functional floor plan with spacious living areas and flexible use potential. Situated on a residential lot with mature surroundings, the home provides driveway parking and convenient access to nearby schools, shopping, dining, and major commuter routes throughout the Jackson metro area. Ideal for investors, first-time buyers, or those looking for a renovation project, this property presents strong potential for value-add improvements. Property is being sold as-is. All information to be verified by buyer.
Key facts
- Convenient access
- Driveway parking
- Nearby schools
Tags
Property features AI
Exterior
- Parking: Detached 1-car garage; Driveway
- Utilities: Public water; Public sewer; Electricity available
- Home design: Single-family house; One level
- Construction: Brick construction; Asphalt roof; Chainwall foundation; Built (year from public records)
- Exterior features: Garden
Interior
- Kitchen: Refrigerator; Water heater
- Bathrooms: 1 full bathroom
- Heating & cooling: Central heating; Central air conditioning
- Interior features: Living room with wood-burning fireplace
Neighborhood map
What this means for you Summary
Snapshot
- This is a 2-bed/1.0-bath single-family listed at $70k.
Deal economics
- At list price, monthly cash flow is $406 ($5k/yr) — positive.
- The deal already cash-flows at list — no discount required.
- Meets the 1% rule at list price ($1k rent vs $70k).
- Recommended offer: $68k (3.0% below list) — sets the bar for market timing.
- Cap rate 13.3% vs local median 9.9% in Jackson — top-decile yield for the area; either an underpriced asset or a hidden risk that comps aren't pricing in. Stress-test before assuming the spread holds.
Location & tenants
- Location reads 68/100 on livability (#66 in MS) — a middle-class / working-renter tenant base. Strengths: commute A+, cost of living A+, housing A+; Watch: amenities F, employment F, health & safety F.
- Jackson Public School District (urban): math 9% / reading 18% proficiency, ranked #112 of 130 in MS (top 86%) — low school quality limits family demand, transient renter base, plan for 1-2y turnover; 88% free/reduced lunch — lower-income household profile, screen leases tightly.
- Zoned schools: Boyd Elementary School (math 0% / reading 9%, grade F, #368 of 375 statewide, top 98%, 405 students, 100% FRL); Murrah High School (math 12% / reading 27%, grade F, #130 of 197 statewide, top 68%, 1,326 students, 100% FRL).
- Market conditions: Rents rising (+2.8%/yr); 119 active listings in the ZIP; 18 comparable units currently listed for rent nearby; rentals at typical pace (median 23d on market — plan ~3-4 weeks tenant-placement turnaround); lower-income renter base — watch delinquency; 167 units permitted in Hinds County in 2024 (0 in 5+ unit buildings).
- This rent runs 32% of the median local income ($43k/yr) — at the standard rent-burdened threshold; future hikes will face affordability resistance.
Forward outlook
- Local home prices are declining (-3.0%/yr); year-one equity from $483 of loan paydown is wiped out by about $2k of value loss. Plan a longer hold.
- Hinds County population projected to shrink 6% by 2050 — rents likely to lag national; underwrite the cash flow, not the appreciation.
- At projected returns (-3.0% appreciation + 2.8% rent growth), your $20k cash investment doubles in ~5 years — after that, you're playing with house money.
Negotiation context
- It's been on market 50 days — a 3% lower offer ($68k) is reasonable based on typical stale-listing flexibility.
Risks & watch-outs
- Watch-outs: built in 1950 — expect roof / HVAC / electrical / plumbing capex.
- Climate carrying-cost: severe wind risk, 80% chance of damaging wind over 30y; extreme-heat days projected 7→18/yr by 2055 (HVAC capex compounding) — expect insurance premiums to compound above CPI over the hold.
Questions for the listing agent
- It's been on market 50 days. Have you received any prior offers? Is the seller open to a 3% concession, seller financing, or rate buy-down credit?
- Built in 1950 — when were the roof, HVAC, electrical panel, plumbing, and water heater last replaced?
- Is there a deadline driving the sale (1031 exchange, divorce, estate, relocation)? That informs how much negotiation room exists.
- Schools are F-rated, which usually means shorter tenancies and higher turnover. Who's the typical renter profile here, and what's been the actual vacancy rate?
- What's the average days-on-market for RENTAL listings here right now (not sales)? A rising rental-DOM trend means longer vacancies and softer asking-rent achievability than the comps imply.
- What's the recent tenant-quality profile in this submarket — average credit score on applications, eviction rate, late-payment / NSF rate, and stable-employment percentage? A property-management company in the area should have these aggregated.
- How much new for-sale + rental construction is in the pipeline within 1–3 miles? Heavy new supply typically softens prices + rents 12–24 months out; constrained supply supports both.
Investment metrics
- 1% rule
- 1.61% ✓
- Cap rate
- 13.27%
- Cash-on-cash
- 24.91%
- DSCR
- 2.11
- GRM
- 5.2
CMA / ARV
- ARV (median comp)
- $38,742
- List price
- $69,900
- Delta
- 80.43%
- Verdict
- OVERPRICED
- Comps
- 18 within 1.0 mi
Show comp detail 5 sales within ~0.75 mi
| Address | Dist | Beds/Ba | Sqft | Sold | Price | $/sf | Match |
|---|---|---|---|---|---|---|---|
| 547 Woodbury Rd | 0.09mi | 2/1.0 | 816 (-10%) | 9mo | $94,000 | $115 | 71 |
| 4680 Londonderry Dr | 0.17mi | 3/1.0 (+1) | 935 (+3%) | 15mo | $59,997 | $64 | 69 |
| 522 Woodbury Rd | 0.15mi | 3/1.0 (+1) | 1,012 (+12%) | 1mo | $25,000 | $25 | 68 |
| 556 Robinhood Rd | 0.11mi | 3/1.0 (+1) | 960 (+6%) | 18mo | $54,900 | $57 | 66 |
| 551 Woodbury Rd | 0.08mi | 3/1.0 (+1) | 1,020 (+12%) | 16mo | $114,900 | $113 | 58 |
Match score weights: distance 35% · size 25% · config 20% · recency 20%. Top-matched comps best support the ARV.
Projected returns pro-forma
-3.0% appreciation · 2.83% rent growth · sell at horizon
- IRR
- 18.2%
- Equity multiple
- 1.73×
- Total profit
- $14,370
- Equity at exit
- $10,422
- IRR
- 26.5%
- Equity multiple
- 3.30×
- Total profit
- $45,109
- Equity at exit
- $6,044
Cash invested: $19,572 (down + closing). Projections, not guarantees.
Landlord ↔ Tenant lean methodology
- Overall (STATE)
- 90 Strongly Landlord-Friendly
- State Mississippi
- 90 Strongly Landlord-Friendly · R+11
- County
- — inherits STATE
- City
- — inherits STATE
ZIP-level market 39206
- Home prices YoY
- -10.3%
- Rents YoY
- 2.8%
- Active inventory
- 119
- Price-to-rent
- 5.2×
Monthly cashflow live
- Estimated rent
- $1,124 high interval (Pro) →
- Mortgage (P&I)
- −$367
- Tax from tax record
- −$86 /mo · $1,031/yr
- Insurance
- −$29
- HOA
- −$0
- Vacancy / Maint / Mgmt
- −$236
- Net cashflow
- $406
Break-even live
UW: 25.0% down · 7.5% · 30yr · 1.5% tax · 5.0% vac · 8.0% maint · 8.0% mgmt
Financing live
Cash to close
- Down payment
- $17,475
- Closing costs
- $2,097
- Reserves months
- —
- Total cash needed
- —
Loan-product check · same deal, 3 products live
Conventional
25% down · 7.5% · 30yr
- Down + closing
- —
- Monthly P&I
- —
- Monthly cashflow
- —
- DSCR
- —
- Eligible?
- —
Personal DTI + credit; lowest rate.
DSCR
20% down · 8.5% · 30yr
- Down + closing
- —
- Monthly P&I
- —
- Monthly cashflow
- —
- DSCR
- —
- Eligible?
- —
No personal income docs; deal must DSCR.
Hard money
10% down · 12.0% · 12mo
- Down + closing
- —
- Monthly P&I
- —
- Monthly cashflow
- —
- DSCR
- —
- Eligible?
- —
Short-term bridge; refi at stabilization.
Rent comps 18 comps
| Address | Beds | Baths | Sqft | Rent | $/sqft | DOM | Units | Dist |
|---|---|---|---|---|---|---|---|---|
| 229 Lawrence Rd #229 Jackson, MS | 2.0 | 1.0 | 840 | $995 | $1.18 | 43d | 1 | 0.46mi |
| 229 Lawrence Rd Jackson, MS | 2.0 | 1.0 | 840 | $900 | $1.07 | 23d | 1 | 0.46mi |
| 227 Lawrence Rd Jackson, MS | 1.0 | 1.0 | 840 | $900 | $1.07 | 23d | 1 | 0.46mi |
| 227 Lawrence Rd #227 Jackson, MS | 2.0 | 1.0 | 840 | $995 | $1.18 | 43d | 1 | 0.46mi |
| 227 Lawrence Rd Jackson, MS | 2.0 | 1.0 | 840 | $900 | $1.07 | 13d | 2 | 0.46mi |
| 4901 McWillie Cir Jackson, MS | 1.0–2.0 | 1.0–2.0 | 806 | $1,150 | $1.43 | 13d | 1 | 0.46mi |
| 20 N Hill Pkwy Jackson, MS | 1.0–3.0 | 1.0–2.5 | 1046 | $900 | $0.86 | 13d | 31 | 0.52mi |
| 4833 N State St Jackson, MS | 3.0 | 2.0 | 994 | $1,195 | $1.20 | 43d | 1 | 0.56mi |
| 5255 Manhattan Rd Jackson, MS | 1.0–2.0 | 1.0–2.0 | 813 | $1,100 | $1.35 | 13d | 1 | 0.66mi |
| 200 Stillwood Dr Jackson, MS | 3.0 | 2.0 | 1088 | $1,300 | $1.19 | 43d | 1 | 1.09mi |
| 200 Stillwood Dr Jackson, MS | 3.0 | 2.0 | 1088 | $1,300 | $1.19 | 13d | 1 | 1.09mi |
| 3718 Northbrook Dr Jackson, MS | 2.0 | 1.0 | 942 | $1,050 | $1.11 | 23d | 1 | 1.10mi |
| 365 W Northside Dr Jackson, MS | 1.0 | 1.0 | 550 | $899 | $1.63 | 43d | 1 | 1.16mi |
| 4426 Desoto St Jackson, MS | 3.0 | 1.0 | 1079 | $1,250 | $1.16 | 13d | 1 | 1.17mi |
| 4426 Desoto St Jackson, MS | 3.0 | 1.0 | 1079 | $1,250 | $1.16 | 23d | 1 | 1.17mi |
| 5155 Wayneland Dr Jackson, MS | 1.0–2.0 | 1.0–2.0 | 905 | $1,500 | $1.66 | 23d | 1 | 1.17mi |
| 3908 N State St Jackson, MS | 1.0 | 1.0 | 740 | $2,800 | $3.78 | 43d | 1 | 1.34mi |
| 3816 N State St Unit 3816 Jackson, MS | 1.0 | 1.0 | 700 | $1,095 | $1.56 | 43d | 1 | 1.39mi |
Listing history 22 events
-
2026-06-18days on market $69,900 Active 50 DOM
-
2026-06-17days on market $69,900 Active 49 DOM
-
2026-06-16days on market $69,900 Active 48 DOM
-
2026-06-15days on market $69,900 Active 47 DOM
-
2026-06-14days on market $69,900 Active 45 DOM
-
2026-06-13days on market $69,900 Active 44 DOM
-
2026-06-10days on market $69,900 Active 42 DOM
-
2026-06-09days on market $69,900 Active 41 DOM
-
2026-06-08days on market $69,900 Active 40 DOM
-
2026-06-07days on market $69,900 Active 39 DOM
-
2026-06-05days on market $69,900 Active 36 DOM
-
2026-06-03days on market $69,900 Active 35 DOM
-
2026-06-02days on market $69,900 Active 34 DOM
-
2026-06-01days on market $69,900 Active 33 DOM
-
2026-05-31days on market $69,900 Active 32 DOM
-
2026-05-30days on market $69,900 Active 31 DOM
-
2026-04-29$69,900 Active 700-char remark
-
2015-11-10soldstatus
-
2010-07-20soldstatus
-
1983-04-27soldstatus
-
1982-11-09soldstatus
-
1975-05-05soldstatus
ⓘ Source: listings_history table (triggers on properties + properties_extension) + one-shot
backfill from property_details.listing_events for pre-trigger history.
Tax reassessment forecast MS · Resets to sale price
- Current annual tax
- $1,031 · $86/mo
- Projected year-2 tax
- $1,031 · $86/mo
- Expected delta
- $0/yr ($0/mo · 0.0%)
ⓘ Screening estimate from a state-policy table — verify with the county assessor before closing.
Climate risk First Street
- Flood 1/10 Low FEMA zone X (unshaded) · 0% chance over 30 yrs
- Wildfire 1/10 Low
- Heat 7/10 Severe 7 d/yr ≥108°F today · 18 d/yr by 30 yrs out
- Wind 8/10 Severe 80% chance of damaging wind over 30 yrs
- Air quality 2/10 Low 0 unhealthy d/yr today · 1 by 30 yrs out
Nearby sold comps map
Loading sold comps map…
Walkable amenities ~0.75 mi
Loading nearby amenities…
Taxation est. · year 1
- Rental income
- $13,486
- − Mortgage interest
- −$3,915
- − Property taxes
- −$1,031
- − Insurance
- −$350
- − Repairs & maintenance
- −$1,079
- − Management
- −$1,079
- − Depreciation
- −$2,033
- Taxable income
- $3,999
- Est. tax owed @ 24.0%
- −$960
- After-tax cash flow
- $3,915/yr
For passive investors: Depreciation is non-cash, so a rental often shows a tax loss while cash-flowing — sheltering income. Rental losses are passive: they offset passive income freely, and up to $25,000/yr can offset ordinary (W-2) income if you actively participate and your MAGI is under $100k (phasing out to $0 by $150k); unused losses carry forward. On sale, claimed depreciation is recaptured at up to 25%, and gains may owe capital-gains tax (a 1031 exchange can defer both). Figures are a year-1 estimate at your 24.0% rate — not tax advice; consult a CPA.
Schools (NCES district)
- District
- Jackson Public School District
- NCES district ID
- 2802190
- Math proficiency
- 9% ▼ -14.00%
- Reading proficiency
- 18% ▼ -7.00%
- Median HH income
- $33,234
- Composite
- 10.89/100
- National rank
- #9755
- State rank
- #112 of 130 in MS
Livability — Jackson
- Score
- 68/100
- State rank
- #66
- US rank
- #9695
Category grades
Schools grade is shown separately in the Schools card above.
Census & demographics
- Census place
- Jackson, MS
- County
- Hinds County · 167,040 people
- City population
- 140,204
- Metro
- Jackson, MS
- Population (ZIP)
- 23,257
- Household income
- $42,686
- Rent vs Own
- Severe rent burden
- 1554.0
Population outlook (Hinds County) Hauer SSP2
- Today (2025)
- 242,528 people
- By 2030
- 241,113 · -0.6%
- By 2040
- 235,557 · -2.9%
- By 2050
- 226,946 · -6.4%
- By 2075
- 199,995 · -17.5%
- By 2100
- 164,165 · -32.3%
Race, ethnicity, and origin ACS 2023
- Neighborhood character
- Predominantly Black (85%)
- Race & ethnicity
- Black 85% White 9% Hispanic / Latino 3% Two or more races 3%
- Common ancestry
- Italian 1%
- Foreign-born
- 2% · Canada
- Languages at home
- 96% English-only · Spanish 3%
Political lean MEDSL · Hinds
- 2024 margin
- Solid D (+46.1) · D 72.4% · R 26.3% · Other 1.4%
- 2008→2024 swing
- +7.1pp toward D · 2008: 39.0pp · 2024: 46.1pp
- All cycles
- 2024: D+46.1 2020: D+48.3 2016: D+43.7 2012: D+45.1 2008: D+39.0
Not yet ingested
- Civics
- —
Market trends
- HPI YoY
- ▼ -22.38%
- Current HPI
- 194.5873
- Rent YoY
- ▲ 2.83%
- Metro
- Jackson, MS
- State GDP YoY
- —
- F500 in state
- 0
Price history
6 events — show timeline
- 2026-04-29 Listed $69,900 MLSU
- 2015-11-10 Sold (Public Records) — Public Records
- 2010-07-20 Sold (Public Records) — Public Records
- 1983-04-27 Sold (Public Records) — Public Records
- 1982-11-09 Sold (Public Records) — Public Records
- 1975-05-05 Sold (Public Records) — Public Records
Property tax history
-1.4%/yrLatest (2025): $1,031 · +1.1% YoY. Source: county tax records.
Cash-flow waterfall
monthlySold comps — $/sqft
last 12 mo · ≤1 miLoading sold comps…