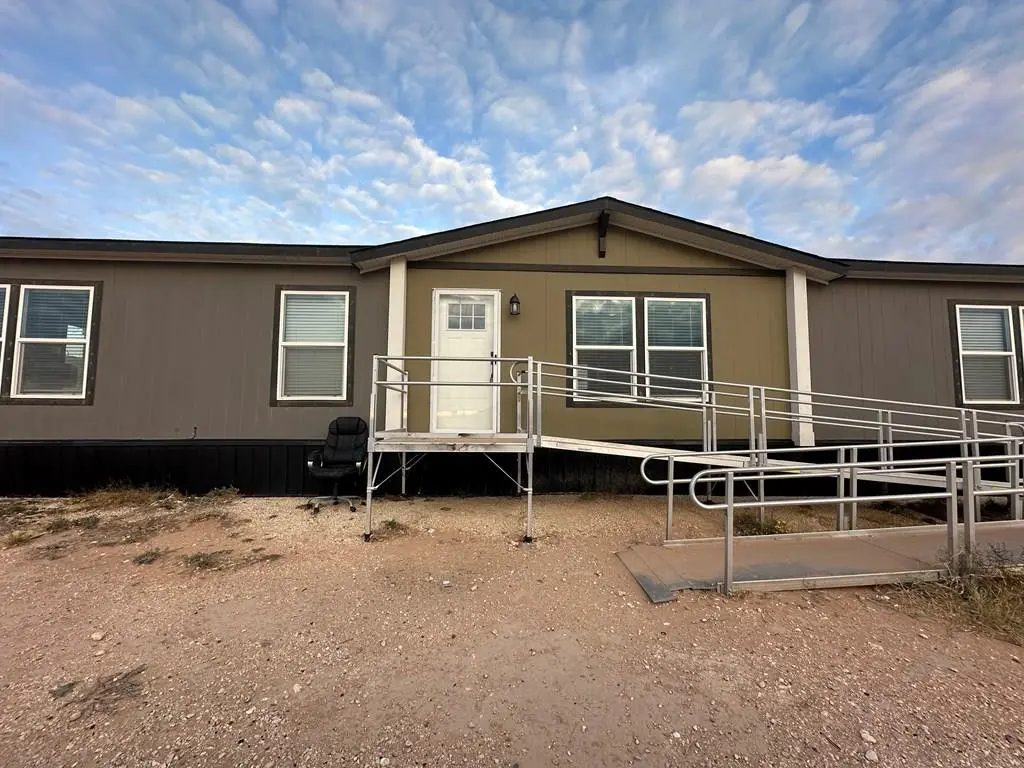
713 W 6th St · McCamey, TX
Flood risk 1/10 · Minimal
- FEMA flood zone
- —
- Chance of flooding over 30 yrs
- 0.0%
- Est. flood insurance / yr
- —
Fire risk 5/10 · Moderate
- Est. fire insurance / yr
- $1,222 – $2,270
Heat risk 7/10 · Major
- Hot days now (above 104°F)
- 6 days/yr
- Hot days in 30 yrs
- 19 days/yr
Wind risk 2/10 · Minimal
- Chance of severe wind over 30 yrs
- 2.0%
Air-quality risk 1/10 · Minimal
- Unhealthy air days now
- 0 days/yr
- Unhealthy air days in 30 yrs
- 0 days/yr
Risk factors via First Street. Map © Google.
Why this score? — see what drove the D- grade
The composite is a weighted blend of 9 inputs, each scored 0–100. Each bar is that input's sub-score; the figure is the points it added to the 100-point composite (weight × sub-score).
- ARV discount +15.0/15.0
- Cash flow +6.4/30.0
- Appreciation +5.0/10.0
- Livability +3.6/5.0
- Rent growth +2.5/5.0
- Condition / age +2.5/5.0
- Schools +2.2/10.0
- 1% rule +1.5/10.0
- DSCR +0.7/10.0
$199,900
🖨 Deal sheet (PDF) 📄 Offer letter ✓ Due diligence
Listing remarks MLS
Beautifully kept 4-bedroom, 2-bath mobile home offering two spacious living areas, one with a warm fireplace, and a private office space. Located on a corner lot and move-in ready.
Key facts
- 1 acre lot
- Built 2023
- Listed 166 days
Neighborhood map
What this means for you Summary
Snapshot
- This is a 4-bed/2.0-bath manufactured listed at $200k.
Deal economics
- At list price, monthly cash flow is $-347 ($-4k/yr) — negative.
- To cash-flow at today's rent, offer at most $139k (30.6% below list).
- To meet the 1% rule (rent ≥ 1% of price), the offer needs to be $130k (34.8% below list).
- Recommended offer: $130k (34.8% below list) — sets the bar for 1% rule.
Location & tenants
- Location reads 71/100 on livability (#322 in TX) — a middle-class / working-renter tenant base. Strengths: cost of living A+, housing A+, crime B+; Watch: health & safety C-, amenities F, commute F.
- Mccamey ISD (rural): math 24% / reading 27% proficiency, ranked #708 of 826 in TX (top 86%) — low school quality limits family demand, transient renter base, plan for 1-2y turnover.
- Zoned schools: Mccamey Pri (math 27% / reading 27%, grade F, #2,791 of 4,322 statewide, top 68%, 209 students, 76% FRL); Mccamey Middle (math 22% / reading 27%, grade F, #1,279 of 1,662 statewide, top 78%, 153 students, 67% FRL); Mccamey H S (math 34% / reading 34%, grade F, #963 of 1,632 statewide, top 61%, 143 students, 59% FRL) — zoned schools average 67% FRL vs 40% district-wide (26 pts higher); higher-poverty schools than district average — tighter screening recommended.
- Market conditions: 23 active listings in the ZIP.
Forward outlook
- In year one you build about $7k of equity ($1k loan paydown + $6k appreciation (3.0% local appreciation)).
- Upton County population projected at +44% by 2050 — long-run rental-demand tailwind backs the buy-and-hold thesis.
- By year 5, paydown + projected appreciation supports a ~$32k cash-out refi (75% LTV) — recoverable capital for the next deal without selling this one.
Negotiation context
- It's been on market 167 days — a 12% lower offer ($176k) is reasonable based on typical stale-listing flexibility.
Risks & watch-outs
- Climate carrying-cost: moderate wildfire risk; extreme-heat days projected 6→19/yr by 2055 (HVAC capex compounding) — expect insurance premiums to compound above CPI over the hold.
Questions for the listing agent
- What do current leases actually rent for vs. the listed asking? Can we see a recent rent roll and the last 12 months of T-12 income?
- It's been on market 167 days. Have you received any prior offers? Is the seller open to a 35% concession, seller financing, or rate buy-down credit?
- Why hasn't it sold? Are there any deal-killer items the seller is aware of (foundation, flood, title, zoning, code violations)?
- Is there a deadline driving the sale (1031 exchange, divorce, estate, relocation)? That informs how much negotiation room exists.
- Schools are D-rated, which usually means shorter tenancies and higher turnover. Who's the typical renter profile here, and what's been the actual vacancy rate?
- The area grade is low — what's the realistic commute time and amenity access for the typical tenant pool here? Any planned neighborhood developments (good or bad) we should know about?
- What's the average days-on-market for RENTAL listings here right now (not sales)? A rising rental-DOM trend means longer vacancies and softer asking-rent achievability than the comps imply.
- What's the recent tenant-quality profile in this submarket — average credit score on applications, eviction rate, late-payment / NSF rate, and stable-employment percentage? A property-management company in the area should have these aggregated.
- How much new for-sale + rental construction is in the pipeline within 1–3 miles? Heavy new supply typically softens prices + rents 12–24 months out; constrained supply supports both.
Investment metrics
- 1% rule
- 0.65% ✗
- Cap rate
- 4.21%
- Cash-on-cash
- -7.44%
- DSCR
- 0.67
- GRM
- 12.8
CMA / ARV
- ARV (median comp)
- $250,822
- List price
- $199,900
- Delta
- -20.30%
- Verdict
- UNDERPRICED
- Comps
- 1 within 2.0 mi
Projected returns pro-forma
3.0% appreciation · 3.0% rent growth · sell at horizon
- IRR
- 0.6%
- Equity multiple
- 1.04×
- Total profit
- $2,008
- Equity at exit
- $89,884
- IRR
- 4.4%
- Equity multiple
- 1.68×
- Total profit
- $38,158
- Equity at exit
- $138,521
Cash invested: $55,972 (down + closing). Projections, not guarantees.
Landlord ↔ Tenant lean methodology
- Overall (STATE)
- 87 Strongly Landlord-Friendly
- State Texas
- 87 Strongly Landlord-Friendly · R+5
- County
- — inherits STATE
- City
- — inherits STATE
ZIP-level market 79752
- Active inventory
- 23
- Price-to-rent
- 12.8×
Monthly cashflow live
- Estimated rent
- $1,303 medium interval (Pro) →
- Mortgage (P&I)
- −$1,048
- Tax from tax record
- −$244 /mo · $2,934/yr
- Insurance
- −$83
- HOA
- −$0
- Vacancy / Maint / Mgmt
- −$274
- Net cashflow
- $-347
Break-even live
Sensitivity live
| Price | -10% $-234 | -5% $-290 | +0% $-347 | +5% $-403 | +10% $-460 |
|---|---|---|---|---|---|
| Rent | -10% $-450 | -5% $-398 | +0% $-347 | +5% $-295 | +10% $-244 |
| Rate | -1.0pp $-246 | -0.5pp $-296 | base $-347 | +0.5pp $-399 | +1.0pp $-451 |
UW: 25.0% down · 7.5% · 30yr · 1.5% tax · 5.0% vac · 8.0% maint · 8.0% mgmt
Financing live
Cash to close
- Down payment
- $49,975
- Closing costs
- $5,997
- Reserves months
- —
- Total cash needed
- —
Loan-product check · same deal, 3 products live
Conventional
25% down · 7.5% · 30yr
- Down + closing
- —
- Monthly P&I
- —
- Monthly cashflow
- —
- DSCR
- —
- Eligible?
- —
Personal DTI + credit; lowest rate.
DSCR
20% down · 8.5% · 30yr
- Down + closing
- —
- Monthly P&I
- —
- Monthly cashflow
- —
- DSCR
- —
- Eligible?
- —
No personal income docs; deal must DSCR.
Hard money
10% down · 12.0% · 12mo
- Down + closing
- —
- Monthly P&I
- —
- Monthly cashflow
- —
- DSCR
- —
- Eligible?
- —
Short-term bridge; refi at stabilization.
Listing history 19 events
-
2026-06-21days on market $199,900 Active 167 DOM
-
2026-06-21days on market $199,900 Active 166 DOM
-
2026-06-18days on market $199,900 Active 164 DOM
-
2026-06-17days on market $199,900 Active 163 DOM
-
2026-06-16days on market $199,900 Active 162 DOM
-
2026-06-15days on market $199,900 Active 161 DOM
-
2026-06-15days on market $199,900 Active 160 DOM
-
2026-06-13days on market $199,900 Active 159 DOM
-
2026-06-12days on market $199,900 Active 158 DOM
-
2026-06-10days on market $199,900 Active 155 DOM
-
2026-06-08days on market $199,900 Active 154 DOM
-
2026-06-08days on market $199,900 Active 153 DOM
-
2026-06-05days on market $199,900 Active 151 DOM
-
2026-06-03days on market $199,900 Active 149 DOM
-
2026-06-02days on market $199,900 Active 148 DOM
-
2026-06-01days on market $199,900 Active 147 DOM
-
2026-05-31days on market $199,900 Active 146 DOM
-
2026-02-27price $199,900 180-char remark
Show marketing remark (180 chars)
Beautifully kept 4-bedroom, 2-bath mobile home offering two spacious living areas, one with a warm fireplace, and a private office space. Located on a corner lot and move-in ready.
-
2026-01-05$225,000 Active 180-char remark
Show marketing remark (180 chars)
Beautifully kept 4-bedroom, 2-bath mobile home offering two spacious living areas, one with a warm fireplace, and a private office space. Located on a corner lot and move-in ready.
ⓘ Source: listings_history table (triggers on properties + properties_extension) + one-shot
backfill from property_details.listing_events for pre-trigger history.
Tax reassessment forecast TX · Resets to sale price
- Current annual tax
- $2,934 · $244/mo
- Projected year-2 tax
- $3,658 · $305/mo
- Expected delta
- +$725/yr (+$60/mo · 24.7%)
ⓘ Screening estimate from a state-policy table — verify with the county assessor before closing.
Climate risk First Street
- Flood 1/10 Low 0% chance over 30 yrs
- Wildfire 5/10 Major
- Heat 7/10 Severe 6 d/yr ≥104°F today · 19 d/yr by 30 yrs out
- Wind 2/10 Low 2% chance of damaging wind over 30 yrs
- Air quality 1/10 Low 0 unhealthy d/yr today · 0 by 30 yrs out
Nearby sold comps map
Loading sold comps map…
Walkable amenities ~0.75 mi
Loading nearby amenities…
Taxation est. · year 1
- Rental income
- $15,634
- − Mortgage interest
- −$11,198
- − Property taxes
- −$2,934
- − Insurance
- −$1,000
- − Repairs & maintenance
- −$1,251
- − Management
- −$1,251
- − Depreciation
- −$5,815
- Taxable loss
- −$7,813
- Est. tax savings @ 24.0%
- +$1,875
- After-tax cash flow
- $-2,287/yr
For passive investors: Depreciation is non-cash, so a rental often shows a tax loss while cash-flowing — sheltering income. Rental losses are passive: they offset passive income freely, and up to $25,000/yr can offset ordinary (W-2) income if you actively participate and your MAGI is under $100k (phasing out to $0 by $150k); unused losses carry forward. On sale, claimed depreciation is recaptured at up to 25%, and gains may owe capital-gains tax (a 1031 exchange can defer both). Figures are a year-1 estimate at your 24.0% rate — not tax advice; consult a CPA.
Schools (NCES district)
- District
- Mccamey ISD
- NCES district ID
- 4829700
- Math proficiency
- 24% ▼ -12.00%
- Reading proficiency
- 27% ▼ -9.00%
- Median HH income
- $43,461
- Composite
- 21.84/100
- National rank
- #8242
- State rank
- #708 of 826 in TX
Livability — McCamey
- Score
- 71/100
- State rank
- #322
- US rank
- #7122
Category grades
Schools grade is shown separately in the Schools card above.
Census & demographics
- Census place
- McCamey, TX
- Population (ZIP)
- 1,880
Population outlook (Upton County) Hauer SSP2
- Today (2025)
- 4,105 people
- By 2030
- 4,362 · +6.3%
- By 2040
- 5,086 · +23.9%
- By 2050
- 5,892 · +43.5%
- By 2075
- 7,784 · +89.6%
- By 2100
- 8,962 · +118.3%
Race, ethnicity, and origin ACS 2023
- Neighborhood character
- Predominantly Hispanic (72%)
- Race & ethnicity
- Hispanic / Latino 72% White 26% Two or more races 8% Black 1%
- Hispanic origin (detail)
- Mexican 67% Puerto Rican 5%
- Common ancestry
- Iranian 1% Scottish 1%
- Foreign-born
- 11% · Canada
- Languages at home
- 49% English-only · Spanish 51%
Political lean MEDSL · Upton
- 2024 margin
- Solid R (+77.0) · D 11.2% · R 88.2%
- 2008→2024 swing
- -26.0pp toward R · 2008: -51.0pp · 2024: -77.0pp
- All cycles
- 2024: R+77.0 2020: R+73.7 2016: R+52.2 2012: R+47.8 2008: R+51.0
Not yet ingested
- Civics
- —
Market trends
- HPI YoY
- —
- Current HPI
- —
- Rent YoY
- —
- Metro
- —
- State GDP YoY
- ▲ 3.95%
- F500 in state
- 110
Industry mix (Fortune 500 HQ in TX)
| Industry | F500 HQs | Revenue |
|---|---|---|
| Energy | 16 | $1,198B |
|
||
| Technology | 5 | $198B |
|
||
| Engineering / Construction | 4 | $72B |
|
||
| Energy Services | 3 | $60B |
|
||
| Utilities | 3 | $41B |
|
||
| Healthcare | 2 | $330B |
|
||
Price history
-11.2% since first listed2 events — show timeline
- 2026-02-27 Price Changed $199,900 ODMLS
- 2026-01-05 Listed $225,000 ODMLS
Property tax history
+45.5%/yrLatest (2025): $2,934 · +4.7% YoY. Source: county tax records.
Cash-flow waterfall
monthlySold comps — $/sqft
last 12 mo · ≤1 miLoading sold comps…