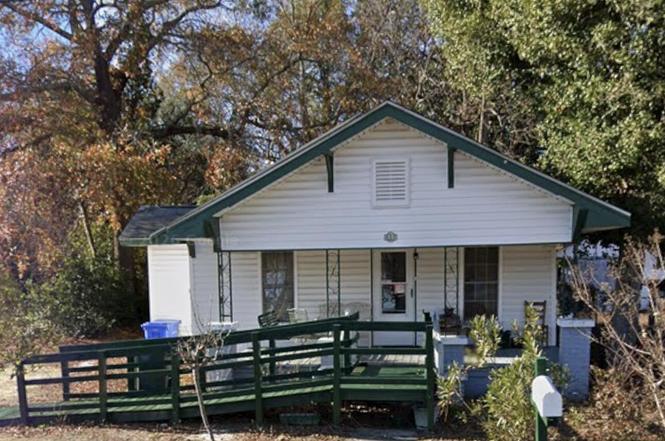
1086 Center St · Fayetteville, NC
Flood risk 1/10 · Minimal
- FEMA flood zone
- X (unshaded)
- Chance of flooding over 30 yrs
- 0.0%
- Est. flood insurance / yr
- $507 – $1,088
Fire risk 5/10 · Moderate
- Est. fire insurance / yr
- $906 – $1,684
Heat risk 7/10 · Major
- Hot days now (above 106°F)
- 7 days/yr
- Hot days in 30 yrs
- 16 days/yr
Wind risk 7/10 · Major
- Chance of severe wind over 30 yrs
- 78.0%
Air-quality risk 1/10 · Minimal
- Unhealthy air days now
- 0 days/yr
- Unhealthy air days in 30 yrs
- 0 days/yr
Risk factors via First Street. Map © Google.
Why this score? — see what drove the B+ grade
The composite is a weighted blend of 9 inputs, each scored 0–100. Each bar is that input's sub-score; the figure is the points it added to the 100-point composite (weight × sub-score).
- Cash flow +30.0/30.0
- ARV discount +15.0/15.0
- 1% rule +10.0/10.0
- DSCR +10.0/10.0
- Livability +3.8/5.0
- Schools +3.1/10.0
- Rent growth +2.7/5.0
- Condition / age +2.5/5.0
- Appreciation +0.0/10.0
$70,000
🖨 Deal sheet 📄 Offer letter ✓ Due diligence
Listing remarks
Welcome home to this 3 bedroom, 1 bath property offering 1,258 square feet of comfortable living space in Fayetteville, NC. This property has seen several key updates within the past four years, making it a solid option for homeowners or investors alike. The kitchen features newer cabinets, updated Formica countertops with a marble-look finish, a newer sink, and appliances including a stove approximately six years old and a refrigerator approximately eight years old. The home also benefits from replacement windows installed four years ago and a water heater replaced around the same time. Interior updates include fresh paint throughout completed four years ago, newer carpet in the living and
Key facts
- Newer cabinets
- Fresh paint
- Newer sink
Tags
Property features AI
Finance
- Other: Zoning: SF6
- HOA & community: No homeowners association
Exterior
- Utilities: Public water; Public sewer
- Home design: Single-story house; Vinyl siding
- Construction: Vinyl siding construction; Shingle roof
- Exterior features: Shingle roof; Lot approximately 0.15 acres; Public maintained road access
Interior
- Bedrooms: 3 bedrooms (all on the main level)
- Flooring: Carpet; Luxury vinyl
- Bathrooms: 1 full bathroom
- Heating & cooling: Central heating; Central air conditioning
- Interior features: Carpet and luxury vinyl flooring
Neighborhood map
What this means for you Summary
Snapshot
- This is a 2-bed/1.0-bath single-family listed at $70k.
Deal economics
- At list price, monthly cash flow is $470 ($6k/yr) — positive.
- The deal already cash-flows at list — no discount required.
- Meets the 1% rule at list price ($1k rent vs $70k).
- Recommended offer: $68k (3.0% below list) — sets the bar for market timing.
- Cap rate 14.3% vs local median 4.9% in Fayetteville — top-decile yield for the area; either an underpriced asset or a hidden risk that comps aren't pricing in. Stress-test before assuming the spread holds.
Location & tenants
- Location reads 75/100 on livability (#45 in NC, #4,031 nationally) — a middle-class / working-renter tenant base. Strengths: commute A+, cost of living A+, housing A+; Watch: schools C-, crime F, employment D-.
- Cumberland County Schools (urban): math 32% / reading 41% proficiency, ranked #126 of 178 in NC (top 71%) — families likely to look elsewhere, expect single-tenant / working-renter base with shorter leases.
- Market conditions: Rents flat; 401 active listings in the ZIP; 6 comparable units currently listed for rent nearby; rentals at typical pace (median 23d on market — plan ~3-4 weeks tenant-placement turnaround); 1,125 units permitted in Cumberland County in 2024 (104 in 5+ unit buildings).
Forward outlook
- Local home prices are declining (-3.0%/yr); year-one equity from $484 of loan paydown is wiped out by about $2k of value loss. Plan a longer hold.
- At projected returns (-3.0% appreciation + 0.9% rent growth), your $20k cash investment doubles in ~5 years — after that, you're playing with house money.
Negotiation context
- It's been on market 36 days — a 3% lower offer ($68k) is reasonable based on typical stale-listing flexibility.
- 2 sale attempts; this cycle's ask has dropped $40k (36%) from the opening price — seller is motivated, your offer sets the floor, not the list.
Risks & watch-outs
- Climate carrying-cost: major wind risk, 78% chance of damaging wind over 30y; moderate wildfire risk; extreme-heat days projected 7→16/yr by 2055 (HVAC capex compounding) — expect insurance premiums to compound above CPI over the hold.
Questions for the listing agent
- It's been on market 36 days. Have you received any prior offers? Is the seller open to a 3% concession, seller financing, or rate buy-down credit?
- Built in 1978 — when were the roof, HVAC, electrical panel, plumbing, and water heater last replaced?
- Is there a deadline driving the sale (1031 exchange, divorce, estate, relocation)? That informs how much negotiation room exists.
- Crime grade is F in this area — have there been break-ins, vandalism, or insurance claims at this property in the last 3 years? What carrier currently insures it and at what premium?
- What's the average days-on-market for RENTAL listings here right now (not sales)? A rising rental-DOM trend means longer vacancies and softer asking-rent achievability than the comps imply.
- What's the recent tenant-quality profile in this submarket — average credit score on applications, eviction rate, late-payment / NSF rate, and stable-employment percentage? A property-management company in the area should have these aggregated.
- How much new for-sale + rental construction is in the pipeline within 1–3 miles? Heavy new supply typically softens prices + rents 12–24 months out; constrained supply supports both.
Investment metrics
- 1% rule
- 1.72% ✓
- Cap rate
- 14.35%
- Cash-on-cash
- 28.77%
- DSCR
- 2.28
- GRM
- 4.8
CMA / ARV
- ARV (on-the-fly)
- $115,128
- Comps found
- 8
Show comp detail 8 sales within ~0.75 mi
| Address | Dist | Beds/Ba | Sqft | Sold | Price | $/sf | Match |
|---|---|---|---|---|---|---|---|
| 1101 Center St | 0.04mi | 2/1.0 | 1,062 (+8%) | 16mo | $119,750 | $113 | 71 |
| 1930 Southern Ave | 0.32mi | 2/1.0 | 996 (+1%) | 20mo | $149,000 | $150 | 66 |
| 100 Spencer St | 0.63mi | 3/2.0 (+1) | 1,000 (+2%) | 1mo | $55,000 | $55 | 58 |
| 1219 Camden Rd | 0.43mi | 2/1.0 | 915 (-7%) | 16mo | $107,000 | $117 | 55 |
| 115 Pitt St | 0.25mi | 2/2.0 | 1,103 (+12%) | 11mo | $132,000 | $120 | 55 |
| 2018 Center St | 0.41mi | 3/1.0 (+1) | 900 (-8%) | 11mo | $73,000 | $81 | 53 |
| 1215 Camden Rd | 0.43mi | 3/1.0 (+1) | 1,064 (+8%) | 15mo | $110,000 | $103 | 48 |
| 2111 Burnett Ave | 0.55mi | 3/1.0 (+1) | 877 (-11%) | 22mo | $173,000 | $197 | 33 |
Match score weights: distance 35% · size 25% · config 20% · recency 20%. Top-matched comps best support the ARV.
Projected returns pro-forma
-3.0% appreciation · 0.9% rent growth · sell at horizon
- IRR
- 20.7%
- Equity multiple
- 1.82×
- Total profit
- $16,110
- Equity at exit
- $10,437
- IRR
- 27.4%
- Equity multiple
- 3.19×
- Total profit
- $42,831
- Equity at exit
- $6,052
Cash invested: $19,600 (down + closing). Projections, not guarantees.
Landlord ↔ Tenant lean methodology
- Overall (STATE)
- 85 Strongly Landlord-Friendly
- State North Carolina
- 85 Strongly Landlord-Friendly · R+3
- County
- — inherits STATE
- City
- — inherits STATE
ZIP-level market 28306
- Home prices YoY
- -17.7%
- Rents YoY
- 0.9%
- Active inventory
- 401
- Price-to-rent
- 4.8×
Monthly cashflow live
- Estimated rent
- $1,204 high interval (Pro) →
- Mortgage (P&I)
- −$367
- Tax from tax record
- −$85 /mo · $1,016/yr
- Insurance
- −$29
- HOA
- −$0
- Vacancy / Maint / Mgmt
- −$253
- Net cashflow
- $470
Break-even live
UW: 25.0% down · 7.5% · 30yr · 1.5% tax · 5.0% vac · 8.0% maint · 8.0% mgmt
Financing live
Cash to close
- Down payment
- $17,500
- Closing costs
- $2,100
- Reserves months
- —
- Total cash needed
- —
Loan-product check · same deal, 3 products live
Conventional
25% down · 7.5% · 30yr
- Down + closing
- —
- Monthly P&I
- —
- Monthly cashflow
- —
- DSCR
- —
- Eligible?
- —
Personal DTI + credit; lowest rate.
DSCR
20% down · 8.5% · 30yr
- Down + closing
- —
- Monthly P&I
- —
- Monthly cashflow
- —
- DSCR
- —
- Eligible?
- —
No personal income docs; deal must DSCR.
Hard money
10% down · 12.0% · 12mo
- Down + closing
- —
- Monthly P&I
- —
- Monthly cashflow
- —
- DSCR
- —
- Eligible?
- —
Short-term bridge; refi at stabilization.
Rent comps 6 comps
| Address | Beds | Baths | Sqft | Rent | $/sqft | DOM | Units | Dist |
|---|---|---|---|---|---|---|---|---|
| 108 Pitt St Fayetteville, NC | 1.0 | 1.0 | 800 | $750 | $0.94 | 13d | 1 | 0.26mi |
| 2123 Burnett Ave Fayetteville, NC | 3.0 | 2.0 | 1100 | $1,600 | $1.45 | 23d | 1 | 0.62mi |
| 1347 Levy Dr Fayetteville, NC | 3.0 | 1.0 | 999 | $1,000 | $1.00 | 23d | 1 | 1.22mi |
| 718 Dwain Dr Fayetteville, NC | 3.0 | 1.0 | 962 | $1,250 | $1.30 | 23d | 1 | 1.31mi |
| 122 Oak St Fayetteville, NC | 2.0 | 2.0 | 1000 | $1,000 | $1.00 | 23d | 1 | 1.42mi |
| 126 Oak St Fayetteville, NC | 2.0 | 2.0 | 1000 | $1,000 | $1.00 | 23d | 1 | 1.42mi |
Listing history 9 events
-
2026-05-30statusdays on market $70,000 Pending 36 DOM
-
2026-05-22price $70,000
-
2026-05-20price $80,000
-
2026-05-13price $85,000
-
2026-05-06status Active
-
2026-05-06price $89,900
-
2026-01-27status Pending
-
2026-01-21price $99,900
-
2026-01-15$110,000 Active
ⓘ Source: listings_history table (triggers on properties + properties_extension) + one-shot
backfill from property_details.listing_events for pre-trigger history.
Tax reassessment forecast NC · Resets to sale price
- Current annual tax
- $1,016 · $85/mo
- Projected year-2 tax
- $1,016 · $85/mo
- Expected delta
- $0/yr ($0/mo · 0.0%)
ⓘ Screening estimate from a state-policy table — verify with the county assessor before closing.
Climate risk First Street
- Flood 1/10 Low FEMA zone X (unshaded) · 0% chance over 30 yrs
- Wildfire 5/10 Major
- Heat 7/10 Severe 7 d/yr ≥106°F today · 16 d/yr by 30 yrs out
- Wind 7/10 Severe 78% chance of damaging wind over 30 yrs
- Air quality 1/10 Low 0 unhealthy d/yr today · 0 by 30 yrs out
Nearby sold comps map
Loading sold comps map…
Walkable amenities ~0.75 mi
Loading nearby amenities…
Taxation est. · year 1
- Rental income
- $14,442
- − Mortgage interest
- −$3,921
- − Property taxes
- −$1,016
- − Insurance
- −$350
- − Repairs & maintenance
- −$1,155
- − Management
- −$1,155
- − Depreciation
- −$2,036
- Taxable income
- $4,808
- Est. tax owed @ 24.0%
- −$1,154
- After-tax cash flow
- $4,485/yr
For passive investors: Depreciation is non-cash, so a rental often shows a tax loss while cash-flowing — sheltering income. Rental losses are passive: they offset passive income freely, and up to $25,000/yr can offset ordinary (W-2) income if you actively participate and your MAGI is under $100k (phasing out to $0 by $150k); unused losses carry forward. On sale, claimed depreciation is recaptured at up to 25%, and gains may owe capital-gains tax (a 1031 exchange can defer both). Figures are a year-1 estimate at your 24.0% rate — not tax advice; consult a CPA.
Schools (NCES district)
- District
- Cumberland County Schools
- NCES district ID
- 3700011
- Math proficiency
- 32% ▼ -2.00%
- Reading proficiency
- 41% ▼ -1.00%
- Median HH income
- $44,168
- Composite
- 31.0/100
- National rank
- #6096
- State rank
- #126 of 178 in NC
Livability — Fayetteville
- Score
- 75/100
- State rank
- #45
- US rank
- #4031
Category grades
Schools grade is shown separately in the Schools card above.
Census & demographics
- Census place
- Fayetteville, NC
- County
- Cumberland County · 265,314 people
- City population
- 226,118
- Metro
- Fayetteville, NC
- Population (ZIP)
- 43,042
- Household income
- $67,544
- Rent vs Own
- Severe rent burden
- 1386.0
Population outlook (Cumberland County) Hauer SSP2
- Today (2025)
- 330,855 people
- By 2030
- 333,523 · +0.8%
- By 2040
- 335,583 · +1.4%
- By 2050
- 335,325 · +1.4%
- By 2075
- 342,853 · +3.6%
- By 2100
- 340,698 · +3.0%
Race, ethnicity, and origin ACS 2023
- Neighborhood character
- Diverse neighborhood (Simpson 0.68)
- Race & ethnicity
- White 44% Black 33% Hispanic / Latino 13% Two or more races 8% Asian 4% Native American 2%
- Hispanic origin (detail)
- Mexican 5% Puerto Rican 5%
- Common ancestry
- Italian 2% Slovak 1% Serbian 1%
- Foreign-born
- 8% · Canada, South Korea, Jamaica
- Languages at home
- 87% English-only · Spanish 9% Other Indo-European 1% French/Haitian/Cajun 1%
Political lean MEDSL · Cumberland
- 2024 margin
- D (+13.4) · D 56.1% · R 42.7% · Other 1.2%
- 2008→2024 swing
- -4.3pp toward R · 2008: 17.7pp · 2024: 13.4pp
- All cycles
- 2024: D+13.4 2020: D+16.6 2016: D+16.0 2012: D+19.7 2008: D+17.7
Not yet ingested
- Civics
- —
Market trends
- HPI YoY
- ▼ -51.69%
- Current HPI
- 239.7281
- Rent YoY
- ▲ 0.90%
- Metro
- Fayetteville, NC
- State GDP YoY
- ▲ 3.28%
- F500 in state
- 26
Industry mix (Fortune 500 HQ in NC)
| Industry | F500 HQs | Revenue |
|---|---|---|
| Financial Services | 2 | $213B |
|
||
| Retail | 2 | $95B |
|
||
| Industrial Conglomerate | 1 | $38B |
|
||
| Metals / Steel | 1 | $35B |
|
||
| Utilities | 1 | $30B |
|
||
| Industrial Machinery | 1 | $19B |
|
||
Price history
-36.4% since first listed8 events — show timeline
- 2026-05-22 Price Changed $70,000 TMLS
- 2026-05-20 Price Changed $80,000 TMLS
- 2026-05-13 Price Changed $85,000 TMLS
- 2026-05-06 Relisted — TMLS
- 2026-05-06 Price Changed $89,900 TMLS
- 2026-01-27 Pending — TMLS
- 2026-01-21 Price Changed $99,900 TMLS
- 2026-01-15 Listed $110,000 TMLS
Property tax history
+10.4%/yrLatest (2025): $1,016 · +107.2% YoY. Source: county tax records.
Cash-flow waterfall
monthlySold comps — $/sqft
last 12 mo · ≤1 miLoading sold comps…