 Duplex
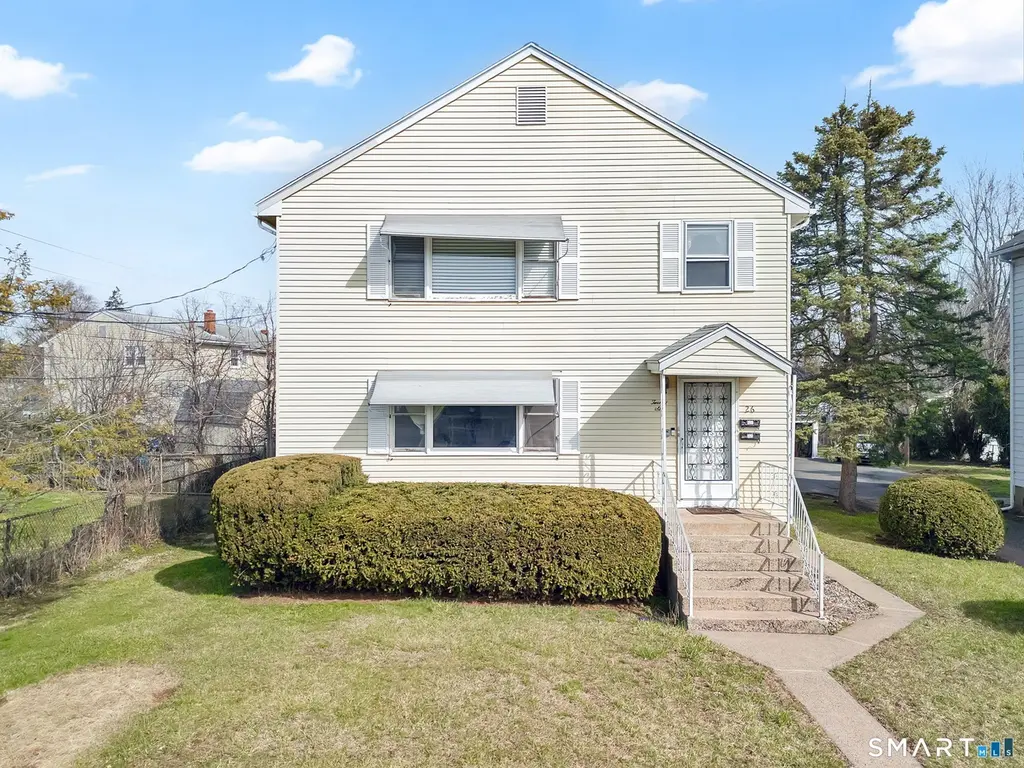
26 Upton St · New Britain, CT
Flood risk 1/10 · Minimal
- FEMA flood zone
- X (unshaded)
- Chance of flooding over 30 yrs
- 0.0%
- Est. flood insurance / yr
- $473 – $860
Fire risk 1/10 · Minimal
- Est. fire insurance / yr
- $829 – $1,539
Heat risk 5/10 · Moderate
- Hot days now (above 97°F)
- 7 days/yr
- Hot days in 30 yrs
- 15 days/yr
Wind risk 6/10 · Moderate
- Chance of severe wind over 30 yrs
- 27.0%
Air-quality risk 3/10 · Minor
- Unhealthy air days now
- 2 days/yr
- Unhealthy air days in 30 yrs
- 3 days/yr
Risk factors via First Street. Map © Google.
Why this score? — see what drove the C- grade
The composite is a weighted blend of 9 inputs, each scored 0–100. Each bar is that input's sub-score; the figure is the points it added to the 100-point composite (weight × sub-score).
- Cash flow +14.6/30.0
- ARV discount +11.7/15.0
- Appreciation +10.0/10.0
- DSCR +4.5/10.0
- 1% rule +4.2/10.0
- Livability +3.7/5.0
- Condition / age +2.5/5.0
- Rent growth +2.4/5.0
- Schools +1.0/10.0
$419,000
🖨 Deal sheet 📄 Offer letter ✓ Due diligence
Multi-family units
County records classify this as Multi-Family (2-4 Unit). Listing-text estimate: 2 units. confirmed
Listing remarks MLS
Fabulous opportunity here in this spacious two family home. Each floor boasts 3 bedrooms and full bath, open kitchen and large family room. Each unit is over 100sq/ft. Ample parking (2 year old driveway) plenty of storage in the basement and potential for 3rd rental unit. New water heater, oil tanks, outside stairs, recently renovated 2nd floor. Short distance to schools, shopping and major roads and highways.
Key facts
- 6,969 sq ft lot
- 4 parking spots
- Built 1974
Neighborhood map
What this means for you Summary
Snapshot
- This is a 2 × 3-bed/1.0-bath units multifamily listed at $419k.
Deal economics
- At list price, monthly cash flow is $99 ($1k/yr) — positive. Per door: $49/mo.
- The deal already cash-flows at list — no discount required.
- To meet the 1% rule (rent ≥ 1% of price), the offer needs to be $385k (8.1% below list).
- Recommended offer: $385k (8.1% below list) — sets the bar for 1% rule.
- Cap rate 6.6% vs local median 4.4% in New Britain — top-decile yield for the area; either an underpriced asset or a hidden risk that comps aren't pricing in. Stress-test before assuming the spread holds.
Location & tenants
- Location reads 74/100 on livability (#67 in CT, #4,936 nationally) — a middle-class / working-renter tenant base. Strengths: health & safety A+, cost of living A, housing A; Watch: crime D, employment D, schools F.
- New Britain School District (suburban): math 6% / reading 17% proficiency, ranked #153 of 153 in CT (top 100%) — low school quality limits family demand, transient renter base, plan for 1-2y turnover; 71% free/reduced lunch — lower-income household profile, screen leases tightly.
- Market conditions: Rents soft (-0.6%/yr); 63 active listings in the ZIP; 1,867 units permitted in Capitol Planning Region in 2024 (1,399 in 5+ unit buildings).
- At $3,852/mo this rent would consume 91% of the median local household income ($51k/yr) (locally 2100% of renters already pay >50% of income on rent) — very limited rent-growth headroom before tenants either downsize or default.
Forward outlook
- In year one you build about $45k of equity ($3k loan paydown + $42k appreciation (10.0% local appreciation)).
- At projected returns (10.0% appreciation + 0.0% rent growth), your $117k cash investment doubles in ~3 years — after that, you're playing with house money.
- By year 2, paydown + projected appreciation supports a ~$72k cash-out refi (75% LTV) — recoverable capital for the next deal without selling this one.
Negotiation context
- Only 6 days on market — expect competitive offers; lowballing is unlikely to land.
- 4 sale attempts since 12y ago with the ask held roughly flat each time — persistent listings suggest the price (not the market) is what's stuck; bring a comps-based counter.
- Current owner paid $264k; list at $419k implies a 59% gain — meaningful room to come down on a strong offer.
Risks & watch-outs
- Climate carrying-cost: major wind risk, 27% chance of damaging wind over 30y; extreme-heat days projected 7→15/yr by 2055 (HVAC capex compounding) — expect insurance premiums to compound above CPI over the hold.
Questions for the listing agent
- Can we see the unit-by-unit rent roll, current vacancy, and any below-market leases? What's the average tenancy length?
- What capital expenditures (roof, boiler, parking lot, exteriors) have been made in the last 5 years, and what's planned in the next 2?
- Built in 1974 — when were the roof, HVAC, electrical panel, plumbing, and water heater last replaced?
- Is there a deadline driving the sale (1031 exchange, divorce, estate, relocation)? That informs how much negotiation room exists.
- Schools are F-rated, which usually means shorter tenancies and higher turnover. Who's the typical renter profile here, and what's been the actual vacancy rate?
- Crime grade is D in this area — have there been break-ins, vandalism, or insurance claims at this property in the last 3 years? What carrier currently insures it and at what premium?
- What's the average days-on-market for RENTAL listings here right now (not sales)? A rising rental-DOM trend means longer vacancies and softer asking-rent achievability than the comps imply.
- What's the recent tenant-quality profile in this submarket — average credit score on applications, eviction rate, late-payment / NSF rate, and stable-employment percentage? A property-management company in the area should have these aggregated.
- How much new apartment / multifamily construction is in the pipeline within 1–3 miles? Heavy new supply (>2% of stock underway) typically softens rents 12–24 months out; light construction supports rent growth.
Investment metrics
- 1% rule
- 0.92% ✗
- Cap rate
- 6.58%
- Cash-on-cash
- 1.01%
- DSCR
- 1.05
- GRM
- 9.1
CMA / ARV
- ARV (on-the-fly)
- $462,336
- Comps found
- 12
Show comp detail 12 sales within ~0.75 mi
| Address | Dist | Beds/Ba | Sqft | Sold | Price | $/sf | Match |
|---|---|---|---|---|---|---|---|
| 26 Upton St | 0.00mi | 6/2.0 | 2,688 (0%) | 1mo | $443,000 | $165 | 99 |
| 31 Roosevelt St | 0.30mi | 6/2.0 | 2,600 (-3%) | 8mo | $430,000 | $165 | 74 |
| 80 Collins St | 0.48mi | 6/3.0 | 2,610 (-3%) | 1mo | $507,000 | $194 | 68 |
| 17 Pike St | 0.16mi | 6/3.0 | 2,418 (-10%) | 7mo | $375,000 | $155 | 66 |
| 411 Ellis St | 0.53mi | 5/3.0 (-1) | 2,688 (0%) | 2mo | $450,000 | $167 | 65 |
| 112 Austin St | 0.58mi | 6/3.0 | 2,766 (+3%) | 1mo | $485,000 | $175 | 63 |
| 5 Whitman St | 0.46mi | 6/2.0 | 2,540 (-6%) | 10mo | $452,000 | $178 | 61 |
| 23 Edward St | 0.52mi | 6/3.0 | 2,482 (-8%) | 4mo | $360,000 | $145 | 55 |
| 25 William St | 0.44mi | 6/3.0 | 2,496 (-7%) | 18mo | $415,000 | $166 | 49 |
| 241 Belden St | 0.73mi | 6/2.0 | 2,332 (-13%) | 13mo | $436,000 | $187 | 33 |
| 115 Belden St | 0.75mi | 6/2.0 | 2,326 (-14%) | 15mo | $700,000 | $301 | 31 |
| 237 Belden St | 0.73mi | 6/2.0 | 2,332 (-13%) | 18mo | $400,000 | $172 | 29 |
Match score weights: distance 35% · size 25% · config 20% · recency 20%. Top-matched comps best support the ARV.
Projected returns pro-forma
10.0% appreciation · 0.0% rent growth · sell at horizon
- IRR
- 24.0%
- Equity multiple
- 2.90×
- Total profit
- $223,301
- Equity at exit
- $377,468
- IRR
- 20.6%
- Equity multiple
- 6.39×
- Total profit
- $632,589
- Equity at exit
- $814,025
Cash invested: $117,320 (down + closing). Projections, not guarantees.
Landlord ↔ Tenant lean methodology
- Overall (STATE)
- 27 Tenant-Leaning
- State Connecticut
- 27 Tenant-Leaning · D+7
- County
- — inherits STATE
- City
- — inherits STATE
ZIP-level market 06051
- Home prices YoY
- 9.0%
- Rents YoY
- -0.6%
- Active inventory
- 63
- Price-to-rent
- 18.1×
Monthly cashflow live
- Estimated rent
- $3,852 high interval (Pro) →
- Mortgage (P&I)
- −$2,197
- Tax from tax record
- −$572 /mo · $6,867/yr
- Insurance
- −$175
- HOA
- −$0
- Vacancy / Maint / Mgmt
- −$809
- Net cashflow
- $99
Break-even live
2-unit breakdown (identical units grouped — click to expand)
| Units | Beds | Baths | Est. rent |
|---|---|---|---|
| 2× units | 3 | 1 | $3,852 |
| #1 | 3 | 1 | $1,926 |
| #2 | 3 | 1 | $1,926 |
| Total (2 units) | $3,852 | ||
UW: 25.0% down · 7.5% · 30yr · 1.5% tax · 5.0% vac · 8.0% maint · 8.0% mgmt
Financing live
Cash to close
- Down payment
- $104,750
- Closing costs
- $12,570
- Reserves months
- —
- Total cash needed
- —
Loan-product check · same deal, 3 products live
Conventional
25% down · 7.5% · 30yr
- Down + closing
- —
- Monthly P&I
- —
- Monthly cashflow
- —
- DSCR
- —
- Eligible?
- —
Personal DTI + credit; lowest rate.
DSCR
20% down · 8.5% · 30yr
- Down + closing
- —
- Monthly P&I
- —
- Monthly cashflow
- —
- DSCR
- —
- Eligible?
- —
No personal income docs; deal must DSCR.
Hard money
10% down · 12.0% · 12mo
- Down + closing
- —
- Monthly P&I
- —
- Monthly cashflow
- —
- DSCR
- —
- Eligible?
- —
Short-term bridge; refi at stabilization.
Listing history 12 events
-
2026-04-01status Under Contract
-
2026-03-27$419,000 Active
-
2026-03-26historical $419,000
-
2025-02-20historical $2,400
-
2025-02-14$2,400
-
2021-02-10soldstatus $264,000
-
2021-02-04soldstatus $264,000 Closed 413-char remark
Show marketing remark (413 chars)
Fabulous opportunity here in this spacious two family home. Each floor boasts 3 bedrooms and full bath, open kitchen and large family room. Each unit is over 100sq/ft. Ample parking (2 year old driveway) plenty of storage in the basement and potential for 3rd rental unit. New water heater, oil tanks, outside stairs, recently renovated 2nd floor. Short distance to schools, shopping and major roads and highways.
-
2020-11-28historical Under Contract - Continue to Show 413-char remark
Show marketing remark (413 chars)
Fabulous opportunity here in this spacious two family home. Each floor boasts 3 bedrooms and full bath, open kitchen and large family room. Each unit is over 100sq/ft. Ample parking (2 year old driveway) plenty of storage in the basement and potential for 3rd rental unit. New water heater, oil tanks, outside stairs, recently renovated 2nd floor. Short distance to schools, shopping and major roads and highways.
-
2020-11-05$279,900 Active 413-char remark
Show marketing remark (413 chars)
Fabulous opportunity here in this spacious two family home. Each floor boasts 3 bedrooms and full bath, open kitchen and large family room. Each unit is over 100sq/ft. Ample parking (2 year old driveway) plenty of storage in the basement and potential for 3rd rental unit. New water heater, oil tanks, outside stairs, recently renovated 2nd floor. Short distance to schools, shopping and major roads and highways.
-
2014-09-26soldstatus $165,000
-
2014-09-25soldstatus $165,000 110-char remark
Show marketing remark (110 chars)
Great investment or owner occupied property. Each unit offers 3 bedrooms, eat-in kitchens, separate utilities.
-
2014-07-22$174,900 110-char remark
Show marketing remark (110 chars)
Great investment or owner occupied property. Each unit offers 3 bedrooms, eat-in kitchens, separate utilities.
ⓘ Source: listings_history table (triggers on properties + properties_extension) + one-shot
backfill from property_details.listing_events for pre-trigger history.
Tax reassessment forecast CT · Partial reset (capped growth)
- Current annual tax
- $6,867 · $572/mo
- Projected year-2 tax
- $7,917 · $660/mo
- Expected delta
- +$1,050/yr (+$87/mo · 15.3%)
ⓘ Screening estimate from a state-policy table — verify with the county assessor before closing.
Climate risk First Street
- Flood 1/10 Low FEMA zone X (unshaded) · 0% chance over 30 yrs
- Wildfire 1/10 Low
- Heat 5/10 Major 7 d/yr ≥97°F today · 15 d/yr by 30 yrs out
- Wind 6/10 Major 27% chance of damaging wind over 30 yrs
- Air quality 3/10 Moderate 2 unhealthy d/yr today · 3 by 30 yrs out
Nearby sold comps map
Loading sold comps map…
Walkable amenities ~0.75 mi
Loading nearby amenities…
Taxation est. · year 1
- Rental income
- $46,224
- − Mortgage interest
- −$23,471
- − Property taxes
- −$6,867
- − Insurance
- −$2,095
- − Repairs & maintenance
- −$3,698
- − Management
- −$3,698
- − Depreciation
- −$12,189
- Taxable loss
- −$5,793
- Est. tax savings @ 24.0%
- +$1,390
- After-tax cash flow
- $2,578/yr
For passive investors: Depreciation is non-cash, so a rental often shows a tax loss while cash-flowing — sheltering income. Rental losses are passive: they offset passive income freely, and up to $25,000/yr can offset ordinary (W-2) income if you actively participate and your MAGI is under $100k (phasing out to $0 by $150k); unused losses carry forward. On sale, claimed depreciation is recaptured at up to 25%, and gains may owe capital-gains tax (a 1031 exchange can defer both). Figures are a year-1 estimate at your 24.0% rate — not tax advice; consult a CPA.
Schools (NCES district)
- District
- New Britain School District
- NCES district ID
- 0902670
- Math proficiency
- 6% ▼ -6.00%
- Reading proficiency
- 17% ▼ -5.00%
- Median HH income
- $40,827
- Composite
- 9.95/100
- National rank
- #9816
- State rank
- #153 of 153 in CT
Livability — New Britain
- Score
- 74/100
- State rank
- #67
- US rank
- #4936
Category grades
Schools grade is shown separately in the Schools card above.
Census & demographics
- Census place
- New Britain, CT
- County
- Hartford County · 754,208 people
- City population
- 66,322
- Metro
- Hartford-East Hartford-Middletown, CT
- Population (ZIP)
- 29,548
- Household income
- $51,022
- Rent vs Own
- Severe rent burden
- 2100.0
Population outlook (Capitol County) Hauer SSP2
- By 2040
- 1,063,519
Race, ethnicity, and origin ACS 2023
- Neighborhood character
- Diverse neighborhood (Simpson 0.63)
- Race & ethnicity
- Hispanic / Latino 52% White 30% Two or more races 17% Black 11% Asian 2%
- Hispanic origin (detail)
- Mexican 2% Puerto Rican 40% Dominican 4%
- Common ancestry
- Romanian 7% Lithuanian 6% Slovak 1%
- Foreign-born
- 15% · Canada, Jamaica
- Languages at home
- 51% English-only · Spanish 39% Russian/Polish/Slavic 6% Arabic 3%
Political lean MEDSL · Capitol
- 2024 margin
- Strong D (+21.9) · D 60.1% · R 38.2% · Other 1.7%
- All cycles
- 2024: D+21.9
Not yet ingested
- Civics
- —
Market trends
- HPI YoY
- ▲ 31.52%
- Current HPI
- 382.7816
- Rent YoY
- ▼ -0.58%
- Metro
- Hartford-East Hartford-Middletown, CT
- State GDP YoY
- ▲ 1.06%
- F500 in state
- 38
Industry mix (Fortune 500 HQ in CT)
| Industry | F500 HQs | Revenue |
|---|---|---|
| Industrial Machinery | 4 | $38B |
|
||
| Insurance | 3 | $71B |
|
||
| Financial Services | 2 | $25B |
|
||
| Transportation / Logistics | 2 | $18B |
|
||
| Healthcare | 1 | $247B |
|
||
| Telecommunications | 1 | $55B |
|
||
Price history
+139.6% since first listed12 events — show timeline
- 2026-04-01 Pending — Smart MLS
- 2026-03-27 Listed $419,000 Smart MLS
- 2026-03-26 Coming Soon $419,000 Smart MLS
- 2025-02-20 Rental Removed $2,400 SMARTMLS
- 2025-02-14 Listed for Rent $2,400 SMARTMLS
- 2021-02-10 Sold (Public Records) $264,000 Public Records
- 2021-02-04 Sold (MLS) $264,000 Smart MLS
- 2020-11-28 Contingent — Smart MLS
- 2020-11-05 Listed $279,900 Smart MLS
- 2014-09-26 Sold (Public Records) $165,000 Public Records
- 2014-09-25 Sold (MLS) $165,000 Smart MLS
- 2014-07-22 Listed $174,900 Smart MLS
Property tax history
+1.8%/yrLatest (2025): $6,867 · +2.3% YoY. Source: county tax records.
Cash-flow waterfall
monthlySold comps — $/sqft
last 12 mo · ≤1 miLoading sold comps…