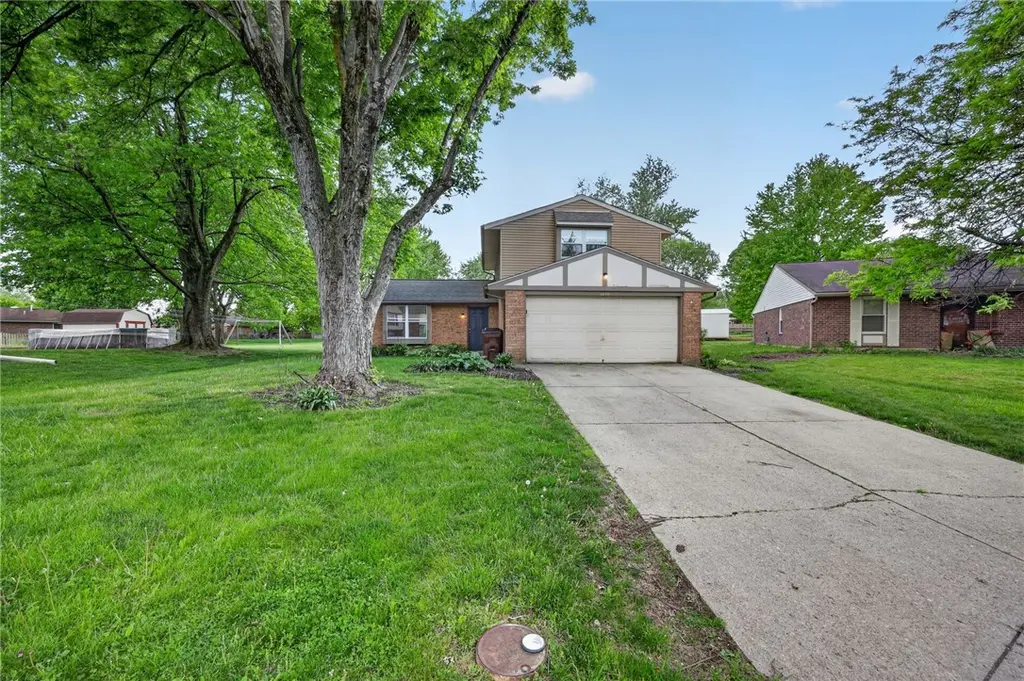
2278 Cross Village Dr · Centerville, OH
Flood risk 1/10 · Minimal
- FEMA flood zone
- X (unshaded)
- Chance of flooding over 30 yrs
- 0.0%
- Est. flood insurance / yr
- $507 – $1,088
Fire risk 1/10 · Minimal
- Est. fire insurance / yr
- $713 – $1,323
Heat risk 3/10 · Minor
- Hot days now (above 100°F)
- 7 days/yr
- Hot days in 30 yrs
- 19 days/yr
Wind risk 2/10 · Minimal
- Chance of severe wind over 30 yrs
- 1.0%
Air-quality risk 4/10 · Minor
- Unhealthy air days now
- 4 days/yr
- Unhealthy air days in 30 yrs
- 5 days/yr
Risk factors via First Street. Map © Google.
Why this score? — see what drove the D- grade
The composite is a weighted blend of 9 inputs, each scored 0–100. Each bar is that input's sub-score; the figure is the points it added to the 100-point composite (weight × sub-score).
- ARV discount +15.0/15.0
- Cash flow +6.7/30.0
- Schools +4.8/10.0
- Livability +4.2/5.0
- Rent growth +3.3/5.0
- Condition / age +2.5/5.0
- 1% rule +2.3/10.0
- DSCR +0.9/10.0
- Appreciation +0.0/10.0
$224,900
🖨 Deal sheet 📄 Offer letter ✓ Due diligence
Listing remarks
This classic two-story 3 bedroom 1.5 bath home, built in 1985 is situated on a spacious 0.28-acre lot in Miamisburg. The residence offers 1,438 square feet of living space and is built on a slab foundation for easy maintenance. The exterior features a functional design complemented by a convenient attached garage. Located within the Miamisburg City School District, the property sits on a well-sized corner-style parcel, offering plenty of outdoor space in a quiet residential setting.
Key facts
- Attached garage
- Corner-style parcel
- Spacious lot
Tags
Property features AI
Finance
- Financial info: Offered for sale
Exterior
- Parking: Attached 2-car garage
- Utilities: Has cooling (central air); Has heating (forced air)
- Home design: 2-story house; Brick and vinyl siding exterior; Slab foundation
- Construction: Brick and vinyl siding construction
- Exterior features: Residential zoning; Lot dimensions approximately 85 x 140
Interior
- Kitchen: Range; Refrigerator; Kitchen on main level (10 x 11)
- Bedrooms: Bedroom on second level (12 x 10); Bedroom on second level (12 x 9); Additional large room on second level (21 x 14) — could serve as a bedroom or bonus space
- Bathrooms: 1 full bathroom; 1 half bathroom; 1 main-level bathroom
- Heating & cooling: Central air conditioning; Forced air heating
- Interior features: Total of 6 rooms; Living room; Family room
Neighborhood map
What this means for you Summary
Snapshot
- This is a 3-bed/1.5-bath single-family listed at $225k.
Deal economics
- At list price, monthly cash flow is $-363 ($-4k/yr) — negative.
- To cash-flow at today's rent, offer at most $161k (28.5% below list).
- To meet the 1% rule (rent ≥ 1% of price), the offer needs to be $164k (26.9% below list).
- Recommended offer: $161k (28.5% below list) — sets the bar for cash-flow.
- Cap rate 4.4% vs local median 2.9% in Centerville — top-decile yield for the area; either an underpriced asset or a hidden risk that comps aren't pricing in. Stress-test before assuming the spread holds.
Location & tenants
- Location reads 85/100 on livability (#45 in OH, #604 nationally) — a professional / high-income tenant draw. Strengths: schools A+, crime A+, cost of living A+; Watch: amenities D+, commute F.
- Miamisburg City (suburban): math 52% / reading 61% proficiency, ranked #338 of 656 in OH (top 52%) — acceptable for families but not a draw, mixed tenant base, ~2y average lease.
- Market conditions: Rents rising (+3.3%/yr); 113 active listings in the ZIP; 15 comparable units currently listed for rent nearby; rentals leasing fast (median 3d on market — plan ~1-2 weeks tenant-placement turnaround); solid renter incomes; 907 units permitted in Montgomery County in 2024 (416 in 5+ unit buildings).
Forward outlook
- Local home prices are declining (-3.0%/yr); year-one equity from $2k of loan paydown is wiped out by about $7k of value loss. Plan a longer hold.
- Montgomery County population projected at -10% by 2050 — secular population decline; favor cash flow + early exit over multi-decade hold.
Negotiation context
- It's been on market 28 days — a 2% lower offer ($222k) is reasonable based on typical stale-listing flexibility.
Questions for the listing agent
- What do current leases actually rent for vs. the listed asking? Can we see a recent rent roll and the last 12 months of T-12 income?
- Is there a deadline driving the sale (1031 exchange, divorce, estate, relocation)? That informs how much negotiation room exists.
- Schools are A-rated — typically a magnet for longer-tenancy family renters. What's the average tenant stay here, and is there a school-zone premium baked into asking?
- The area grade is low — what's the realistic commute time and amenity access for the typical tenant pool here? Any planned neighborhood developments (good or bad) we should know about?
- What's the average days-on-market for RENTAL listings here right now (not sales)? A rising rental-DOM trend means longer vacancies and softer asking-rent achievability than the comps imply.
- What's the recent tenant-quality profile in this submarket — average credit score on applications, eviction rate, late-payment / NSF rate, and stable-employment percentage? A property-management company in the area should have these aggregated.
- How much new for-sale + rental construction is in the pipeline within 1–3 miles? Heavy new supply typically softens prices + rents 12–24 months out; constrained supply supports both.
Investment metrics
- 1% rule
- 0.73% ✗
- Cap rate
- 4.36%
- Cash-on-cash
- -6.92%
- DSCR
- 0.69
- GRM
- 11.4
CMA / ARV
- ARV (median comp)
- $279,949
- List price
- $224,900
- Delta
- -19.66%
- Verdict
- UNDERPRICED
- Comps
- 20 within 1.0 mi
Show comp detail 12 sales within ~0.75 mi
| Address | Dist | Beds/Ba | Sqft | Sold | Price | $/sf | Match |
|---|---|---|---|---|---|---|---|
| 2389 Windsor Village Dr | 0.06mi | 3/2.5 | 1,543 (+7%) | 4mo | $308,000 | $200 | 78 |
| 2152 Blanton Dr | 0.32mi | 3/2.5 | 1,468 (+2%) | 0mo | $345,000 | $235 | 77 |
| 2511 Cinnamon Ridge Ct | 0.24mi | 3/2.0 | 1,356 (-6%) | 1mo | $240,000 | $177 | 76 |
| 9683 Pellston Way | 0.08mi | 3/2.5 | 1,566 (+9%) | 1mo | $289,000 | $185 | 76 |
| 9469 Country Path Trl | 0.33mi | 3/2.0 | 1,502 (+4%) | 0mo | $330,000 | $220 | 75 |
| 2540 Colinda Ct | 0.34mi | 3/2.0 | 1,400 (-3%) | 7mo | $280,000 | $200 | 72 |
| 9820 Arlis Ln | 0.25mi | 3/2.5 | 1,584 (+10%) | 3mo | $316,000 | $199 | 65 |
| 9967 Bannon Ct | 0.28mi | 2/1.5 (-1) | 1,566 (+9%) | 3mo | $180,000 | $115 | 65 |
| 9528 Summer Wind Trl | 0.26mi | 3/2.0 | 1,617 (+12%) | 4mo | $315,000 | $195 | 62 |
| 2460 Miami Village Dr | 0.36mi | 3/2.0 | 1,269 (-12%) | 1mo | $275,000 | $217 | 61 |
| 2115 Autumn Haze Trl | 0.39mi | 3/2.5 | 1,620 (+12%) | 6mo | $290,000 | $179 | 52 |
| 2408 Ferndown Dr | 0.60mi | 3/2.5 | 1,621 (+13%) | 2mo | $350,000 | $216 | 46 |
Match score weights: distance 35% · size 25% · config 20% · recency 20%. Top-matched comps best support the ARV.
Projected returns pro-forma
-3.0% appreciation · 3.29% rent growth · sell at horizon
- IRR
- -27.9%
- Equity multiple
- 0.06×
- Total profit
- $-58,991
- Equity at exit
- $33,533
- IRR
- -25.2%
- Equity multiple
- -0.25×
- Total profit
- $-78,781
- Equity at exit
- $19,445
Cash invested: $62,972 (down + closing). Projections, not guarantees.
Landlord ↔ Tenant lean methodology
- Overall (STATE)
- 73 Landlord-Friendly
- State Ohio
- 73 Landlord-Friendly · R+6
- County
- — inherits STATE
- City
- — inherits STATE
ZIP-level market 45342
- Rents YoY
- 3.3%
- Active inventory
- 113
- Price-to-rent
- 11.4×
Monthly cashflow live
- Estimated rent
- $1,645 high interval (Pro) →
- Mortgage (P&I)
- −$1,179
- Tax from tax record
- −$389 /mo · $4,671/yr
- Insurance
- −$94
- HOA
- −$0
- Vacancy / Maint / Mgmt
- −$345
- Net cashflow
- $-363
Break-even live
UW: 25.0% down · 7.5% · 30yr · 1.5% tax · 5.0% vac · 8.0% maint · 8.0% mgmt
Financing live
Cash to close
- Down payment
- $56,225
- Closing costs
- $6,747
- Reserves months
- —
- Total cash needed
- —
Loan-product check · same deal, 3 products live
Conventional
25% down · 7.5% · 30yr
- Down + closing
- —
- Monthly P&I
- —
- Monthly cashflow
- —
- DSCR
- —
- Eligible?
- —
Personal DTI + credit; lowest rate.
DSCR
20% down · 8.5% · 30yr
- Down + closing
- —
- Monthly P&I
- —
- Monthly cashflow
- —
- DSCR
- —
- Eligible?
- —
No personal income docs; deal must DSCR.
Hard money
10% down · 12.0% · 12mo
- Down + closing
- —
- Monthly P&I
- —
- Monthly cashflow
- —
- DSCR
- —
- Eligible?
- —
Short-term bridge; refi at stabilization.
Rent comps 15 comps
| Address | Beds | Baths | Sqft | Rent | $/sqft | DOM | Units | Dist |
|---|---|---|---|---|---|---|---|---|
| 2419 Cross Village Dr Miamisburg, OH | 2.0 | 2.5 | 1232 | $1,245 | $1.01 | 18d | 1 | 0.20mi |
| 8911 Fox Glove Way Miamisburg, OH | 3.0 | 2.5 | 1416 | $1,725 | $1.22 | 43d | 1 | 0.30mi |
| 2436 Tarpon Bay Dr Miamisburg, OH | 2.0 | 2.5 | 1056 | $1,700 | $1.61 | 3d | 1 | 0.30mi |
| 9403 Captiva Bay Dr Unit 9403 Miamisburg, OH | 3.0 | 2.0 | 1276 | $1,600 | $1.25 | 23d | 1 | 0.31mi |
| 2745 Brookshire Ln Miamisburg, OH | 2.0 | 1.5 | 1040 | $1,099 | $1.06 | 18d | 1 | 0.33mi |
| 9351 Captiva Bay Dr Miamisburg, OH | 2.0 | 2.5 | 1088 | $1,700 | $1.56 | 23d | 1 | 0.36mi |
| 3091 Sagebrook Dr Miamisburg, OH | 1.0–3.0 | 1.0–2.0 | 977 | $1,650 | $1.69 | 2d | 48 | 0.41mi |
| 9600 Summit Point Dr Miamisburg, OH | 2.0 | 1.0–2.0 | 869 | $2,020 | $2.32 | 1d | 14 | 0.47mi |
| 9083 Marquis Dr Miamisburg, OH | 3.0 | 2.0 | 1209 | $2,300 | $1.90 | 2d | 1 | 0.60mi |
| 2480 Foxhill Dr Miamisburg, OH | 2.0 | 1.0–2.0 | 795 | $1,560 | $1.96 | 2d | 36 | 0.63mi |
| 2550 Steeplechase Dr Miamisburg, OH | 1.0–2.0 | 1.0–2.0 | 838 | $1,795 | $2.14 | 3d | 22 | 0.72mi |
| 2991 Austin Springs Blvd Miamisburg, OH | 1.0–3.0 | 1.0–2.0 | 948 | $2,495 | $2.63 | 2d | 20 | 0.77mi |
| 8801 Motter Ln Miamisburg, OH | 1.0–2.0 | 1.0–2.0 | 875 | $1,785 | $2.04 | 2d | 9 | 0.95mi |
| 1570 Spinnaker Way Dayton, OH | 1.0–3.0 | 1.0–2.0 | 982 | $1,760 | $1.79 | 2d | 5 | 1.22mi |
| 1936 Washington West Dr Dayton, OH | 2.0 | 2.0 | 1491 | $1,750 | $1.17 | 2d | 1 | 1.40mi |
Listing history 3 events
-
2026-05-01$224,900 Active 488-char remark
-
2025-01-09soldstatus $2,790,000
-
1985-07-16soldstatus $978,200
ⓘ Source: listings_history table (triggers on properties + properties_extension) + one-shot
backfill from property_details.listing_events for pre-trigger history.
Tax reassessment forecast OH · Partial reset (capped growth)
- Current annual tax
- $4,671 · $389/mo
- Projected year-2 tax
- $4,671 · $389/mo
- Expected delta
- $0/yr ($0/mo · 0.0%)
ⓘ Screening estimate from a state-policy table — verify with the county assessor before closing.
Climate risk First Street
- Flood 1/10 Low FEMA zone X (unshaded) · 0% chance over 30 yrs
- Wildfire 1/10 Low
- Heat 3/10 Moderate 7 d/yr ≥100°F today · 19 d/yr by 30 yrs out
- Wind 2/10 Low 100% chance of damaging wind over 30 yrs
- Air quality 4/10 Moderate 4 unhealthy d/yr today · 5 by 30 yrs out
Nearby sold comps map
Loading sold comps map…
Walkable amenities ~0.75 mi
Loading nearby amenities…
Taxation est. · year 1
- Rental income
- $19,737
- − Mortgage interest
- −$12,598
- − Property taxes
- −$4,671
- − Insurance
- −$1,124
- − Repairs & maintenance
- −$1,579
- − Management
- −$1,579
- − Depreciation
- −$6,543
- Taxable loss
- −$8,357
- Est. tax savings @ 24.0%
- +$2,006
- After-tax cash flow
- $-2,350/yr
For passive investors: Depreciation is non-cash, so a rental often shows a tax loss while cash-flowing — sheltering income. Rental losses are passive: they offset passive income freely, and up to $25,000/yr can offset ordinary (W-2) income if you actively participate and your MAGI is under $100k (phasing out to $0 by $150k); unused losses carry forward. On sale, claimed depreciation is recaptured at up to 25%, and gains may owe capital-gains tax (a 1031 exchange can defer both). Figures are a year-1 estimate at your 24.0% rate — not tax advice; consult a CPA.
Schools (NCES district)
- District
- Miamisburg City
- NCES district ID
- 3904439
- Math proficiency
- 52% ▼ -13.00%
- Reading proficiency
- 61% ▼ -7.00%
- Median HH income
- $53,394
- Composite
- 48.47/100
- National rank
- #2128
- State rank
- #338 of 656 in OH
Livability — Centerville
- Score
- 85/100
- State rank
- #45
- US rank
- #604
Category grades
Schools grade is shown separately in the Schools card above.
Census & demographics
- County
- Montgomery County · 459,541 people
- City population
- 38,712
- Metro
- Dayton-Kettering, OH
- Population (ZIP)
- 36,152
- Household income
- $84,907
- Rent vs Own
- Severe rent burden
- 790.0
Population outlook (Montgomery County) Hauer SSP2
- Today (2025)
- 523,241 people
- By 2030
- 514,948 · -1.6%
- By 2040
- 493,378 · -5.7%
- By 2050
- 469,639 · -10.2%
- By 2075
- 418,360 · -20.0%
- By 2100
- 353,315 · -32.5%
Race, ethnicity, and origin ACS 2023
- Neighborhood character
- Predominantly White (83%)
- Race & ethnicity
- White 83% Black 6% Two or more races 4% Asian 4% Hispanic / Latino 3%
- Common ancestry
- Slovak 2% Italian 2% Serbian 2%
- Foreign-born
- 6% · Canada, China
- Languages at home
- 93% English-only · Other Asian/Pacific 3% Spanish 2% Other Indo-European 1%
Political lean MEDSL · Montgomery
- 2024 margin
- Toss-up / Even · D 49.8% · R 49.3%
- 2008→2024 swing
- -5.8pp toward R · 2008: 6.2pp · 2024: 0.5pp
- All cycles
- 2024: D+0.5 2020: D+2.2 2016: R+1.2 2012: D+3.1 2008: D+6.2
Not yet ingested
- Civics
- —
Market trends
- HPI YoY
- ▼ -183.01%
- Current HPI
- 227.3999
- Rent YoY
- ▲ 3.29%
- Metro
- Dayton-Kettering, OH
- State GDP YoY
- ▲ 1.98%
- F500 in state
- 48
Industry mix (Fortune 500 HQ in OH)
| Industry | F500 HQs | Revenue |
|---|---|---|
| Insurance | 3 | $145B |
|
||
| Industrial Machinery | 3 | $49B |
|
||
| Financial Services | 3 | $24B |
|
||
| Consumer Goods | 2 | $93B |
|
||
| Aerospace / Defense | 2 | $47B |
|
||
| Utilities | 2 | $33B |
|
||
Price history
-77.0% since first listed4 events — show timeline
- 2026-05-29 Pending — Dayton MLS
- 2026-05-01 Listed $224,900 Dayton MLS
- 2025-01-09 Sold (Public Records) $2,790,000 Public Records
- 1985-07-16 Sold (Public Records) $978,200 Public Records
Property tax history
+3.9%/yrLatest (2025): $4,671 · -0.2% YoY. Source: county tax records.
Cash-flow waterfall
monthlySold comps — $/sqft
last 12 mo · ≤1 miLoading sold comps…