 Duplex
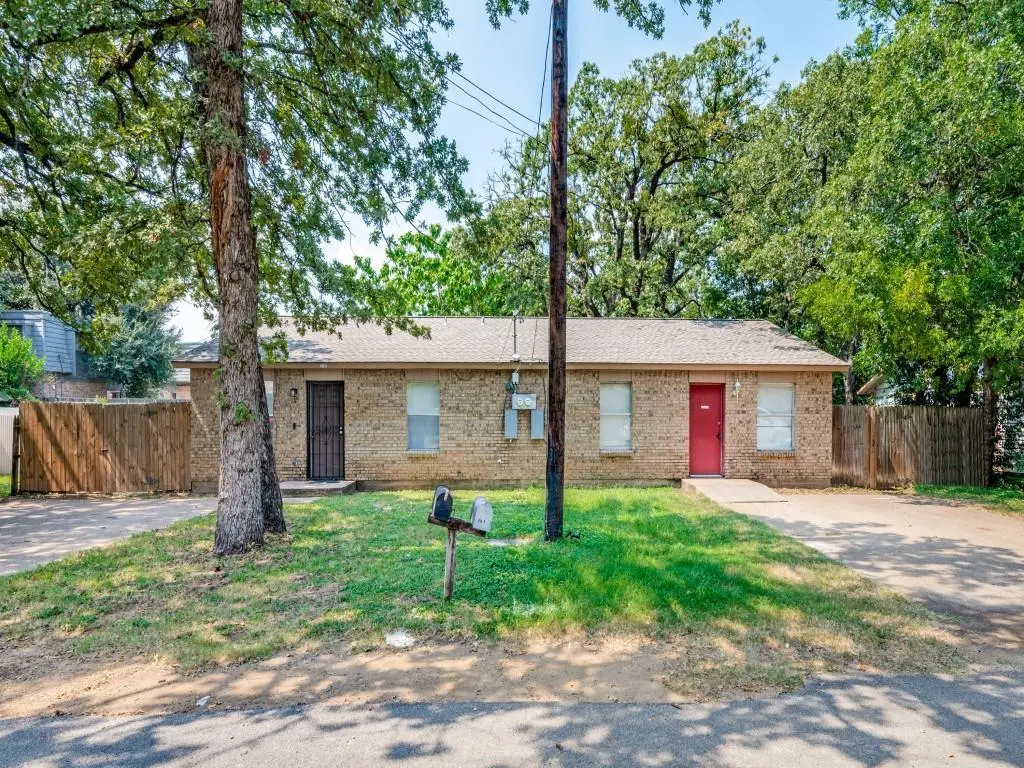
518 Jordan Ln · Arlington, TX
Flood risk 1/10 · Minimal
- FEMA flood zone
- X (unshaded)
- Chance of flooding over 30 yrs
- 0.0%
- Est. flood insurance / yr
- $507 – $1,088
Fire risk 1/10 · Minimal
- Est. fire insurance / yr
- $1,222 – $2,270
Heat risk 7/10 · Major
- Hot days now (above 109°F)
- 7 days/yr
- Hot days in 30 yrs
- 23 days/yr
Wind risk 6/10 · Moderate
- Chance of severe wind over 30 yrs
- 27.0%
Air-quality risk 3/10 · Minor
- Unhealthy air days now
- 2 days/yr
- Unhealthy air days in 30 yrs
- 4 days/yr
Risk factors via First Street. Map © Google.
Why this score? — see what drove the D- grade
The composite is a weighted blend of 9 inputs, each scored 0–100. Each bar is that input's sub-score; the figure is the points it added to the 100-point composite (weight × sub-score).
- Cash flow +12.6/30.0
- ARV discount +7.2/15.0
- 1% rule +3.9/10.0
- Livability +3.9/5.0
- DSCR +3.7/10.0
- Rent growth +3.5/5.0
- Schools +2.5/10.0
- Condition / age +2.5/5.0
- Appreciation +0.0/10.0
$309,900
🖨 Deal sheet 📄 Offer letter ✓ Due diligence
Multi-family units
County records classify this as Multi-Family (2-4 Unit). Listing-text estimate: 2 units. confirmed
Listing remarks MLS
Prime Investment Opportunity:100% occupied duplex, located 10 minutes from UTA Campus and the entertainment center of central Arlington. With access to main thoroughfares for easy commuting, the property provides tenants with convenient access to major attractions while delivering steady rental income for investors. Both units have been thoughtfully updated and feature: Open concept design combining living, dining, and kitchen areas for modern functionality. Recent renovations including laminate flooring, Fresh paint creating a clean move-in ready appearance and updated fixtures providing contemporary appeal. Sizable bedrooms offer comfortable living spaces and a large bathroom in each unit with tub-shower combination. Privately fenced backyards provide outdoor space and privacy for tenants. Unit B has a large outdoor storage unit for tenant use. This turnkey investment property offers immediate cash flow with reliable tenants already in place. With tenants responsible for all utilities, operating expenses are kept to a minimum, maximizing rental income.
Key facts
- Recent renovations
- Open concept design
- Occupied duplex
Tags
Neighborhood map
What this means for you Summary
Snapshot
- This is a 2 × 2-bed/1-bath units multifamily listed at $310k.
Deal economics
- At list price, monthly cash flow is $-41 ($-497/yr) — negative. Per door: $-21/mo.
- To cash-flow at today's rent, offer at most $303k (2.4% below list).
- To meet the 1% rule (rent ≥ 1% of price), the offer needs to be $276k (10.9% below list).
- Recommended offer: $276k (10.9% below list) — sets the bar for 1% rule.
- Cap rate 6.1% vs local median 3.7% in Arlington — top-decile yield for the area; either an underpriced asset or a hidden risk that comps aren't pricing in. Stress-test before assuming the spread holds.
Location & tenants
- Location reads 78/100 on livability (#75 in TX, #2,697 nationally) — a middle-class / working-renter tenant base. Strengths: amenities A+, cost of living A+, housing A+; Watch: schools D+, crime F, commute F.
- Arlington ISD (urban): math 24% / reading 34% proficiency, ranked #629 of 826 in TX (top 76%) — low school quality limits family demand, transient renter base, plan for 1-2y turnover.
- Market conditions: Rents rising (+4.0%/yr); 144 active listings in the ZIP; 30 comparable units currently listed for rent nearby; rentals at typical pace (median 25d on market — plan ~3-4 weeks tenant-placement turnaround); solid renter incomes; 18,938 units permitted in Tarrant County in 2024 (8,336 in 5+ unit buildings).
- This rent runs 38% of the median local income ($88k/yr) — at the standard rent-burdened threshold; future hikes will face affordability resistance.
Forward outlook
- Local home prices are declining (-3.0%/yr); year-one equity from $2k of loan paydown is wiped out by about $9k of value loss. Plan a longer hold.
- Tarrant County population projected at +41% by 2050 — long-run rental-demand tailwind backs the buy-and-hold thesis.
Negotiation context
- It's been on market 91 days — a 9% lower offer ($282k) is reasonable based on typical stale-listing flexibility.
- 3 sale attempts since 3y ago; this cycle's ask has dropped $20k (6%) from the opening price — seller is motivated, your offer sets the floor, not the list.
Risks & watch-outs
- Climate carrying-cost: major wind risk, 27% chance of damaging wind over 30y; extreme-heat days projected 7→23/yr by 2055 (HVAC capex compounding) — expect insurance premiums to compound above CPI over the hold.
Questions for the listing agent
- What do current leases actually rent for vs. the listed asking? Can we see a recent rent roll and the last 12 months of T-12 income?
- It's been on market 91 days. Have you received any prior offers? Is the seller open to a 11% concession, seller financing, or rate buy-down credit?
- Can we see the unit-by-unit rent roll, current vacancy, and any below-market leases? What's the average tenancy length?
- What capital expenditures (roof, boiler, parking lot, exteriors) have been made in the last 5 years, and what's planned in the next 2?
- Why hasn't it sold? Are there any deal-killer items the seller is aware of (foundation, flood, title, zoning, code violations)?
- Is there a deadline driving the sale (1031 exchange, divorce, estate, relocation)? That informs how much negotiation room exists.
- Schools are D-rated, which usually means shorter tenancies and higher turnover. Who's the typical renter profile here, and what's been the actual vacancy rate?
- Crime grade is F in this area — have there been break-ins, vandalism, or insurance claims at this property in the last 3 years? What carrier currently insures it and at what premium?
- The area grade is low — what's the realistic commute time and amenity access for the typical tenant pool here? Any planned neighborhood developments (good or bad) we should know about?
- What's the average days-on-market for RENTAL listings here right now (not sales)? A rising rental-DOM trend means longer vacancies and softer asking-rent achievability than the comps imply.
- What's the recent tenant-quality profile in this submarket — average credit score on applications, eviction rate, late-payment / NSF rate, and stable-employment percentage? A property-management company in the area should have these aggregated.
- How much new apartment / multifamily construction is in the pipeline within 1–3 miles? Heavy new supply (>2% of stock underway) typically softens rents 12–24 months out; light construction supports rent growth.
Investment metrics
- 1% rule
- 0.89% ✗
- Cap rate
- 6.13%
- Cash-on-cash
- -0.57%
- DSCR
- 0.97
- GRM
- 9.4
CMA / ARV
- ARV (median comp)
- $307,770
- List price
- $309,900
- Delta
- 0.69%
- Verdict
- FAIR
- Comps
- 20 within 1.0 mi
Show comp detail 9 sales within ~0.75 mi
| Address | Dist | Beds/Ba | Sqft | Sold | Price | $/sf | Match |
|---|---|---|---|---|---|---|---|
| 521 Oakwood Ln | 0.04mi | 4/2.0 | 1,764 (+0%) | 16mo | $209,000 | $118 | 85 |
| 523 Oakwood Ln | 0.02mi | 4/2.0 | 1,728 (-2%) | 16mo | $209,000 | $121 | 83 |
| 1801 Georgia St | 0.30mi | 4/2.0 | 1,800 (+2%) | 0mo | $280,000 | $156 | 82 |
| 1819 Georgia St | 0.26mi | 4/2.0 | 1,800 (+2%) | 12mo | $270,000 | $150 | 74 |
| 1801 Cousins Ct | 0.24mi | 4/2.0 | 1,824 (+4%) | 20mo | $395,000 | $217 | 66 |
| 1701 Justin Lyn St | 0.39mi | 4/2.0 | 1,546 (-12%) | 1mo | $265,000 | $171 | 60 |
| 2025 Oakwood Ct | 0.16mi | 4/2.0 | 1,960 (+11%) | 17mo | $350,000 | $179 | 59 |
| 2205 Viewtop Ln | 0.27mi | 5/3.0 (+1) | 1,992 (+13%) | 3mo | $320,000 | $161 | 54 |
| 505 Claire Ct | 0.72mi | 4/2.0 | 1,870 (+6%) | 12mo | $380,000 | $203 | 46 |
Match score weights: distance 35% · size 25% · config 20% · recency 20%. Top-matched comps best support the ARV.
Projected returns pro-forma
-3.0% appreciation · 3.98% rent growth · sell at horizon
- IRR
- -16.1%
- Equity multiple
- 0.42×
- Total profit
- $-50,013
- Equity at exit
- $46,207
- IRR
- -6.0%
- Equity multiple
- 0.60×
- Total profit
- $-35,062
- Equity at exit
- $26,794
Cash invested: $86,772 (down + closing). Projections, not guarantees.
Landlord ↔ Tenant lean methodology
- Overall (STATE)
- 87 Strongly Landlord-Friendly
- State Texas
- 87 Strongly Landlord-Friendly · R+5
- County
- — inherits STATE
- City
- — inherits STATE
ZIP-level market 76012
- Rents YoY
- 4.0%
- Active inventory
- 144
- Price-to-rent
- 18.7×
Monthly cashflow live
- Estimated rent
- $2,762 high interval (Pro) →
- Mortgage (P&I)
- −$1,625
- Tax from tax record
- −$469 /mo · $5,629/yr
- Insurance
- −$129
- HOA
- −$0
- Vacancy / Maint / Mgmt
- −$580
- Net cashflow
- $-41
Break-even live
2-unit breakdown (identical units grouped — click to expand)
| Units | Beds | Baths | Est. rent |
|---|---|---|---|
| 2× units | 2 | 1 | $2,762 |
| #1 | 2 | 1 | $1,381 |
| #2 | 2 | 1 | $1,381 |
| Total (2 units) | $2,762 | ||
UW: 25.0% down · 7.5% · 30yr · 1.5% tax · 5.0% vac · 8.0% maint · 8.0% mgmt
Financing live
Cash to close
- Down payment
- $77,475
- Closing costs
- $9,297
- Reserves months
- —
- Total cash needed
- —
Loan-product check · same deal, 3 products live
Conventional
25% down · 7.5% · 30yr
- Down + closing
- —
- Monthly P&I
- —
- Monthly cashflow
- —
- DSCR
- —
- Eligible?
- —
Personal DTI + credit; lowest rate.
DSCR
20% down · 8.5% · 30yr
- Down + closing
- —
- Monthly P&I
- —
- Monthly cashflow
- —
- DSCR
- —
- Eligible?
- —
No personal income docs; deal must DSCR.
Hard money
10% down · 12.0% · 12mo
- Down + closing
- —
- Monthly P&I
- —
- Monthly cashflow
- —
- DSCR
- —
- Eligible?
- —
Short-term bridge; refi at stabilization.
Rent comps 30 comps
| Address | Beds | Baths | Sqft | Rent | $/sqft | DOM | Units | Dist |
|---|---|---|---|---|---|---|---|---|
| 1911 Mimosa Dr Arlington, TX | 3.0 | 2.0 | 1286 | $1,595 | $1.24 | 43d | 1 | 0.27mi |
| 616 Placid Cir Arlington, TX | 3.0 | 2.0 | 1681 | $2,800 | $1.67 | 24d | 1 | 0.36mi |
| 603 Pine Meadow Ct Arlington, TX | 3.0 | 2.0 | 1996 | $2,350 | $1.18 | 24d | 1 | 0.44mi |
| 2326 Kingsway Dr Arlington, TX | 3.0 | 2.5 | 1586 | $1,900 | $1.20 | 43d | 1 | 0.48mi |
| 719 Matthews Ct Arlington, TX | 3.0 | 2.0 | 1490 | $2,200 | $1.48 | 2d | 1 | 0.48mi |
| 424 Westview Ter Arlington, TX | 3.0 | 2.5 | 1728 | $2,150 | $1.24 | 12d | 1 | 0.50mi |
| 426 Westview Ter Arlington, TX | 3.0 | 2.5 | 1872 | $2,100 | $1.12 | 3d | 1 | 0.50mi |
| 502 Bellevue Ln Arlington, TX | 3.0 | 2.5 | 1764 | $2,000 | $1.13 | 20d | 1 | 0.52mi |
| 2409 Springmont Ct Arlington, TX | 3.0 | 1.0 | 1916 | $1,875 | $0.98 | 43d | 1 | 0.53mi |
| 2409 Springmont Ct Unit 2409 Arlington, TX | 3.0 | 2.0 | 1916 | $1,800 | $0.94 | 43d | 1 | 0.53mi |
| 376 Westview Ter Arlington, TX | 3.0 | 2.5 | 1518 | $2,000 | $1.32 | 43d | 1 | 0.58mi |
| 1612 Cindy Ct Arlington, TX | 3.0 | 2.0 | 1726 | $2,420 | $1.40 | 7d | 1 | 0.58mi |
| 637 N Bowen Rd Arlington, TX | 3.0 | 2.0 | 1825 | $2,800 | $1.53 | 43d | 1 | 0.65mi |
| 1703 Pecan Park Dr Arlington, TX | 3.0 | 2.0 | 1366 | $1,950 | $1.43 | 14d | 1 | 0.65mi |
| 1703 Pecan Park Dr Arlington, TX | 3.0 | 2.0 | 1366 | $1,950 | $1.43 | 17d | 1 | 0.65mi |
| 1504 Terrace St Arlington, TX | 3.0 | 2.0 | 2250 | $1,975 | $0.88 | 20d | 1 | 0.74mi |
| 1504 Terrace St Arlington, TX | 3.0 | 2.0 | 2250 | $1,881 | $0.84 | 7d | 1 | 0.74mi |
| 705 White Oak Ln Arlington, TX | 3.0 | 2.0 | 1821 | $1,995 | $1.10 | 43d | 1 | 0.77mi |
| 538 E Norwood Cir Arlington, TX | 3.0 | 2.5 | 1302 | $1,795 | $1.38 | 43d | 1 | 0.78mi |
| 514 Norwood Cir E Arlington, TX | 3.0 | 2.0 | 1302 | $1,850 | $1.42 | 17d | 1 | 0.81mi |
| 514 Norwood Cir E Arlington, TX | 3.0 | 2.0 | 1302 | $1,850 | $1.42 | 5d | 1 | 0.81mi |
| 514 Norwood Cir W Arlington, TX | 3.0 | 2.5 | 2604 | $1,850 | $0.71 | 24d | 1 | 0.81mi |
| 2319 St Gregory St Arlington, TX | 3.0 | 2.5 | 1470 | $1,745 | $1.19 | 12d | 1 | 0.89mi |
| 2414 S Graham Dr Arlington, TX | 3.0 | 2.5 | 1906 | $2,150 | $1.13 | 7d | 1 | 1.00mi |
| 1121 Uta Blvd Arlington, TX | 2.0–4.0 | 2.0–4.0 | 1185 | $980 | $0.83 | 1d | 85 | 1.02mi |
| 1509 University Dr Arlington, TX | 4.0 | 2.0 | 2155 | $2,700 | $1.25 | 43d | 1 | 1.06mi |
| 2806 Buffalo Dr Arlington, TX | 3.0 | 2.0 | 1852 | $2,150 | $1.16 | 43d | 1 | 1.14mi |
| 907 S Bowen Rd Arlington, TX | 3.0 | 2.0 | 1404 | $2,050 | $1.46 | 43d | 1 | 1.16mi |
| 129 Garden Ct E Arlington, TX | 3.0 | 2.5 | 1558 | $2,500 | $1.60 | 14d | 1 | 1.39mi |
| 3002 Friendswood Dr Arlington, TX | 4.0 | 3.0 | 1900 | $2,295 | $1.21 | 24d | 1 | 1.41mi |
Listing history 16 events
-
2026-06-18price $309,900 Active 91 DOM
-
2026-06-18days on market $319,000 Active 91 DOM
-
2026-06-17days on market $319,000 Active 90 DOM
-
2026-06-01days on market $319,000 Active 89 DOM
-
2026-05-31days on market $319,000 Active 88 DOM
-
2026-03-31price $319,000 1078-char remark
Show marketing remark (1078 chars)
Prime Investment Opportunity:100% occupied duplex, located 10 minutes from UTA Campus and the entertainment center of central Arlington. With access to main thoroughfares for easy commuting, the property provides tenants with convenient access to major attractions while delivering steady rental income for investors. Both units have been thoughtfully updated and feature: Open concept design combining living, dining, and kitchen areas for modern functionality. Recent renovations including laminate flooring, Fresh paint creating a clean move-in ready appearance and updated fixtures providing contemporary appeal. Sizable bedrooms offer comfortable living spaces and a large bathroom in each unit with tub-shower combination. Privately fenced backyards provide outdoor space and privacy for tenants. Unit B has a large outdoor storage unit for tenant use. This turnkey investment property offers immediate cash flow with reliable tenants already in place. With tenants responsible for all utilities, operating expenses are kept to a minimum, maximizing rental income.
-
2026-03-04$329,900 Active 1078-char remark
Show marketing remark (1078 chars)
Prime Investment Opportunity:100% occupied duplex, located 10 minutes from UTA Campus and the entertainment center of central Arlington. With access to main thoroughfares for easy commuting, the property provides tenants with convenient access to major attractions while delivering steady rental income for investors. Both units have been thoughtfully updated and feature: Open concept design combining living, dining, and kitchen areas for modern functionality. Recent renovations including laminate flooring, Fresh paint creating a clean move-in ready appearance and updated fixtures providing contemporary appeal. Sizable bedrooms offer comfortable living spaces and a large bathroom in each unit with tub-shower combination. Privately fenced backyards provide outdoor space and privacy for tenants. Unit B has a large outdoor storage unit for tenant use. This turnkey investment property offers immediate cash flow with reliable tenants already in place. With tenants responsible for all utilities, operating expenses are kept to a minimum, maximizing rental income.
-
2026-01-05historical
-
2025-09-18$329,900 Active
-
2023-08-14soldstatus
-
2023-08-11soldstatus Closed
-
2023-07-31status Pending
-
2023-07-25historical Active Option Contract
-
2023-07-20$249,000 Active
-
1988-02-06soldstatus
-
1983-10-25soldstatus
ⓘ Source: listings_history table (triggers on properties + properties_extension) + one-shot
backfill from property_details.listing_events for pre-trigger history.
Tax reassessment forecast TX · Resets to sale price
- Current annual tax
- $5,629 · $469/mo
- Projected year-2 tax
- $5,671 · $473/mo
- Expected delta
- +$42/yr (+$3/mo · 0.7%)
ⓘ Screening estimate from a state-policy table — verify with the county assessor before closing.
Climate risk First Street
- Flood 1/10 Low FEMA zone X (unshaded) · 0% chance over 30 yrs
- Wildfire 1/10 Low
- Heat 7/10 Severe 7 d/yr ≥109°F today · 23 d/yr by 30 yrs out
- Wind 6/10 Major 27% chance of damaging wind over 30 yrs
- Air quality 3/10 Moderate 2 unhealthy d/yr today · 4 by 30 yrs out
Nearby sold comps map
Loading sold comps map…
Walkable amenities ~0.75 mi
Loading nearby amenities…
Taxation est. · year 1
- Rental income
- $33,144
- − Mortgage interest
- −$17,359
- − Property taxes
- −$5,629
- − Insurance
- −$1,550
- − Repairs & maintenance
- −$2,652
- − Management
- −$2,652
- − Depreciation
- −$9,015
- Taxable loss
- −$5,712
- Est. tax savings @ 24.0%
- +$1,371
- After-tax cash flow
- $874/yr
For passive investors: Depreciation is non-cash, so a rental often shows a tax loss while cash-flowing — sheltering income. Rental losses are passive: they offset passive income freely, and up to $25,000/yr can offset ordinary (W-2) income if you actively participate and your MAGI is under $100k (phasing out to $0 by $150k); unused losses carry forward. On sale, claimed depreciation is recaptured at up to 25%, and gains may owe capital-gains tax (a 1031 exchange can defer both). Figures are a year-1 estimate at your 24.0% rate — not tax advice; consult a CPA.
Schools (NCES district)
- District
- Arlington ISD
- NCES district ID
- 4808700
- Math proficiency
- 24% ▼ -21.00%
- Reading proficiency
- 34% ▼ -8.00%
- Median HH income
- $50,873
- Composite
- 25.42/100
- National rank
- #7458
- State rank
- #629 of 826 in TX
Livability — Arlington
- Score
- 78/100
- State rank
- #75
- US rank
- #2697
Category grades
Schools grade is shown separately in the Schools card above.
Census & demographics
- Census place
- Arlington, TX
- County
- Tarrant County · 2,033,669 people
- City population
- 366,588
- Metro
- Dallas-Fort Worth-Arlington, TX
- Population (ZIP)
- 27,991
- Household income
- $88,141
- Rent vs Own
- Severe rent burden
- 1121.0
Population outlook (Tarrant County) Hauer SSP2
- Today (2025)
- 2,380,417 people
- By 2030
- 2,578,900 · +8.3%
- By 2040
- 2,974,995 · +25.0%
- By 2050
- 3,350,489 · +40.8%
- By 2075
- 4,216,909 · +77.2%
- By 2100
- 4,741,527 · +99.2%
Race, ethnicity, and origin ACS 2023
- Neighborhood character
- Diverse neighborhood (Simpson 0.65)
- Race & ethnicity
- White 46% Hispanic / Latino 34% Two or more races 20% Black 15% Asian 2%
- Hispanic origin (detail)
- Mexican 25% Cuban 3%
- Common ancestry
- Slovak 2% Italian 2% Lithuanian 1%
- Foreign-born
- 20% · Canada, Jamaica
- Languages at home
- 68% English-only · Spanish 27% French/Haitian/Cajun 2% Arabic 1%
Political lean MEDSL · Tarrant
- 2024 margin
- Lean R (+5.1) · D 46.7% · R 51.9% · Other 1.4%
- 2008→2024 swing
- +6.6pp toward D · 2008: -11.7pp · 2024: -5.1pp
- All cycles
- 2024: R+5.1 2020: D+0.2 2016: R+8.7 2012: R+15.7 2008: R+11.7
Not yet ingested
- Civics
- —
Market trends
- HPI YoY
- ▼ -281.05%
- Current HPI
- 259.0255
- Rent YoY
- ▲ 3.98%
- Metro
- Dallas-Fort Worth-Arlington, TX
- State GDP YoY
- ▲ 3.95%
- F500 in state
- 110
Industry mix (Fortune 500 HQ in TX)
| Industry | F500 HQs | Revenue |
|---|---|---|
| Energy | 16 | $1,198B |
|
||
| Technology | 5 | $198B |
|
||
| Engineering / Construction | 4 | $72B |
|
||
| Energy Services | 3 | $60B |
|
||
| Utilities | 3 | $41B |
|
||
| Healthcare | 2 | $330B |
|
||
Price history
+28.1% since first listed11 events — show timeline
- 2026-03-31 Price Changed $319,000 NTREIS
- 2026-03-04 Listed $329,900 NTREIS
- 2026-01-05 Listing Removed — NTREIS
- 2025-09-18 Listed $329,900 NTREIS
- 2023-08-14 Sold (Public Records) — Public Records
- 2023-08-11 Sold (MLS) — NTREIS
- 2023-07-31 Pending — NTREIS
- 2023-07-25 Contingent — NTREIS
- 2023-07-20 Listed $249,000 NTREIS
- 1988-02-06 Sold (Public Records) — Public Records
- 1983-10-25 Sold (Public Records) — Public Records
Property tax history
+8.5%/yrLatest (2025): $5,629 · +0.0% YoY. Source: county tax records.
Cash-flow waterfall
monthlySold comps — $/sqft
last 12 mo · ≤1 miLoading sold comps…