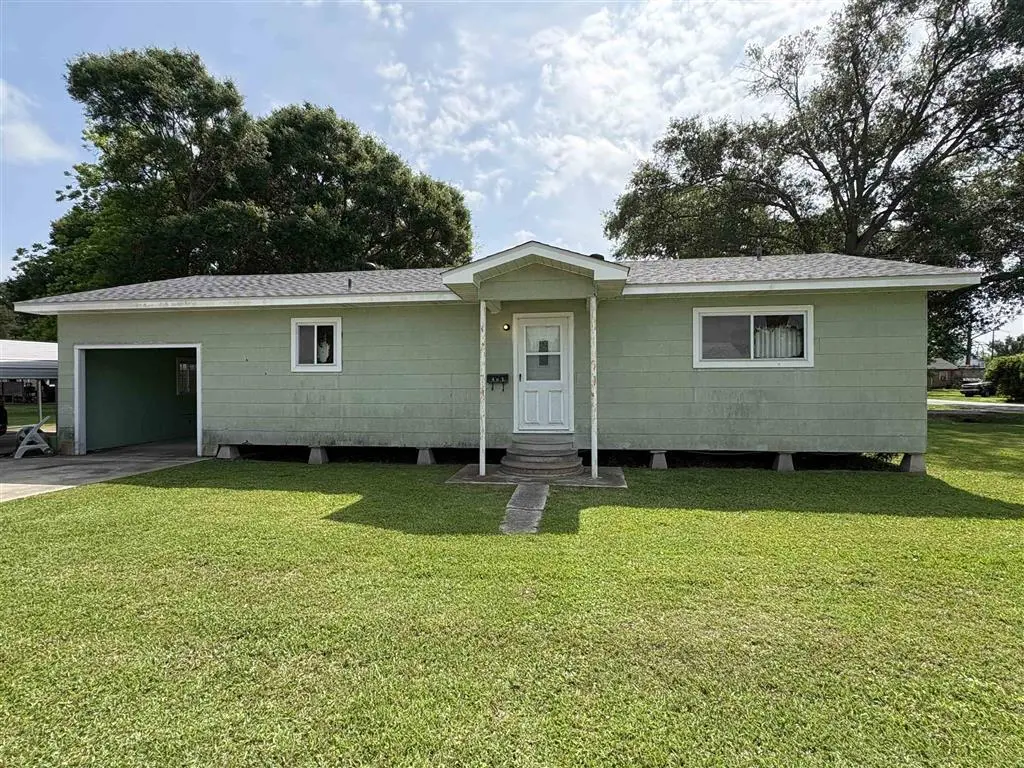
402 Schriever St · Jennings, LA
Flood risk 1/10 · Minimal
- FEMA flood zone
- X (unshaded)
- Chance of flooding over 30 yrs
- 0.0%
- Est. flood insurance / yr
- $507 – $1,088
Fire risk 1/10 · Minimal
- Est. fire insurance / yr
- $1,269 – $2,357
Heat risk 9/10 · Severe
- Hot days now (above 110°F)
- 7 days/yr
- Hot days in 30 yrs
- 21 days/yr
Wind risk 9/10 · Severe
- Chance of severe wind over 30 yrs
- 99.0%
Air-quality risk 1/10 · Minimal
- Unhealthy air days now
- 0 days/yr
- Unhealthy air days in 30 yrs
- 0 days/yr
Risk factors via First Street. Map © Google.
Why this score? — see what drove the B grade
The composite is a weighted blend of 9 inputs, each scored 0–100. Each bar is that input's sub-score; the figure is the points it added to the 100-point composite (weight × sub-score).
- Cash flow +30.0/30.0
- ARV discount +11.3/15.0
- DSCR +10.0/10.0
- 1% rule +8.9/10.0
- Livability +3.1/5.0
- Schools +3.0/10.0
- Rent growth +2.5/5.0
- Condition / age +2.5/5.0
- Appreciation +0.0/10.0
$89,000
🖨 Deal sheet 📄 Offer letter ✓ Due diligence
Listing remarks
Built to last, this solid frame-on-pier home offers 1,248 square feet of comfortable living space on a generous 62’ x 131’ corner lot, combining charm, function, and everyday convenience. Inside, you’ll find 3 bedrooms and 2 baths, including a private primary suite with a three-quarter en suite bath for added comfort. The home features a spacious kitchen and dining area that creates the perfect gathering place for family meals or entertaining guests, while the living room with built-in bookcases adds warmth and character. A two-year-old roof provides peace of mind for years to come. Outside, the property continues to impress with an 11’6” x 21’6” ga
Key facts
- Two-year-old roof
- Corner lot
- 7,840 sq ft lot
Tags
Property features AI
Finance
- Other: Property type: Residential, Single Family Residence
Exterior
- Utilities: Public water; Public sewer; Electricity connected; Natural gas connected; Water connected; Sewer connected
- Home design: Single-family house; Single story
- Exterior features: City lot; Rectangular lot; Lot dimensions approximately 62 x 131 feet; Lot area about 0.18 acres; Corner property (per directions)
Interior
- Bathrooms: 1 full bathroom; 1 three-quarter bathroom
- Heating & cooling: Central heating; Natural gas heating; Central air conditioning
- Interior features: No fireplace
Neighborhood map
What this means for you Summary
Snapshot
- This is a 3-bed/2.0-bath single-family listed at $89k.
Deal economics
- At list price, monthly cash flow is $450 ($5k/yr) — positive.
- The deal already cash-flows at list — no discount required.
- Meets the 1% rule at list price ($1k rent vs $89k).
- Recommended offer: $86k (3.0% below list) — sets the bar for market timing.
- Cap rate 12.4% vs local median 6.2% in Jennings — top-decile yield for the area; either an underpriced asset or a hidden risk that comps aren't pricing in. Stress-test before assuming the spread holds.
Location & tenants
- Location reads 61/100 on livability (#228 in LA) — a middle-class / working-renter tenant base. Strengths: cost of living A+, health & safety A+, housing B; Watch: crime F, amenities F, commute F.
- Jefferson Davis Parish (town): math 30% / reading 42% proficiency, ranked #33 of 98 in LA (top 34%) — families likely to look elsewhere, expect single-tenant / working-renter base with shorter leases.
- Market conditions: 119 active listings in the ZIP; 69 units permitted in Jefferson Davis Parish in 2024 (0 in 5+ unit buildings).
Forward outlook
- Local home prices are declining (-3.0%/yr); year-one equity from $615 of loan paydown is wiped out by about $3k of value loss. Plan a longer hold.
- Jefferson Davis County population projected to shrink 8% by 2050 — rents likely to lag national; underwrite the cash flow, not the appreciation.
- At projected returns (-3.0% appreciation + 3.0% rent growth), your $25k cash investment doubles in ~6 years — after that, you're playing with house money.
Negotiation context
- It's been on market 41 days — a 3% lower offer ($86k) is reasonable based on typical stale-listing flexibility.
Risks & watch-outs
- Climate carrying-cost: severe wind risk, 99% chance of damaging wind over 30y; extreme-heat days projected 7→21/yr by 2055 (HVAC capex compounding) — expect insurance premiums to compound above CPI over the hold.
Questions for the listing agent
- It's been on market 41 days. Have you received any prior offers? Is the seller open to a 3% concession, seller financing, or rate buy-down credit?
- Built in 1960 — when were the roof, HVAC, electrical panel, plumbing, and water heater last replaced?
- Is there a deadline driving the sale (1031 exchange, divorce, estate, relocation)? That informs how much negotiation room exists.
- Crime grade is F in this area — have there been break-ins, vandalism, or insurance claims at this property in the last 3 years? What carrier currently insures it and at what premium?
- What's the average days-on-market for RENTAL listings here right now (not sales)? A rising rental-DOM trend means longer vacancies and softer asking-rent achievability than the comps imply.
- What's the recent tenant-quality profile in this submarket — average credit score on applications, eviction rate, late-payment / NSF rate, and stable-employment percentage? A property-management company in the area should have these aggregated.
- How much new for-sale + rental construction is in the pipeline within 1–3 miles? Heavy new supply typically softens prices + rents 12–24 months out; constrained supply supports both.
Investment metrics
- 1% rule
- 1.39% ✓
- Cap rate
- 12.36%
- Cash-on-cash
- 21.66%
- DSCR
- 1.96
- GRM
- 6.0
CMA / ARV
- ARV (median comp)
- $97,137
- List price
- $89,000
- Delta
- -8.38%
- Verdict
- FAIR
- Comps
- 20 within 1.0 mi
Show comp detail 6 sales within ~0.75 mi
| Address | Dist | Beds/Ba | Sqft | Sold | Price | $/sf | Match |
|---|---|---|---|---|---|---|---|
| 203 N Craig St | 0.16mi | 3/2.0 | 1,266 (+1%) | 7mo | $97,000 | $77 | 85 |
| 806 Shannon Dr | 0.30mi | 3/2.0 | 1,172 (-6%) | 9mo | $129,500 | $110 | 68 |
| 1014 W Academy Ave | 0.26mi | 2/2.0 (-1) | 1,178 (-6%) | 16mo | $108,000 | $92 | 60 |
| 806 State St | 0.64mi | 3/2.0 | 1,288 (+3%) | 6mo | $160,000 | $124 | 60 |
| 515 Clara St | 0.23mi | 3/2.5 | 1,420 (+14%) | 7mo | $229,000 | $161 | 58 |
| 815 Scott St | 0.65mi | 3/1.0 | 1,308 (+5%) | 2mo | $107,000 | $82 | 56 |
Match score weights: distance 35% · size 25% · config 20% · recency 20%. Top-matched comps best support the ARV.
Projected returns pro-forma
-3.0% appreciation · 3.0% rent growth · sell at horizon
- IRR
- 14.2%
- Equity multiple
- 1.57×
- Total profit
- $14,190
- Equity at exit
- $13,270
- IRR
- 23.0%
- Equity multiple
- 2.97×
- Total profit
- $49,096
- Equity at exit
- $7,695
Cash invested: $24,920 (down + closing). Projections, not guarantees.
Landlord ↔ Tenant lean methodology
- Overall (STATE)
- 90 Strongly Landlord-Friendly
- State Louisiana
- 90 Strongly Landlord-Friendly · R+12
- County
- — inherits STATE
- City
- — inherits STATE
ZIP-level market 70546
- Home prices YoY
- -31.7%
- Active inventory
- 119
- Price-to-rent
- 6.0×
Monthly cashflow live
- Estimated rent
- $1,233 medium interval (Pro) →
- Mortgage (P&I)
- −$467
- Tax from tax record
- −$21 /mo · $249/yr
- Insurance
- −$37
- HOA
- −$0
- Vacancy / Maint / Mgmt
- −$259
- Net cashflow
- $450
Break-even live
UW: 25.0% down · 7.5% · 30yr · 1.5% tax · 5.0% vac · 8.0% maint · 8.0% mgmt
Financing live
Cash to close
- Down payment
- $22,250
- Closing costs
- $2,670
- Reserves months
- —
- Total cash needed
- —
Loan-product check · same deal, 3 products live
Conventional
25% down · 7.5% · 30yr
- Down + closing
- —
- Monthly P&I
- —
- Monthly cashflow
- —
- DSCR
- —
- Eligible?
- —
Personal DTI + credit; lowest rate.
DSCR
20% down · 8.5% · 30yr
- Down + closing
- —
- Monthly P&I
- —
- Monthly cashflow
- —
- DSCR
- —
- Eligible?
- —
No personal income docs; deal must DSCR.
Hard money
10% down · 12.0% · 12mo
- Down + closing
- —
- Monthly P&I
- —
- Monthly cashflow
- —
- DSCR
- —
- Eligible?
- —
Short-term bridge; refi at stabilization.
Listing history 6 events
-
2026-06-07statusdays on market $89,000 Pending 41 DOM
-
2026-06-02days on market $89,000 Active 36 DOM
-
2026-06-01days on market $89,000 Active 35 DOM
-
2026-05-31days on market $89,000 Active 34 DOM
-
2026-05-30days on market $89,000 Active 33 DOM
-
2026-04-27$89,000 Active 1129-char remark
ⓘ Source: listings_history table (triggers on properties + properties_extension) + one-shot
backfill from property_details.listing_events for pre-trigger history.
Tax reassessment forecast LA · Resets to sale price
- Current annual tax
- $249 · $21/mo
- Projected year-2 tax
- $490 · $41/mo
- Expected delta
- +$241/yr (+$20/mo · 96.7%)
ⓘ Screening estimate from a state-policy table — verify with the county assessor before closing.
Climate risk First Street
- Flood 1/10 Low FEMA zone X (unshaded) · 0% chance over 30 yrs
- Wildfire 1/10 Low
- Heat 9/10 Extreme 7 d/yr ≥110°F today · 21 d/yr by 30 yrs out
- Wind 9/10 Extreme 99% chance of damaging wind over 30 yrs
- Air quality 1/10 Low 0 unhealthy d/yr today · 0 by 30 yrs out
Nearby sold comps map
Loading sold comps map…
Walkable amenities ~0.75 mi
Loading nearby amenities…
Taxation est. · year 1
- Rental income
- $14,800
- − Mortgage interest
- −$4,985
- − Property taxes
- −$249
- − Insurance
- −$445
- − Repairs & maintenance
- −$1,184
- − Management
- −$1,184
- − Depreciation
- −$2,589
- Taxable income
- $4,164
- Est. tax owed @ 24.0%
- −$999
- After-tax cash flow
- $4,398/yr
For passive investors: Depreciation is non-cash, so a rental often shows a tax loss while cash-flowing — sheltering income. Rental losses are passive: they offset passive income freely, and up to $25,000/yr can offset ordinary (W-2) income if you actively participate and your MAGI is under $100k (phasing out to $0 by $150k); unused losses carry forward. On sale, claimed depreciation is recaptured at up to 25%, and gains may owe capital-gains tax (a 1031 exchange can defer both). Figures are a year-1 estimate at your 24.0% rate — not tax advice; consult a CPA.
Schools (NCES district)
- District
- Jefferson Davis Parish
- NCES district ID
- 2200810
- Math proficiency
- 30% ▼ -39.00%
- Reading proficiency
- 42% ▼ -33.00%
- Median HH income
- $40,322
- Composite
- 30.21/100
- National rank
- #6302
- State rank
- #33 of 98 in LA
Livability — Jennings
- Score
- 61/100
- State rank
- #228
- US rank
- #17390
Category grades
Schools grade is shown separately in the Schools card above.
Census & demographics
- Census place
- Jennings, LA
- Population (ZIP)
- 15,821
Population outlook (Jefferson Davis County) Hauer SSP2
- Today (2025)
- 31,015 people
- By 2030
- 30,563 · -1.5%
- By 2040
- 29,639 · -4.4%
- By 2050
- 28,456 · -8.3%
- By 2075
- 25,521 · -17.7%
- By 2100
- 21,787 · -29.8%
Race, ethnicity, and origin ACS 2023
- Neighborhood character
- Predominantly White (76%)
- Race & ethnicity
- White 76% Black 15% Two or more races 8% Hispanic / Latino 3%
- Common ancestry
- Lithuanian 14% Italian 1% Slovak 1%
- Foreign-born
- 1% · Canada, Vietnam
- Languages at home
- 92% English-only · French/Haitian/Cajun 6% Spanish 2%
Political lean MEDSL · Jefferson Davis
- 2024 margin
- Solid R (+61.1) · D 18.8% · R 79.9% · Other 1.3%
- 2008→2024 swing
- -21.5pp toward R · 2008: -39.7pp · 2024: -61.1pp
- All cycles
- 2024: R+61.1 2020: R+55.4 2016: R+53.9 2012: R+47.6 2008: R+39.7
Not yet ingested
- Civics
- —
Market trends
- HPI YoY
- ▼ -68.56%
- Current HPI
- 147.6391
- Rent YoY
- —
- Metro
- —
- State GDP YoY
- ▲ 3.29%
- F500 in state
- 10
Industry mix (Fortune 500 HQ in LA)
| Industry | F500 HQs | Revenue |
|---|---|---|
| Telecommunications | 2 | $23B |
|
||
| Utilities | 1 | $12B |
|
||
| Wholesale / Distribution | 1 | $5B |
|
||
| Advertising | 1 | $2B |
|
||
Price history
2 events — show timeline
- 2026-06-07 Pending — SWLAR
- 2026-04-27 Listed $89,000 SWLAR
Property tax history
+0.1%/yrLatest (2025): $249 · +0.4% YoY. Source: county tax records.
Cash-flow waterfall
monthlySold comps — $/sqft
last 12 mo · ≤1 miLoading sold comps…