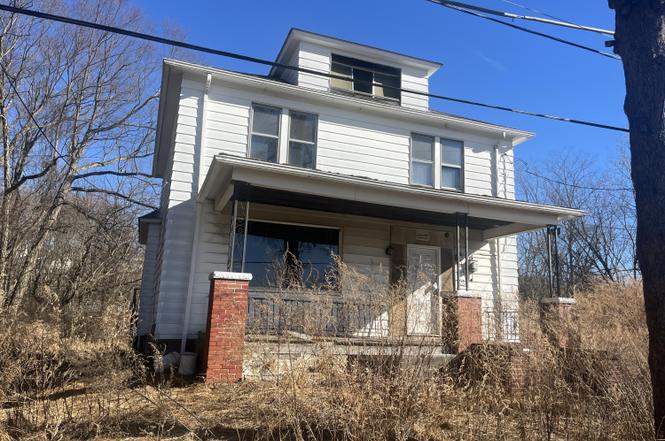
1 Mccullough Rd · Plains, PA
Flood risk 9/10 · Severe
- FEMA flood zone
- AE
- Chance of flooding over 30 yrs
- 0.99%
- Est. flood insurance / yr
- $1,737 – $8,500
Fire risk 1/10 · Minimal
- Est. fire insurance / yr
- $511 – $949
Heat risk 3/10 · Minor
- Hot days now (above 97°F)
- 7 days/yr
- Hot days in 30 yrs
- 16 days/yr
Wind risk 3/10 · Minor
- Chance of severe wind over 30 yrs
- 4.0%
Air-quality risk 3/10 · Minor
- Unhealthy air days now
- 2 days/yr
- Unhealthy air days in 30 yrs
- 4 days/yr
Risk factors via First Street. Map © Google.
Why this score? — see what drove the D+ grade
The composite is a weighted blend of 9 inputs, each scored 0–100. Each bar is that input's sub-score; the figure is the points it added to the 100-point composite (weight × sub-score).
- Cash flow +15.0/30.0
- ARV discount +7.5/15.0
- 1% rule +5.0/10.0
- DSCR +5.0/10.0
- Rent growth +4.2/5.0
- Livability +3.9/5.0
- Condition / age +2.5/5.0
- Schools +2.1/10.0
- Appreciation +0.0/10.0
$19,500
🖨 Deal sheet (PDF) 📄 Offer letter ✓ Due diligence
Listing remarks
Single family residence in poor condition. Six rooms, three bedrooms, one bathroom. Home must be completely remodeled. Subject property located in a high flood risk zone. Deed attached for access easement information.
Key facts
- Built 1930
- Listed 3 days
Neighborhood map
What this means for you Summary
Snapshot
- This is a 3-bed/1.0-bath single-family listed at $20k.
Deal economics
- At list price, monthly cash flow is $619 ($7k/yr) — positive.
- The deal already cash-flows at list — no discount required.
- Meets the 1% rule at list price ($1k rent vs $20k).
- Cap rate 70.6% vs local median 4.8% in Plains — top-decile yield for the area; either an underpriced asset or a hidden risk that comps aren't pricing in. Stress-test before assuming the spread holds.
Location & tenants
- Location reads 78/100 on livability (#286 in PA, #2,528 nationally) — a middle-class / working-renter tenant base. Strengths: crime A+, cost of living A+, housing A+; Watch: schools C-, employment D+, amenities D.
- Wilkes-Barre Area SD (urban): math 19% / reading 32% proficiency, ranked #469 of 539 in PA (top 87%) — low school quality limits family demand, transient renter base, plan for 1-2y turnover; 61% free/reduced lunch — lower-income household profile, screen leases tightly.
- Market conditions: Rents rising fast (+6.8%/yr); 221 active listings in the ZIP; 6 comparable units currently listed for rent nearby; rentals at typical pace (median 22d on market — plan ~3-4 weeks tenant-placement turnaround); 349 units permitted in Luzerne County in 2024 (16 in 5+ unit buildings).
- This rent runs 32% of the median local income ($56k/yr) — at the standard rent-burdened threshold; future hikes will face affordability resistance.
Forward outlook
- Local home prices are declining (-3.0%/yr); year-one equity from $135 of loan paydown is wiped out by about $585 of value loss. Plan a longer hold.
- Luzerne County population projected at +4% by 2050 — modest demand growth; plan on rents tracking national, not racing it.
- At projected returns (-3.0% appreciation + 6.8% rent growth), your $5k cash investment doubles in ~1 year — after that, you're playing with house money.
Negotiation context
- Only 3 days on market — expect competitive offers; lowballing is unlikely to land.
Risks & watch-outs
- Watch-outs: flood insurance adds $427/mo; built in 1930 — expect roof / HVAC / electrical / plumbing capex.
- Climate carrying-cost: in FEMA flood zone AE (mandatory federal flood insurance) — expect insurance premiums to compound above CPI over the hold.
Questions for the listing agent
- Built in 1930 — when were the roof, HVAC, electrical panel, plumbing, and water heater last replaced?
- What's the actual annual flood-insurance premium (NFIP or private), and is the property in a SFHA with mandatory coverage?
- Is there a deadline driving the sale (1031 exchange, divorce, estate, relocation)? That informs how much negotiation room exists.
- The area grade is low — what's the realistic commute time and amenity access for the typical tenant pool here? Any planned neighborhood developments (good or bad) we should know about?
- What's the average days-on-market for RENTAL listings here right now (not sales)? A rising rental-DOM trend means longer vacancies and softer asking-rent achievability than the comps imply.
- What's the recent tenant-quality profile in this submarket — average credit score on applications, eviction rate, late-payment / NSF rate, and stable-employment percentage? A property-management company in the area should have these aggregated.
- How much new for-sale + rental construction is in the pipeline within 1–3 miles? Heavy new supply typically softens prices + rents 12–24 months out; constrained supply supports both.
Investment metrics
- 1% rule
- 7.66% ✓
- Cap rate
- 70.62%
- Cash-on-cash
- 229.73%
- DSCR
- 11.22
- GRM
- 1.1
CMA / ARV
- ARV (on-the-fly)
- $246,568
- Comps found
- 12
Show comp detail 12 sales within ~0.75 mi
| Address | Dist | Beds/Ba | Sqft | Sold | Price | $/sf | Match |
|---|---|---|---|---|---|---|---|
| 1 Mccullough Rd | 0.00mi | 3/1.0 | 1,470 (-12%) | 1mo | $26,000 | $18 | 80 |
| 355 Main St | 0.44mi | 3/1.5 | 1,619 (-3%) | 8mo | $265,000 | $164 | 66 |
| 36 Enterprise St | 0.19mi | 3/1.0 | 1,784 (+7%) | 16mo | $154,000 | $86 | 66 |
| 387 Main St | 0.45mi | 3/1.0 | 1,481 (-11%) | 2mo | $212,000 | $143 | 59 |
| 13 Terrace Dr | 0.37mi | 3/2.0 | 1,832 (+10%) | 9mo | $305,000 | $166 | 55 |
| 123 Carey St | 0.60mi | 3/1.0 | 1,536 (-8%) | 9mo | $132,500 | $86 | 52 |
| 351 Main St | 0.45mi | 3/1.5 | 1,834 (+10%) | 13mo | $290,000 | $158 | 50 |
| 3 Hemlock St | 0.61mi | 3/2.0 | 1,550 (-7%) | 8mo | $179,000 | $115 | 50 |
| 185 Main St | 0.51mi | 2/2.0 (-1) | 1,499 (-10%) | 3mo | $260,000 | $173 | 48 |
| 331 Main St | 0.44mi | 3/2.0 | 1,908 (+14%) | 7mo | $199,900 | $105 | 45 |
| 107 Burke St | 0.30mi | 4/1.5 (+1) | 1,900 (+14%) | 14mo | $280,900 | $148 | 44 |
| 26 Delaware St | 0.71mi | 3/1.5 | 1,456 (-13%) | 0mo | $250,000 | $172 | 44 |
Match score weights: distance 35% · size 25% · config 20% · recency 20%. Top-matched comps best support the ARV.
Projected returns pro-forma
-3.0% appreciation · 6.84% rent growth · sell at horizon
- IRR
- —
- Equity multiple
- 8.79×
- Total profit
- $42,526
- Equity at exit
- $2,908
- IRR
- —
- Equity multiple
- 22.16×
- Total profit
- $115,552
- Equity at exit
- $1,686
Cash invested: $5,460 (down + closing). Projections, not guarantees.
Landlord ↔ Tenant lean methodology
- Overall (STATE)
- 62 Landlord-Friendly
- State Pennsylvania
- 62 Landlord-Friendly · EVEN
- County
- — inherits STATE
- City
- — inherits STATE
ZIP-level market 18702
- Rents YoY
- 6.8%
- Active inventory
- 221
- Price-to-rent
- 1.1×
Monthly cashflow live
- Estimated rent
- $1,494 high interval (Pro) →
- Mortgage (P&I)
- −$102
- Tax est. 1.5%
- −$24 /mo · $292/yr
- Insurance
- −$8
- Flood insurance flood zone
- −$427 /mo · $5,118/yr
- HOA
- −$0
- Vacancy / Maint / Mgmt
- −$314
- Net cashflow
- $619
Break-even live
Sensitivity live
| Price | -10% $632 | -5% $625 | +0% $619 | +5% $612 | +10% $605 |
|---|---|---|---|---|---|
| Rent | -10% $501 | -5% $560 | +0% $619 | +5% $678 | +10% $737 |
| Rate | -1.0pp $629 | -0.5pp $624 | base $619 | +0.5pp $614 | +1.0pp $609 |
UW: 25.0% down · 7.5% · 30yr · 1.5% tax · 5.0% vac · 8.0% maint · 8.0% mgmt
Financing live
Cash to close
- Down payment
- $4,875
- Closing costs
- $585
- Reserves months
- —
- Total cash needed
- —
Loan-product check · same deal, 3 products live
Conventional
25% down · 7.5% · 30yr
- Down + closing
- —
- Monthly P&I
- —
- Monthly cashflow
- —
- DSCR
- —
- Eligible?
- —
Personal DTI + credit; lowest rate.
DSCR
20% down · 8.5% · 30yr
- Down + closing
- —
- Monthly P&I
- —
- Monthly cashflow
- —
- DSCR
- —
- Eligible?
- —
No personal income docs; deal must DSCR.
Hard money
10% down · 12.0% · 12mo
- Down + closing
- —
- Monthly P&I
- —
- Monthly cashflow
- —
- DSCR
- —
- Eligible?
- —
Short-term bridge; refi at stabilization.
Rent comps 6 comps
| Address | Beds | Baths | Sqft | Rent | $/sqft | DOM | Units | Dist |
|---|---|---|---|---|---|---|---|---|
| 123 W Carey St Wilkes Barre, PA | 3.0 | 2.0 | 1375 | $1,650 | $1.20 | 14d | 1 | 0.63mi |
| 26 E Carey St Apt 4 Wilkes-Barre, PA | 3.0 | 1.0 | 1050 | $1,300 | $1.24 | 14d | 1 | 0.76mi |
| 13 Charles St Unit 15 Wilkes-Barre, PA | 3.0 | 1.0 | 1300 | $1,550 | $1.19 | 14d | 1 | 1.03mi |
| 9 Snowden St Forty Fort, PA | 3.0 | 1.0 | 1500 | $1,250 | $0.83 | 21d | 1 | 1.39mi |
| 1154 Murray St Kingston, PA | 2.0 | 1.5 | 1152 | $1,600 | $1.39 | 44d | 1 | 1.40mi |
| 19 Center St Plains, PA | 2.0 | 1.5 | 1100 | $1,295 | $1.18 | 44d | 1 | 1.47mi |
Listing history 2 events
-
2026-03-13status Pending
-
2026-03-10$19,500 Active
ⓘ Source: listings_history table (triggers on properties + properties_extension) + one-shot
backfill from property_details.listing_events for pre-trigger history.
Climate risk First Street
- Flood 9/10 Extreme FEMA zone AE · 99% chance over 30 yrs
- Wildfire 1/10 Low
- Heat 3/10 Moderate 7 d/yr ≥97°F today · 16 d/yr by 30 yrs out
- Wind 3/10 Moderate 4% chance of damaging wind over 30 yrs
- Air quality 3/10 Moderate 2 unhealthy d/yr today · 4 by 30 yrs out
Nearby sold comps map
Loading sold comps map…
Walkable amenities ~0.75 mi
Loading nearby amenities…
Taxation est. · year 1
- Rental income
- $17,925
- − Mortgage interest
- −$1,092
- − Property taxes
- −$292
- − Insurance
- −$5,216
- − Repairs & maintenance
- −$1,434
- − Management
- −$1,434
- − Depreciation
- −$567
- Taxable income
- $7,889
- Est. tax owed @ 24.0%
- −$1,893
- After-tax cash flow
- $5,532/yr
For passive investors: Depreciation is non-cash, so a rental often shows a tax loss while cash-flowing — sheltering income. Rental losses are passive: they offset passive income freely, and up to $25,000/yr can offset ordinary (W-2) income if you actively participate and your MAGI is under $100k (phasing out to $0 by $150k); unused losses carry forward. On sale, claimed depreciation is recaptured at up to 25%, and gains may owe capital-gains tax (a 1031 exchange can defer both). Figures are a year-1 estimate at your 24.0% rate — not tax advice; consult a CPA.
Schools (NCES district)
- District
- Wilkes-Barre Area SD
- NCES district ID
- 4226300
- Math proficiency
- 19% ▼ -2.00%
- Reading proficiency
- 32% ▼ -9.00%
- Median HH income
- $37,420
- Composite
- 21.22/100
- National rank
- #8409
- State rank
- #469 of 539 in PA
Livability — Plains
- Score
- 78/100
- State rank
- #286
- US rank
- #2528
Category grades
Schools grade is shown separately in the Schools card above.
Census & demographics
- County
- Luzerne County · 118,885 people
- Metro
- Scranton--Wilkes-Barre, PA
- Population (ZIP)
- 41,970
- Household income
- $56,378
- Rent vs Own
- Severe rent burden
- 1632.0
Population outlook (Luzerne County) Hauer SSP2
- Today (2025)
- 319,505 people
- By 2030
- 319,943 · +0.1%
- By 2040
- 322,643 · +1.0%
- By 2050
- 330,817 · +3.5%
- By 2075
- 379,145 · +18.7%
- By 2100
- 431,908 · +35.2%
Race, ethnicity, and origin ACS 2023
- Neighborhood character
- Diverse neighborhood (Simpson 0.59)
- Race & ethnicity
- White 58% Hispanic / Latino 25% Black 12% Two or more races 11% Asian 2%
- Hispanic origin (detail)
- Mexican 6% Puerto Rican 6% Dominican 9%
- Common ancestry
- Romanian 14% Scotch-Irish 2% Iranian 1%
- Foreign-born
- 13% · Canada, Jamaica
- Languages at home
- 79% English-only · Spanish 17% Other Asian/Pacific 1% Other Indo-European 1%
Political lean MEDSL · Luzerne
- 2024 margin
- R (+19.2) · D 40.0% · R 59.2%
- 2008→2024 swing
- -27.6pp toward R · 2008: 8.4pp · 2024: -19.2pp
- All cycles
- 2024: R+19.2 2020: R+14.4 2016: R+19.6 2012: D+4.8 2008: D+8.4
Not yet ingested
- Civics
- —
Market trends
- HPI YoY
- ▼ -156.99%
- Current HPI
- 216.9373
- Rent YoY
- ▲ 6.84%
- Metro
- Scranton--Wilkes-Barre, PA
- State GDP YoY
- ▲ 1.68%
- F500 in state
- 34
Industry mix (Fortune 500 HQ in PA)
| Industry | F500 HQs | Revenue |
|---|---|---|
| Healthcare | 2 | $309B |
|
||
| Insurance | 2 | $27B |
|
||
| Telecommunications / Media | 1 | $124B |
|
||
| Industrial Distribution | 1 | $22B |
|
||
| Financial Services | 1 | $20B |
|
||
| Chemicals / Materials | 1 | $18B |
|
||
Price history
2 events — show timeline
- 2026-03-13 Pending — LCAR
- 2026-03-10 Listed $19,500 LCAR
Property tax history
+1.6%/yrLatest (2026): $1,662 · +4.2% YoY. Source: county tax records.
Cash-flow waterfall
monthlySold comps — $/sqft
last 12 mo · ≤1 miLoading sold comps…