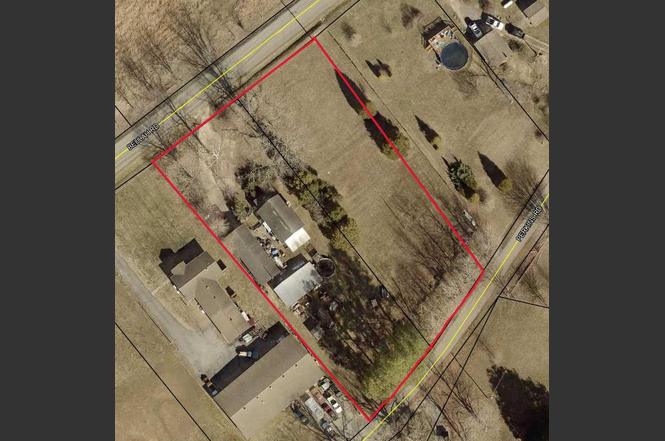
2735 Beulah Rd · Madisonville, KY
Flood risk 1/10 · Minimal
- FEMA flood zone
- X (unshaded)
- Chance of flooding over 30 yrs
- 0.0%
- Est. flood insurance / yr
- $507 – $1,088
Fire risk 3/10 · Minor
- Est. fire insurance / yr
- $839 – $1,559
Heat risk 5/10 · Moderate
- Hot days now (above 109°F)
- 7 days/yr
- Hot days in 30 yrs
- 20 days/yr
Wind risk 3/10 · Minor
- Chance of severe wind over 30 yrs
- 6.0%
Air-quality risk 2/10 · Minimal
- Unhealthy air days now
- 1 days/yr
- Unhealthy air days in 30 yrs
- 1 days/yr
Risk factors via First Street. Map © Google.
Why this score? — see what drove the B- grade
The composite is a weighted blend of 9 inputs, each scored 0–100. Each bar is that input's sub-score; the figure is the points it added to the 100-point composite (weight × sub-score).
- Cash flow +30.0/30.0
- 1% rule +10.0/10.0
- DSCR +10.0/10.0
- ARV discount +7.5/15.0
- Livability +3.6/5.0
- Schools +3.0/10.0
- Rent growth +2.5/5.0
- Condition / age +2.5/5.0
- Appreciation +0.0/10.0
$79,900
🖨 Deal sheet 📄 Offer letter ✓ Due diligence
Listing remarks
Check out this investment opportunity located at 2735 Beulah Rd. , in addition to the home there is a detached garage and an outbuilding. All property information including square footage and lot size are directly from PVA, buyer to satisfy themselves. Property being sold as is, will not qualify for government backed loan. Contact Robin Murray with Heritage Homes Real Estate 270-836-4264.
Key facts
- Outbuilding
- Detached garage
- 1.26 acre lot
Tags
Property features AI
Exterior
- Parking: Detached 2-car garage
- Home design: Single-family residence; Residential property; 2 stories
- Construction: Aluminum siding; Composition roof
- Exterior features: Covered patio/porch; Accessible entrance; Lot approximately 1.26 acres
Interior
- Kitchen: Range; Electric range; Refrigerator
- Bedrooms: One bedroom on the main level
- Bathrooms: One full bathroom (main level)
- Heating & cooling: Window unit(s) for cooling
- Interior features: Wood-burning fireplace (1)
- Laundry & utility: Laundry on the main level; Electric water heater
Neighborhood map
What this means for you Summary
Snapshot
- This is a 3-bed/1.0-bath single-family listed at $80k.
Deal economics
- At list price, monthly cash flow is $468 ($6k/yr) — positive.
- The deal already cash-flows at list — no discount required.
- Meets the 1% rule at list price ($1k rent vs $80k).
- Recommended offer: $70k (12.0% below list) — sets the bar for market timing.
- Cap rate 13.3% vs local median 4.0% in Madisonville — top-decile yield for the area; either an underpriced asset or a hidden risk that comps aren't pricing in. Stress-test before assuming the spread holds.
Location & tenants
- Location reads 72/100 on livability (#132 in KY) — a middle-class / working-renter tenant base. Strengths: crime A+, cost of living A+, housing A+; Watch: amenities F, commute F, employment F.
- Hopkins County (town): math 27% / reading 43% proficiency, ranked #65 of 165 in KY (top 39%) — families likely to look elsewhere, expect single-tenant / working-renter base with shorter leases.
- Market conditions: 192 active listings in the ZIP; 122 units permitted in Hopkins County in 2024 (0 in 5+ unit buildings).
Forward outlook
- Local home prices are declining (-3.0%/yr); year-one equity from $552 of loan paydown is wiped out by about $2k of value loss. Plan a longer hold.
- Hopkins County population projected at -13% by 2050 — secular population decline; favor cash flow + early exit over multi-decade hold.
- At projected returns (-3.0% appreciation + 3.0% rent growth), your $22k cash investment doubles in ~5 years — after that, you're playing with house money.
Negotiation context
- It's been on market 219 days — a 12% lower offer ($70k) is reasonable based on typical stale-listing flexibility.
Risks & watch-outs
- Climate carrying-cost: extreme-heat days projected 7→20/yr by 2055 (HVAC capex compounding) — expect insurance premiums to compound above CPI over the hold.
Questions for the listing agent
- It's been on market 219 days. Have you received any prior offers? Is the seller open to a 12% concession, seller financing, or rate buy-down credit?
- Built in 1965 — when were the roof, HVAC, electrical panel, plumbing, and water heater last replaced?
- Why hasn't it sold? Are there any deal-killer items the seller is aware of (foundation, flood, title, zoning, code violations)?
- Is there a deadline driving the sale (1031 exchange, divorce, estate, relocation)? That informs how much negotiation room exists.
- What's the average days-on-market for RENTAL listings here right now (not sales)? A rising rental-DOM trend means longer vacancies and softer asking-rent achievability than the comps imply.
- What's the recent tenant-quality profile in this submarket — average credit score on applications, eviction rate, late-payment / NSF rate, and stable-employment percentage? A property-management company in the area should have these aggregated.
- How much new for-sale + rental construction is in the pipeline within 1–3 miles? Heavy new supply typically softens prices + rents 12–24 months out; constrained supply supports both.
Investment metrics
- 1% rule
- 1.50% ✓
- Cap rate
- 13.32%
- Cash-on-cash
- 25.09%
- DSCR
- 2.12
- GRM
- 5.6
CMA / ARV
No comps found within radius.
Projected returns pro-forma
-3.0% appreciation · 3.0% rent growth · sell at horizon
- IRR
- 18.5%
- Equity multiple
- 1.75×
- Total profit
- $16,814
- Equity at exit
- $11,913
- IRR
- 26.9%
- Equity multiple
- 3.36×
- Total profit
- $52,885
- Equity at exit
- $6,908
Cash invested: $22,372 (down + closing). Projections, not guarantees.
Landlord ↔ Tenant lean methodology
- Overall (STATE)
- 83 Strongly Landlord-Friendly
- State Kentucky
- 83 Strongly Landlord-Friendly · R+16
- County
- — inherits STATE
- City
- — inherits STATE
ZIP-level market 42431
- Home prices YoY
- -15.2%
- Active inventory
- 192
- Price-to-rent
- 5.6×
Monthly cashflow live
- Estimated rent
- $1,195 medium interval (Pro) →
- Mortgage (P&I)
- −$419
- Tax from tax record
- −$24 /mo · $291/yr
- Insurance
- −$33
- HOA
- −$0
- Vacancy / Maint / Mgmt
- −$251
- Net cashflow
- $468
Break-even live
UW: 25.0% down · 7.5% · 30yr · 1.5% tax · 5.0% vac · 8.0% maint · 8.0% mgmt
Financing live
Cash to close
- Down payment
- $19,975
- Closing costs
- $2,397
- Reserves months
- —
- Total cash needed
- —
Loan-product check · same deal, 3 products live
Conventional
25% down · 7.5% · 30yr
- Down + closing
- —
- Monthly P&I
- —
- Monthly cashflow
- —
- DSCR
- —
- Eligible?
- —
Personal DTI + credit; lowest rate.
DSCR
20% down · 8.5% · 30yr
- Down + closing
- —
- Monthly P&I
- —
- Monthly cashflow
- —
- DSCR
- —
- Eligible?
- —
No personal income docs; deal must DSCR.
Hard money
10% down · 12.0% · 12mo
- Down + closing
- —
- Monthly P&I
- —
- Monthly cashflow
- —
- DSCR
- —
- Eligible?
- —
Short-term bridge; refi at stabilization.
Listing history 17 events
-
2026-06-18days on market $79,900 Active 219 DOM
-
2026-06-17days on market $79,900 Active 218 DOM
-
2026-06-16days on market $79,900 Active 217 DOM
-
2026-06-15days on market $79,900 Active 216 DOM
-
2026-06-13days on market $79,900 Active 214 DOM
-
2026-06-12days on market $79,900 Active 213 DOM
-
2026-06-09days on market $79,900 Active 210 DOM
-
2026-06-08days on market $79,900 Active 209 DOM
-
2026-06-07days on market $79,900 Active 208 DOM
-
2026-06-07days on market $79,900 Active 207 DOM
-
2026-06-04days on market $79,900 Active 204 DOM
-
2026-06-02days on market $79,900 Active 203 DOM
-
2026-06-01days on market $79,900 Active 202 DOM
-
2026-05-31days on market $79,900 Active 201 DOM
-
2026-05-31days on market $79,900 Active 200 DOM
-
2026-04-01price $79,900
-
2025-11-11$99,900 Active
ⓘ Source: listings_history table (triggers on properties + properties_extension) + one-shot
backfill from property_details.listing_events for pre-trigger history.
Tax reassessment forecast KY · Resets to sale price
- Current annual tax
- $291 · $24/mo
- Projected year-2 tax
- $687 · $57/mo
- Expected delta
- +$396/yr (+$33/mo · 135.7%)
ⓘ Screening estimate from a state-policy table — verify with the county assessor before closing.
Climate risk First Street
- Flood 1/10 Low FEMA zone X (unshaded) · 0% chance over 30 yrs
- Wildfire 3/10 Moderate
- Heat 5/10 Major 7 d/yr ≥109°F today · 20 d/yr by 30 yrs out
- Wind 3/10 Moderate 6% chance of damaging wind over 30 yrs
- Air quality 2/10 Low 1 unhealthy d/yr today · 1 by 30 yrs out
Nearby sold comps map
Loading sold comps map…
Walkable amenities ~0.75 mi
Loading nearby amenities…
Taxation est. · year 1
- Rental income
- $14,344
- − Mortgage interest
- −$4,476
- − Property taxes
- −$291
- − Insurance
- −$400
- − Repairs & maintenance
- −$1,148
- − Management
- −$1,148
- − Depreciation
- −$2,324
- Taxable income
- $4,558
- Est. tax owed @ 24.0%
- −$1,094
- After-tax cash flow
- $4,519/yr
For passive investors: Depreciation is non-cash, so a rental often shows a tax loss while cash-flowing — sheltering income. Rental losses are passive: they offset passive income freely, and up to $25,000/yr can offset ordinary (W-2) income if you actively participate and your MAGI is under $100k (phasing out to $0 by $150k); unused losses carry forward. On sale, claimed depreciation is recaptured at up to 25%, and gains may owe capital-gains tax (a 1031 exchange can defer both). Figures are a year-1 estimate at your 24.0% rate — not tax advice; consult a CPA.
Schools (NCES district)
- District
- Hopkins County
- NCES district ID
- 2102860
- Math proficiency
- 27% ▼ -23.00%
- Reading proficiency
- 43% ▼ -17.00%
- Median HH income
- $42,436
- Composite
- 29.56/100
- National rank
- #6488
- State rank
- #65 of 165 in KY
Livability — Madisonville
- Score
- 72/100
- State rank
- #132
- US rank
- #6200
Category grades
Schools grade is shown separately in the Schools card above.
Census & demographics
- City population
- 27,095
- Population (ZIP)
- 27,095
Population outlook (Hopkins County) Hauer SSP2
- Today (2025)
- 45,164 people
- By 2030
- 44,083 · -2.4%
- By 2040
- 41,650 · -7.8%
- By 2050
- 39,303 · -13.0%
- By 2075
- 34,567 · -23.5%
- By 2100
- 29,476 · -34.7%
Race, ethnicity, and origin ACS 2023
- Neighborhood character
- Predominantly White (83%)
- Race & ethnicity
- White 83% Black 8% Two or more races 6% Hispanic / Latino 3% Native American 1%
- Common ancestry
- Lithuanian 2% Slovak 1% Serbian 1%
- Foreign-born
- 2% · Canada, China
- Languages at home
- 97% English-only · Spanish 2%
Political lean MEDSL · Hopkins
- 2024 margin
- Solid R (+50.9) · D 23.9% · R 74.8% · Other 1.2%
- 2008→2024 swing
- -26.0pp toward R · 2008: -24.9pp · 2024: -50.9pp
- All cycles
- 2024: R+50.9 2020: R+48.0 2016: R+54.0 2012: R+39.9 2008: R+24.9
Not yet ingested
- Civics
- —
Market trends
- HPI YoY
- ▼ -39.52%
- Current HPI
- 220.2269
- Rent YoY
- —
- Metro
- —
- State GDP YoY
- ▲ 1.81%
- F500 in state
- 4
Industry mix (Fortune 500 HQ in KY)
| Industry | F500 HQs | Revenue |
|---|---|---|
| Healthcare | 1 | $118B |
|
||
| Food / Beverage | 1 | $7B |
|
||
Price history
-20.0% since first listed2 events — show timeline
- 2026-04-01 Price Changed $79,900 MHCBOR
- 2025-11-11 Listed $99,900 MHCBOR
Property tax history
+27.4%/yrLatest (2025): $291 · -8.6% YoY. Source: county tax records.
Cash-flow waterfall
monthlySold comps — $/sqft
last 12 mo · ≤1 miLoading sold comps…