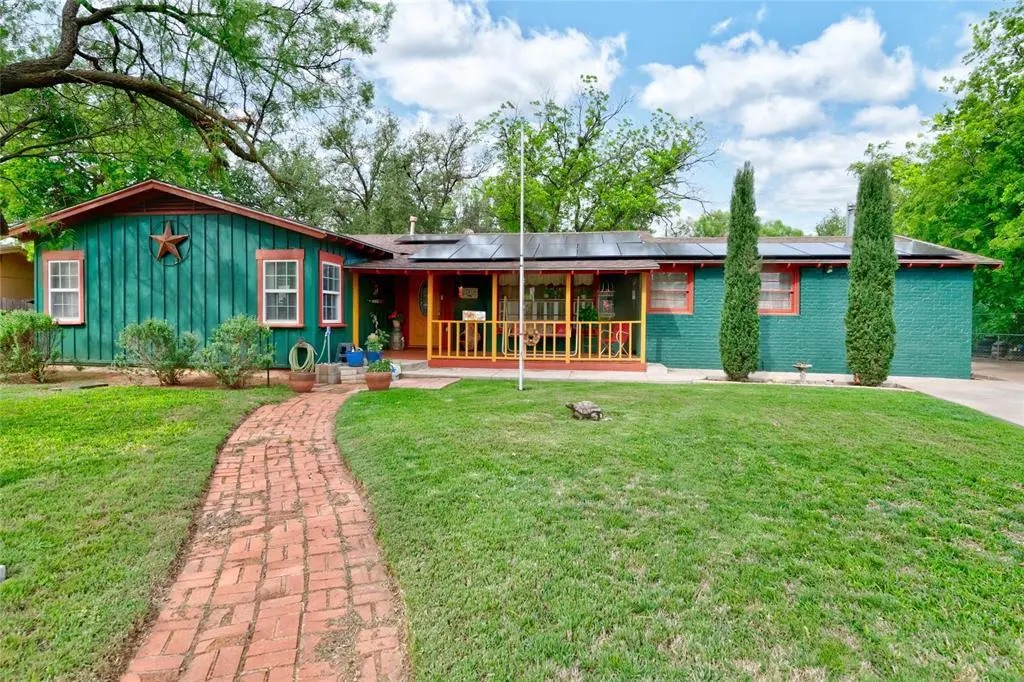
1318 Westridge Dr · Abilene, TX
Flood risk 6/10 · Moderate
- FEMA flood zone
- X (unshaded)
- Chance of flooding over 30 yrs
- 0.91%
- Est. flood insurance / yr
- $507 – $1,088
Fire risk 1/10 · Minimal
- Est. fire insurance / yr
- $1,222 – $2,270
Heat risk 6/10 · Moderate
- Hot days now (above 104°F)
- 7 days/yr
- Hot days in 30 yrs
- 23 days/yr
Wind risk 4/10 · Minor
- Chance of severe wind over 30 yrs
- 11.0%
Air-quality risk 1/10 · Minimal
- Unhealthy air days now
- 0 days/yr
- Unhealthy air days in 30 yrs
- 0 days/yr
Risk factors via First Street. Map © Google.
Why this score? — see what drove the D- grade
The composite is a weighted blend of 9 inputs, each scored 0–100. Each bar is that input's sub-score; the figure is the points it added to the 100-point composite (weight × sub-score).
- Cash flow +13.3/30.0
- Rent growth +5.0/5.0
- ARV discount +4.8/15.0
- DSCR +4.0/10.0
- Livability +3.8/5.0
- 1% rule +3.7/10.0
- Schools +2.8/10.0
- Condition / age +2.5/5.0
- Appreciation +0.0/10.0
$305,000
🖨 Deal sheet (PDF) 📄 Offer letter ✓ Due diligence
Listing remarks MLS
ESTATE OWNED; AS IS. No seller's disclosure required on Estates! Charming property with potential from top to bottom! 3 bedroom, 2 bath, and the most beautiful hard wood floors ever! Smart kitchen with stove, dishwasher and microhood provided. Front, back and side yards plus a storage building, too. Side driveway, covered porches and room to grow.
Key facts
- Large backyard
- Three car garage
- Extensive storage
Tags
Property features AI
Finance
- Other: Possession at closing/funding; Standard listing conditions; No municipal utility district
- Financial info: Listing terms include Cash, Conventional, FHA, VA
- HOA & community: No association
Exterior
- Parking: Enclosed garage with workshop and storage; 3 covered parking spaces; Additional parking available; 3-car garage (approximately 40' wide x 30' deep)
- Security: Owned security system
- Utilities: City water; City sewer; Electricity connected; Individual gas meter; Phone available; All-weather road access and curbs; alley access
- Home design: Single family residence; One story; Residential property; Security system owned
- Construction: Built in 1952; Board & batten siding; Composition/shingle roof; Slab foundation; Air purifier included
- Exterior features: Covered porch; Covered patio/porch areas; Other structures include garage(s) and workshop with electric
Interior
- Kitchen: Dishwasher; Disposal; Electric range; Microwave; Refrigerator; Water line to refrigerator; Water purifier; Built-in cabinets; Pantry and second pantry; Space for freezer
- Bedrooms: 3 bedrooms (all on main level); Primary bedroom on main level with ensuite bath
- Flooring: Luxury vinyl plank; Tile
- Bathrooms: 2 full bathrooms; Primary bath with dual sinks, built-in cabinets and granite countertop
- Heating & cooling: Central heating; Natural gas heating; Fireplace(s) for supplemental heat; Central air conditioning; Ceiling fans; Electric cooling; Roof turbine(s)
- Interior features: Cable TV available; High speed internet available; Chandelier and decorative lighting; Double vanity in bath; Pantry; Plantation shutters and window coverings; Room count: 7; One living area and one dining area
- Laundry & utility: Full-size washer/dryer area; Electric dryer hookup; Laundry located in hall; Gas water heater
Neighborhood map
What this means for you Summary
Snapshot
- This is a 3-bed/2.0-bath single-family listed at $305k.
Deal economics
- At list price, monthly cash flow is $0 ($-4/yr) — negative.
- To cash-flow at today's rent, offer at most $305k (0.0% below list).
- To meet the 1% rule (rent ≥ 1% of price), the offer needs to be $265k (13.0% below list).
- Recommended offer: $265k (13.0% below list) — sets the bar for 1% rule.
Location & tenants
- Location reads 75/100 on livability (#142 in TX, #4,037 nationally) — a middle-class / working-renter tenant base. Strengths: cost of living A+, housing A+, health & safety A+; Watch: crime D, commute F.
- Abilene ISD (urban): math 32% / reading 34% proficiency, ranked #575 of 826 in TX (top 70%) — families likely to look elsewhere, expect single-tenant / working-renter base with shorter leases.
- Zoned schools: Bonham El (math 29% / reading 28%, grade F, #2,706 of 4,322 statewide, top 63%, 482 students, 79% FRL) — zoned schools average 79% FRL vs 57% district-wide (21 pts higher); higher-poverty schools than district average — tighter screening recommended.
- Market conditions: Rents rising fast (+32.1%/yr); 118 active listings in the ZIP; 3 comparable units currently listed for rent nearby; rentals lingering (median 46d on market — plan ~5-8 weeks vacancy on turnover, expect pricing pressure); 67% of comp listings sitting > 30 days — soft ceiling on asking rent; 508 units permitted in Taylor County in 2024 (0 in 5+ unit buildings).
- At $2,653/mo this rent would consume 51% of the median local household income ($63k/yr) (locally 1096% of renters already pay >50% of income on rent) — very limited rent-growth headroom before tenants either downsize or default.
Forward outlook
- Local home prices are declining (-3.0%/yr); year-one equity from $2k of loan paydown is wiped out by about $9k of value loss. Plan a longer hold.
- Taylor County population projected at +16% by 2050 — long-run rental-demand tailwind backs the buy-and-hold thesis.
Negotiation context
- It's been on market 25 days — a 2% lower offer ($300k) is reasonable based on typical stale-listing flexibility.
- 2 sale attempts since 8y ago with the ask held roughly flat each time — persistent listings suggest the price (not the market) is what's stuck; bring a comps-based counter.
Risks & watch-outs
- Watch-outs: built in 1952 — expect roof / HVAC / electrical / plumbing capex.
- Climate carrying-cost: major flood risk; extreme-heat days projected 7→23/yr by 2055 (HVAC capex compounding) — expect insurance premiums to compound above CPI over the hold.
Questions for the listing agent
- What do current leases actually rent for vs. the listed asking? Can we see a recent rent roll and the last 12 months of T-12 income?
- Built in 1952 — when were the roof, HVAC, electrical panel, plumbing, and water heater last replaced?
- Is there a deadline driving the sale (1031 exchange, divorce, estate, relocation)? That informs how much negotiation room exists.
- Schools are D-rated, which usually means shorter tenancies and higher turnover. Who's the typical renter profile here, and what's been the actual vacancy rate?
- Crime grade is D in this area — have there been break-ins, vandalism, or insurance claims at this property in the last 3 years? What carrier currently insures it and at what premium?
- The area grade is low — what's the realistic commute time and amenity access for the typical tenant pool here? Any planned neighborhood developments (good or bad) we should know about?
- What's the average days-on-market for RENTAL listings here right now (not sales)? A rising rental-DOM trend means longer vacancies and softer asking-rent achievability than the comps imply.
- What's the recent tenant-quality profile in this submarket — average credit score on applications, eviction rate, late-payment / NSF rate, and stable-employment percentage? A property-management company in the area should have these aggregated.
- How much new for-sale + rental construction is in the pipeline within 1–3 miles? Heavy new supply typically softens prices + rents 12–24 months out; constrained supply supports both.
Investment metrics
- 1% rule
- 0.87% ✗
- Cap rate
- 6.29%
- Cash-on-cash
- -0.00%
- DSCR
- 1.00
- GRM
- 9.6
CMA / ARV
- ARV (on-the-fly)
- $287,868
- Comps found
- 12
Show comp detail 12 sales within ~0.75 mi
| Address | Dist | Beds/Ba | Sqft | Sold | Price | $/sf | Match |
|---|---|---|---|---|---|---|---|
| 1318 Westridge Dr | 0.00mi | 3/2.0 | 2,086 (0%) | 0mo | $305,000 | $146 | 100 |
| 4102 Hartford St | 0.13mi | 3/2.0 | 2,063 (-1%) | 6mo | $275,000 | $133 | 87 |
| 1018 S Pioneer Dr | 0.39mi | 3/2.0 | 2,210 (+6%) | 5mo | $210,000 | $95 | 68 |
| 1626 Glenwood Dr | 0.73mi | 3/2.0 | 2,124 (+2%) | 2mo | $245,000 | $115 | 62 |
| 865 S Leggett Dr | 0.60mi | 2/2.0 (-1) | 2,069 (-1%) | 9mo | $239,000 | $116 | 58 |
| 817 Rivercrest Dr | 0.72mi | 3/2.0 | 2,268 (+9%) | 1mo | $399,000 | $176 | 51 |
| 1101 Albany St | 0.73mi | 3/2.0 | 2,248 (+8%) | 4mo | $299,900 | $133 | 49 |
| 1317 Hollis Dr | 0.56mi | 3/2.0 | 1,859 (-11%) | 8mo | $299,900 | $161 | 49 |
| 125 Circle Of Holly | 0.65mi | 3/2.5 | 1,845 (-12%) | 4mo | $305,000 | $165 | 45 |
| 3418 S 11th St | 0.69mi | 4/2.0 (+1) | 2,211 (+6%) | 9mo | $305,000 | $138 | 45 |
| 2033 River Oaks Cir | 0.57mi | 3/2.0 | 1,827 (-12%) | 10mo | $299,900 | $164 | 45 |
| 1201 Albany St | 0.71mi | 3/2.0 | 1,854 (-11%) | 9mo | $225,000 | $121 | 41 |
Match score weights: distance 35% · size 25% · config 20% · recency 20%. Top-matched comps best support the ARV.
Projected returns pro-forma
-3.0% appreciation · 8.0% rent growth · sell at horizon
- IRR
- -10.9%
- Equity multiple
- 0.59×
- Total profit
- $-35,393
- Equity at exit
- $45,476
- IRR
- 4.3%
- Equity multiple
- 1.39×
- Total profit
- $33,090
- Equity at exit
- $26,371
Cash invested: $85,400 (down + closing). Projections, not guarantees.
Landlord ↔ Tenant lean methodology
- Overall (STATE)
- 87 Strongly Landlord-Friendly
- State Texas
- 87 Strongly Landlord-Friendly · R+5
- County
- — inherits STATE
- City
- — inherits STATE
ZIP-level market 79605
- Rents YoY
- 32.1%
- Active inventory
- 118
- Price-to-rent
- 9.6×
Monthly cashflow live
- Estimated rent
- $2,653 medium interval (Pro) →
- Mortgage (P&I)
- −$1,599
- Tax from tax record
- −$369 /mo · $4,432/yr
- Insurance
- −$127
- HOA
- −$0
- Vacancy / Maint / Mgmt
- −$557
- Net cashflow
- $-0
Break-even live
Sensitivity live
| Price | -10% $172 | -5% $86 | +0% $0 | +5% $-87 | +10% $-173 |
|---|---|---|---|---|---|
| Rent | -10% $-210 | -5% $-105 | +0% $0 | +5% $104 | +10% $209 |
| Rate | -1.0pp $153 | -0.5pp $77 | base $0 | +0.5pp $-79 | +1.0pp $-160 |
UW: 25.0% down · 7.5% · 30yr · 1.5% tax · 5.0% vac · 8.0% maint · 8.0% mgmt
Financing live
Cash to close
- Down payment
- $76,250
- Closing costs
- $9,150
- Reserves months
- —
- Total cash needed
- —
Loan-product check · same deal, 3 products live
Conventional
25% down · 7.5% · 30yr
- Down + closing
- —
- Monthly P&I
- —
- Monthly cashflow
- —
- DSCR
- —
- Eligible?
- —
Personal DTI + credit; lowest rate.
DSCR
20% down · 8.5% · 30yr
- Down + closing
- —
- Monthly P&I
- —
- Monthly cashflow
- —
- DSCR
- —
- Eligible?
- —
No personal income docs; deal must DSCR.
Hard money
10% down · 12.0% · 12mo
- Down + closing
- —
- Monthly P&I
- —
- Monthly cashflow
- —
- DSCR
- —
- Eligible?
- —
Short-term bridge; refi at stabilization.
Rent comps 3 comps
| Address | Beds | Baths | Sqft | Rent | $/sqft | DOM | Units | Dist |
|---|---|---|---|---|---|---|---|---|
| 2301 Post Oak Rd Abilene, TX | 3.0 | 2.0 | 1915 | $3,295 | $1.72 | 23d | 1 | 0.86mi |
| 3373 S 27th St Abilene, TX | 2.0 | 2.0 | 1436 | $1,700 | $1.18 | 45d | 1 | 1.30mi |
| 25 Juniper Cir Abilene, TX | 4.0 | 3.0 | 2557 | $3,500 | $1.37 | 45d | 1 | 1.36mi |
Listing history 8 events
-
2026-05-20status Pending
-
2026-04-28historical Active Option Contract
-
2026-04-24$305,000 Active
-
2019-01-15soldstatus
-
2019-01-10soldstatus Sold 350-char remark
Show marketing remark (350 chars)
ESTATE OWNED; AS IS. No seller's disclosure required on Estates! Charming property with potential from top to bottom! 3 bedroom, 2 bath, and the most beautiful hard wood floors ever! Smart kitchen with stove, dishwasher and microhood provided. Front, back and side yards plus a storage building, too. Side driveway, covered porches and room to grow.
-
2018-11-26status Pending 350-char remark
Show marketing remark (350 chars)
ESTATE OWNED; AS IS. No seller's disclosure required on Estates! Charming property with potential from top to bottom! 3 bedroom, 2 bath, and the most beautiful hard wood floors ever! Smart kitchen with stove, dishwasher and microhood provided. Front, back and side yards plus a storage building, too. Side driveway, covered porches and room to grow.
-
2018-11-05historical Active Option Contract 350-char remark
Show marketing remark (350 chars)
ESTATE OWNED; AS IS. No seller's disclosure required on Estates! Charming property with potential from top to bottom! 3 bedroom, 2 bath, and the most beautiful hard wood floors ever! Smart kitchen with stove, dishwasher and microhood provided. Front, back and side yards plus a storage building, too. Side driveway, covered porches and room to grow.
-
2018-10-22$129,900 Active 350-char remark
Show marketing remark (350 chars)
ESTATE OWNED; AS IS. No seller's disclosure required on Estates! Charming property with potential from top to bottom! 3 bedroom, 2 bath, and the most beautiful hard wood floors ever! Smart kitchen with stove, dishwasher and microhood provided. Front, back and side yards plus a storage building, too. Side driveway, covered porches and room to grow.
ⓘ Source: listings_history table (triggers on properties + properties_extension) + one-shot
backfill from property_details.listing_events for pre-trigger history.
Tax reassessment forecast TX · Resets to sale price
- Current annual tax
- $4,432 · $369/mo
- Projected year-2 tax
- $5,582 · $465/mo
- Expected delta
- +$1,150/yr (+$96/mo · 25.9%)
ⓘ Screening estimate from a state-policy table — verify with the county assessor before closing.
Climate risk First Street
- Flood 6/10 Major FEMA zone X (unshaded) · 91% chance over 30 yrs
- Wildfire 1/10 Low
- Heat 6/10 Major 7 d/yr ≥104°F today · 23 d/yr by 30 yrs out
- Wind 4/10 Moderate 11% chance of damaging wind over 30 yrs
- Air quality 1/10 Low 0 unhealthy d/yr today · 0 by 30 yrs out
Nearby sold comps map
Loading sold comps map…
Walkable amenities ~0.75 mi
Loading nearby amenities…
Taxation est. · year 1
- Rental income
- $31,831
- − Mortgage interest
- −$17,085
- − Property taxes
- −$4,432
- − Insurance
- −$1,525
- − Repairs & maintenance
- −$2,546
- − Management
- −$2,546
- − Depreciation
- −$8,873
- Taxable loss
- −$5,176
- Est. tax savings @ 24.0%
- +$1,242
- After-tax cash flow
- $1,238/yr
For passive investors: Depreciation is non-cash, so a rental often shows a tax loss while cash-flowing — sheltering income. Rental losses are passive: they offset passive income freely, and up to $25,000/yr can offset ordinary (W-2) income if you actively participate and your MAGI is under $100k (phasing out to $0 by $150k); unused losses carry forward. On sale, claimed depreciation is recaptured at up to 25%, and gains may owe capital-gains tax (a 1031 exchange can defer both). Figures are a year-1 estimate at your 24.0% rate — not tax advice; consult a CPA.
Schools (NCES district)
- District
- Abilene ISD
- NCES district ID
- 4807440
- Math proficiency
- 32% ▼ -11.00%
- Reading proficiency
- 34% ▼ -5.00%
- Median HH income
- $39,782
- Composite
- 27.71/100
- National rank
- #6909
- State rank
- #575 of 826 in TX
Livability — Abilene
- Score
- 75/100
- State rank
- #142
- US rank
- #4037
Category grades
Schools grade is shown separately in the Schools card above.
Census & demographics
- Census place
- Abilene, TX
- County
- Taylor County · 136,672 people
- City population
- 136,672
- Metro
- Abilene, TX
- Population (ZIP)
- 28,467
- Household income
- $62,929
- Rent vs Own
- Severe rent burden
- 1096.0
Population outlook (Taylor County) Hauer SSP2
- Today (2025)
- 145,270 people
- By 2030
- 150,050 · +3.3%
- By 2040
- 159,417 · +9.7%
- By 2050
- 168,883 · +16.3%
- By 2075
- 194,436 · +33.8%
- By 2100
- 203,163 · +39.9%
Race, ethnicity, and origin ACS 2023
- Neighborhood character
- Majority White (63%)
- Race & ethnicity
- White 63% Hispanic / Latino 22% Two or more races 12% Black 8% Asian 2%
- Hispanic origin (detail)
- Mexican 19%
- Common ancestry
- Slovak 2% Lithuanian 1% Serbian 1%
- Foreign-born
- 6% · Canada
- Languages at home
- 84% English-only · Spanish 14% German/W. Germanic 1% Other Asian/Pacific 0%
Political lean MEDSL · Taylor
- 2024 margin
- Solid R (+49.8) · D 24.6% · R 74.4% · Other 1.0%
- 2008→2024 swing
- -4.2pp toward R · 2008: -45.6pp · 2024: -49.8pp
- All cycles
- 2024: R+49.8 2020: R+45.3 2016: R+51.1 2012: R+53.6 2008: R+45.6
Not yet ingested
- Civics
- —
Market trends
- HPI YoY
- ▼ -181.75%
- Current HPI
- 201.2341
- Rent YoY
- ▲ 32.08%
- Metro
- Abilene, TX
- State GDP YoY
- ▲ 3.95%
- F500 in state
- 110
Industry mix (Fortune 500 HQ in TX)
| Industry | F500 HQs | Revenue |
|---|---|---|
| Energy | 16 | $1,198B |
|
||
| Technology | 5 | $198B |
|
||
| Engineering / Construction | 4 | $72B |
|
||
| Energy Services | 3 | $60B |
|
||
| Utilities | 3 | $41B |
|
||
| Healthcare | 2 | $330B |
|
||
Price history
+134.8% since first listed8 events — show timeline
- 2026-05-20 Pending — NTREIS
- 2026-04-28 Contingent — NTREIS
- 2026-04-24 Listed $305,000 NTREIS
- 2019-01-15 Sold (Public Records) — Public Records
- 2019-01-10 Sold (MLS) — NTREIS
- 2018-11-26 Pending — NTREIS
- 2018-11-05 Contingent — NTREIS
- 2018-10-22 Listed $129,900 NTREIS
Property tax history
+5.8%/yrLatest (2025): $4,432 · +0.4% YoY. Source: county tax records.
Cash-flow waterfall
monthlySold comps — $/sqft
last 12 mo · ≤1 miLoading sold comps…