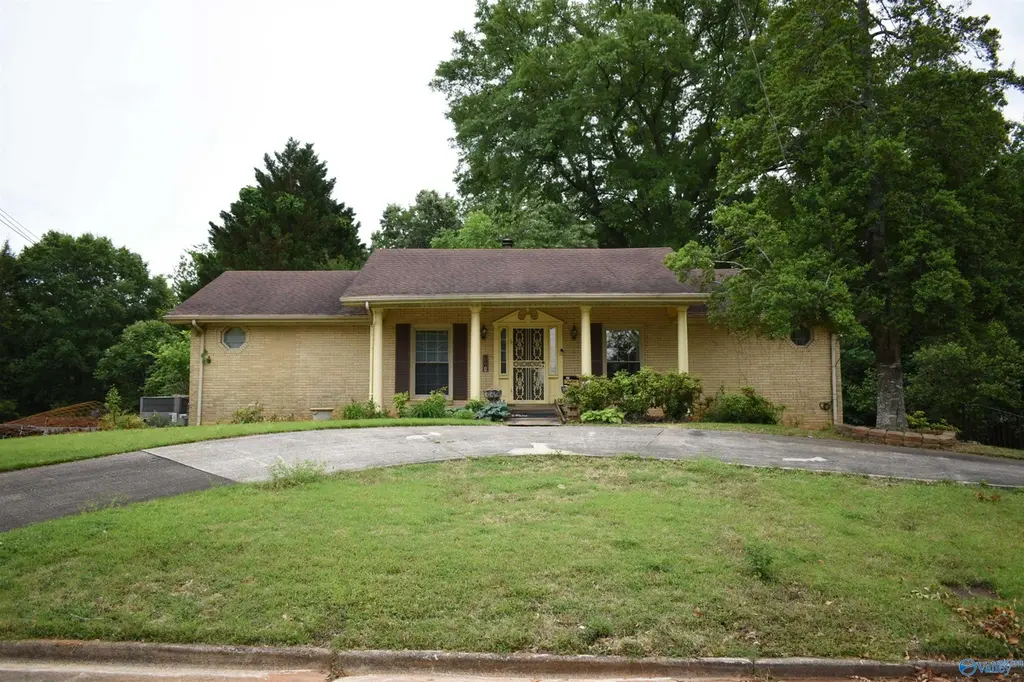
3305 Greymont Dr · Huntsville, AL
Flood risk 1/10 · Minimal
- FEMA flood zone
- X (unshaded)
- Chance of flooding over 30 yrs
- 0.0%
- Est. flood insurance / yr
- $507 – $1,088
Fire risk 2/10 · Minimal
- Est. fire insurance / yr
- $916 – $1,700
Heat risk 6/10 · Moderate
- Hot days now (above 105°F)
- 7 days/yr
- Hot days in 30 yrs
- 20 days/yr
Wind risk 4/10 · Minor
- Chance of severe wind over 30 yrs
- 19.0%
Air-quality risk 2/10 · Minimal
- Unhealthy air days now
- 1 days/yr
- Unhealthy air days in 30 yrs
- 1 days/yr
Risk factors via First Street. Map © Google.
Why this score? — see what drove the D- grade
The composite is a weighted blend of 9 inputs, each scored 0–100. Each bar is that input's sub-score; the figure is the points it added to the 100-point composite (weight × sub-score).
- ARV discount +15.0/15.0
- Cash flow +7.7/30.0
- Livability +4.1/5.0
- Rent growth +3.0/5.0
- Schools +2.9/10.0
- Condition / age +2.5/5.0
- DSCR +1.8/10.0
- 1% rule +1.2/10.0
- Appreciation +0.0/10.0
$300,000
🖨 Deal sheet (PDF) 📄 Offer letter ✓ Due diligence
Listing remarks
Property sold AS IS. sold before going on the market
Key facts
- 0.41 acre lot
- 2 garage spots
- Built 1961
Neighborhood map
What this means for you Summary
Snapshot
- This is a 3-bed/1.0-bath single-family listed at $300k.
Deal economics
- At list price, monthly cash flow is $-350 ($-4k/yr) — negative.
- To cash-flow at today's rent, offer at most $238k (20.6% below list).
- To meet the 1% rule (rent ≥ 1% of price), the offer needs to be $186k (37.9% below list).
- Recommended offer: $186k (37.9% below list) — sets the bar for 1% rule.
- Cap rate 4.9% vs local median 3.8% in Huntsville — meaningfully above typical; check what's discounted (condition, days-on-market, listing class) to confirm the premium yield is real.
Location & tenants
- Location reads 82/100 on livability (#3 in AL, #1,082 nationally) — a professional / high-income tenant draw. Strengths: commute A+, cost of living A+, housing A+; Watch: crime F.
- Huntsville City (urban): math 21% / reading 46% proficiency, ranked #48 of 129 in AL (top 37%) — families likely to look elsewhere, expect single-tenant / working-renter base with shorter leases.
- Zoned schools: Jones Valley Elementary School (math 36% / reading 68%, grade C-, #102 of 627 statewide, top 17%, 456 students, 36% FRL); Huntsville Junior High School (math 20% / reading 45%, grade F, #105 of 257 statewide, top 42%, 418 students, 38% FRL); Huntsville High School (math 41% / reading 51%, grade D-, #18 of 305 statewide, top 6%, 1,826 students, 28% FRL).
- Market conditions: Rents rising (+2.1%/yr); 175 active listings in the ZIP; 13 comparable units currently listed for rent nearby; rentals lingering (median 44d on market — plan ~5-8 weeks vacancy on turnover, expect pricing pressure); 54% of comp listings sitting > 30 days — soft ceiling on asking rent; solid renter incomes; 4,709 units permitted in Madison County in 2024 (1,186 in 5+ unit buildings).
Forward outlook
- Local home prices are declining (-3.0%/yr); year-one equity from $2k of loan paydown is wiped out by about $9k of value loss. Plan a longer hold.
- Madison County population projected at +18% by 2050 — long-run rental-demand tailwind backs the buy-and-hold thesis.
Negotiation context
- Only 0 days on market — expect competitive offers; lowballing is unlikely to land.
Risks & watch-outs
- Climate carrying-cost: extreme-heat days projected 7→20/yr by 2055 (HVAC capex compounding) — expect insurance premiums to compound above CPI over the hold.
Questions for the listing agent
- What do current leases actually rent for vs. the listed asking? Can we see a recent rent roll and the last 12 months of T-12 income?
- Built in 1961 — when were the roof, HVAC, electrical panel, plumbing, and water heater last replaced?
- Is there a deadline driving the sale (1031 exchange, divorce, estate, relocation)? That informs how much negotiation room exists.
- Crime grade is F in this area — have there been break-ins, vandalism, or insurance claims at this property in the last 3 years? What carrier currently insures it and at what premium?
- The area grade is low — what's the realistic commute time and amenity access for the typical tenant pool here? Any planned neighborhood developments (good or bad) we should know about?
- What's the average days-on-market for RENTAL listings here right now (not sales)? A rising rental-DOM trend means longer vacancies and softer asking-rent achievability than the comps imply.
- What's the recent tenant-quality profile in this submarket — average credit score on applications, eviction rate, late-payment / NSF rate, and stable-employment percentage? A property-management company in the area should have these aggregated.
- How much new for-sale + rental construction is in the pipeline within 1–3 miles? Heavy new supply typically softens prices + rents 12–24 months out; constrained supply supports both.
Investment metrics
- 1% rule
- 0.62% ✗
- Cap rate
- 4.89%
- Cash-on-cash
- -5.00%
- DSCR
- 0.78
- GRM
- 13.4
CMA / ARV
- ARV (on-the-fly)
- $391,085
- Comps found
- 12
Show comp detail 12 sales within ~0.75 mi
| Address | Dist | Beds/Ba | Sqft | Sold | Price | $/sf | Match |
|---|---|---|---|---|---|---|---|
| 100 Winthrop Dr SW | 0.18mi | 4/2.5 (+1) | 1,905 (+5%) | 5mo | $415,000 | $218 | 68 |
| 202 Wingate Ave | 0.39mi | 2/2.5 (-1) | 1,829 (+0%) | 7mo | $335,000 | $183 | 64 |
| 100 Westchester Ave SW | 0.29mi | 3/2.0 | 1,687 (-7%) | 9mo | $320,000 | $190 | 63 |
| 2716 Overton Rd | 0.62mi | 3/2.5 | 1,831 (+1%) | 2mo | $435,000 | $238 | 62 |
| 211 Kent Rd SW | 0.53mi | 2/2.5 (-1) | 1,848 (+2%) | 5mo | $360,000 | $195 | 58 |
| 303 Wingate Ave SW | 0.55mi | 4/2.0 (+1) | 1,805 (-1%) | 11mo | $387,500 | $215 | 55 |
| 228 Drake Ave | 0.54mi | 3/2.0 | 1,589 (-13%) | 3mo | $315,000 | $198 | 47 |
| 2609 Woodview Dr | 0.68mi | 2/2.0 (-1) | 1,730 (-5%) | 7mo | $350,000 | $202 | 45 |
| 301 Wingate Ave SW | 0.54mi | 3/2.5 | 2,018 (+11%) | 7mo | $452,500 | $224 | 45 |
| 2603 Alabama St SW | 0.74mi | 3/2.0 | 2,037 (+12%) | 10mo | $493,000 | $242 | 33 |
| 3067 Dupree Dr | 0.69mi | 3/2.5 | 2,022 (+11%) | 12mo | $439,900 | $218 | 33 |
| 501 Vance Rd SW | 0.65mi | 4/3.0 (+1) | 2,090 (+15%) | 1mo | $440,000 | $211 | 31 |
Match score weights: distance 35% · size 25% · config 20% · recency 20%. Top-matched comps best support the ARV.
Projected returns pro-forma
-3.0% appreciation · 2.06% rent growth · sell at horizon
- IRR
- -25.8%
- Equity multiple
- 0.13×
- Total profit
- $-72,760
- Equity at exit
- $44,731
- IRR
- -25.2%
- Equity multiple
- -0.19×
- Total profit
- $-99,585
- Equity at exit
- $25,939
Cash invested: $84,000 (down + closing). Projections, not guarantees.
Landlord ↔ Tenant lean methodology
- Overall (STATE)
- 90 Strongly Landlord-Friendly
- State Alabama
- 90 Strongly Landlord-Friendly · R+15
- County
- — inherits STATE
- City
- — inherits STATE
ZIP-level market 35801
- Home prices YoY
- -28.0%
- Rents YoY
- 2.1%
- Active inventory
- 175
- Price-to-rent
- 13.4×
Monthly cashflow live
- Estimated rent
- $1,864 high interval (Pro) →
- Mortgage (P&I)
- −$1,573
- Tax from tax record
- −$124 /mo · $1,487/yr
- Insurance
- −$125
- HOA
- −$0
- Vacancy / Maint / Mgmt
- −$391
- Net cashflow
- $-350
Break-even live
Sensitivity live
| Price | -10% $-180 | -5% $-265 | +0% $-350 | +5% $-435 | +10% $-520 |
|---|---|---|---|---|---|
| Rent | -10% $-497 | -5% $-423 | +0% $-350 | +5% $-276 | +10% $-202 |
| Rate | -1.0pp $-199 | -0.5pp $-273 | base $-350 | +0.5pp $-427 | +1.0pp $-507 |
UW: 25.0% down · 7.5% · 30yr · 1.5% tax · 5.0% vac · 8.0% maint · 8.0% mgmt
Financing live
Cash to close
- Down payment
- $75,000
- Closing costs
- $9,000
- Reserves months
- —
- Total cash needed
- —
Loan-product check · same deal, 3 products live
Conventional
25% down · 7.5% · 30yr
- Down + closing
- —
- Monthly P&I
- —
- Monthly cashflow
- —
- DSCR
- —
- Eligible?
- —
Personal DTI + credit; lowest rate.
DSCR
20% down · 8.5% · 30yr
- Down + closing
- —
- Monthly P&I
- —
- Monthly cashflow
- —
- DSCR
- —
- Eligible?
- —
No personal income docs; deal must DSCR.
Hard money
10% down · 12.0% · 12mo
- Down + closing
- —
- Monthly P&I
- —
- Monthly cashflow
- —
- DSCR
- —
- Eligible?
- —
Short-term bridge; refi at stabilization.
Rent comps 13 comps
| Address | Beds | Baths | Sqft | Rent | $/sqft | DOM | Units | Dist |
|---|---|---|---|---|---|---|---|---|
| 4770 Whitesburg Dr Unit 302 Huntsville, AL | 2.0 | 2.0 | 1260 | $1,875 | $1.49 | 44d | 1 | 0.38mi |
| 4006 Devon St SE Huntsville, AL | 3.0 | 2.0 | 2000 | $2,500 | $1.25 | 44d | 1 | 0.44mi |
| 515 Chateau Dr SW Huntsville, AL | 1.0–3.0 | 1.0–2.0 | 932 | $1,299 | $1.39 | 14d | 6 | 0.46mi |
| 2709 Thornton Cir SW Huntsville, AL | 4.0 | 3.0 | 2511 | $2,950 | $1.17 | 24d | 1 | 0.56mi |
| 2510 Whitesburg Dr SW Huntsville, AL | 2.0 | 1.5 | 1242 | $1,550 | $1.25 | 44d | 1 | 0.67mi |
| 5006 Chancel Dr SE #3 Huntsville, AL | 2.0 | 2.0 | 1846 | $1,100 | $0.60 | 44d | 1 | 0.68mi |
| 2404 Whitesburg Dr SW Huntsville, AL | 2.0 | 2.5 | 1355 | $1,700 | $1.25 | 24d | 1 | 0.78mi |
| 3006 Dupree Dr SW Huntsville, AL | 3.0 | 2.5 | 1591 | $1,800 | $1.13 | 44d | 1 | 0.79mi |
| 201 Queensbury Dr SW Huntsville, AL | 1.0–3.0 | 1.0–2.5 | 1171 | $1,389 | $1.19 | 14d | 15 | 0.80mi |
| 5630 Woodridge St SW Huntsville, AL | 3.0 | 3.0 | 2117 | $1,850 | $0.87 | 44d | 1 | 1.10mi |
| 2209 California St SE Huntsville, AL | 4.0 | 2.0 | 1754 | $2,000 | $1.14 | 24d | 1 | 1.15mi |
| 2308 Gallatin St SW Huntsville, AL | 3.0 | 2.0 | 1988 | $2,100 | $1.06 | 14d | 1 | 1.22mi |
| 2209 Gallatin St SW Huntsville, AL | 3.0 | 2.0 | 1658 | $2,100 | $1.27 | 44d | 1 | 1.28mi |
Listing history 2 events
-
2026-04-30historical
-
2026-04-29$300,000
ⓘ Source: listings_history table (triggers on properties + properties_extension) + one-shot
backfill from property_details.listing_events for pre-trigger history.
Tax reassessment forecast AL · Resets to sale price
- Current annual tax
- $1,487 · $124/mo
- Projected year-2 tax
- $1,487 · $124/mo
- Expected delta
- $0/yr ($0/mo · 0.0%)
ⓘ Screening estimate from a state-policy table — verify with the county assessor before closing.
Climate risk First Street
- Flood 1/10 Low FEMA zone X (unshaded) · 0% chance over 30 yrs
- Wildfire 2/10 Low
- Heat 6/10 Major 7 d/yr ≥105°F today · 20 d/yr by 30 yrs out
- Wind 4/10 Moderate 19% chance of damaging wind over 30 yrs
- Air quality 2/10 Low 1 unhealthy d/yr today · 1 by 30 yrs out
Nearby sold comps map
Loading sold comps map…
Walkable amenities ~0.75 mi
Loading nearby amenities…
Taxation est. · year 1
- Rental income
- $22,366
- − Mortgage interest
- −$16,805
- − Property taxes
- −$1,487
- − Insurance
- −$1,500
- − Repairs & maintenance
- −$1,789
- − Management
- −$1,789
- − Depreciation
- −$8,727
- Taxable loss
- −$9,732
- Est. tax savings @ 24.0%
- +$2,336
- After-tax cash flow
- $-1,861/yr
For passive investors: Depreciation is non-cash, so a rental often shows a tax loss while cash-flowing — sheltering income. Rental losses are passive: they offset passive income freely, and up to $25,000/yr can offset ordinary (W-2) income if you actively participate and your MAGI is under $100k (phasing out to $0 by $150k); unused losses carry forward. On sale, claimed depreciation is recaptured at up to 25%, and gains may owe capital-gains tax (a 1031 exchange can defer both). Figures are a year-1 estimate at your 24.0% rate — not tax advice; consult a CPA.
Schools (NCES district)
- District
- Huntsville City
- NCES district ID
- 0101800
- Math proficiency
- 21% ▼ -23.00%
- Reading proficiency
- 46% ▬ 0.00%
- Median HH income
- $48,264
- Composite
- 28.84/100
- National rank
- #6647
- State rank
- #48 of 129 in AL
Livability — Huntsville
- Score
- 82/100
- State rank
- #3
- US rank
- #1082
Category grades
Schools grade is shown separately in the Schools card above.
Census & demographics
- Census place
- Huntsville, AL
- County
- Madison County · 380,832 people
- City population
- 220,435
- Metro
- Huntsville, AL
- Population (ZIP)
- 23,357
- Household income
- $105,585
- Rent vs Own
- Severe rent burden
- 547.0
Population outlook (Madison County) Hauer SSP2
- Today (2025)
- 392,086 people
- By 2030
- 409,788 · +4.5%
- By 2040
- 440,557 · +12.4%
- By 2050
- 460,990 · +17.6%
- By 2075
- 502,872 · +28.3%
- By 2100
- 513,623 · +31.0%
Race, ethnicity, and origin ACS 2023
- Neighborhood character
- Predominantly White (81%)
- Race & ethnicity
- White 81% Black 8% Two or more races 8% Hispanic / Latino 4% Asian 1%
- Common ancestry
- Italian 6% Lithuanian 3% Slovak 3%
- Foreign-born
- 4% · Canada, China
- Languages at home
- 96% English-only · Spanish 3% German/W. Germanic 1% Other Indo-European 1%
Political lean MEDSL · Madison
- 2024 margin
- Lean R (+9.0) · D 44.7% · R 53.7% · Other 1.6%
- 2008→2024 swing
- +6.0pp toward D · 2008: -14.9pp · 2024: -9.0pp
- All cycles
- 2024: R+9.0 2020: R+8.0 2016: R+16.8 2012: R+18.7 2008: R+14.9
Not yet ingested
- Civics
- —
Market trends
- HPI YoY
- ▼ -182.95%
- Current HPI
- 471.094
- Rent YoY
- ▲ 2.06%
- Metro
- Huntsville, AL
- State GDP YoY
- ▲ 2.94%
- F500 in state
- 4
Industry mix (Fortune 500 HQ in AL)
| Industry | F500 HQs | Revenue |
|---|---|---|
| Financial Services | 1 | $8B |
|
||
| Healthcare | 1 | $5B |
|
||
Price history
2 events — show timeline
- 2026-04-30 Delisted — VMLS
- 2026-04-29 Listed $300,000 VMLS
Property tax history
+8.2%/yrLatest (2023): $1,487 · +48.4% YoY. Source: county tax records.
Cash-flow waterfall
monthlySold comps — $/sqft
last 12 mo · ≤1 miLoading sold comps…