 20-Plex
208 N Church St · Hillsboro, TX
Flood risk 1/10 · Minimal
- FEMA flood zone
- X (unshaded)
- Chance of flooding over 30 yrs
- 0.0%
- Est. flood insurance / yr
- $507 – $1,088
Fire risk 5/10 · Moderate
- Est. fire insurance / yr
- $1,222 – $2,270
Heat risk 7/10 · Major
- Hot days now (above 108°F)
- 7 days/yr
- Hot days in 30 yrs
- 23 days/yr
Wind risk 6/10 · Moderate
- Chance of severe wind over 30 yrs
- 27.0%
Air-quality risk 2/10 · Minimal
- Unhealthy air days now
- 1 days/yr
- Unhealthy air days in 30 yrs
- 1 days/yr
Risk factors via First Street. Map © Google.
Why this score? — see what drove the B- grade
The composite is a weighted blend of 9 inputs, each scored 0–100. Each bar is that input's sub-score; the figure is the points it added to the 100-point composite (weight × sub-score).
- Cash flow +30.0/30.0
- DSCR +10.0/10.0
- 1% rule +8.7/10.0
- ARV discount +7.5/15.0
- Schools +3.5/10.0
- Livability +3.2/5.0
- Rent growth +2.5/5.0
- Condition / age +2.5/5.0
- Appreciation +0.0/10.0
$1,395,000
🖨 Deal sheet 📄 Offer letter ✓ Due diligence
Multi-family units
County records classify this as Multi-Family (5+ Unit). Listing-text estimate: 20 units. confirmed
5+ unit building — per-unit beds/baths from public records are typically unavailable; the breakdown below (if shown) is an estimate from the listing text.
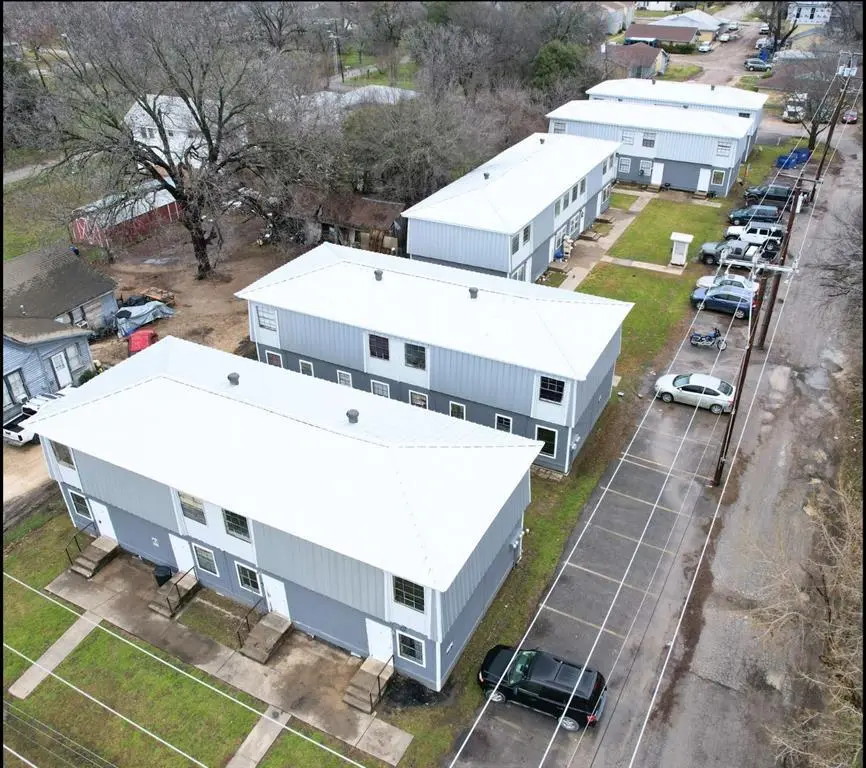
Listing remarks
The Hillsboro Oaks Apartments. Located in downtown Hillsboro, TX just two city blocks from the Hill County courthouse with easy access to I-35, and less than a 1 hour drive from Fort Worth. Acquisition of this 20 unit apartment complex presents a value add opportunity for multi family investors. All 2 bed, 1.5 bath units range from approximately 750-1,000 SqFt and rent for an average of one dollar per SqFt plus utilities. Units were renovated in 2021 with new higher grade materials, systems and features including carpet, countertops, paint, LVP flooring, appliances, HVAC units, resurfaced parking lot and new metal roofing and siding. Please contact listing agent for rent roll & expens
Key facts
- Renovated in 2021
- New metal roofing
- 0.65 acre lot
Tags
Property features AI
Finance
- Other: Property type: Residential income, multi family; Building area (appraiser): 15,250; Parcel number: 106908; County: Hill; Directions: Please use GPS
- Financial info: Gross annual income: $174,209; Gross annual expenses: $51,620; Insurance expense: $15,487; Net operating income: $122,589; Occupancy rate: 85%; Capitalization rate: 8.79%
- HOA & community: No association
Exterior
- Parking: 31 parking spaces
- Utilities: City water; City sewer; Electricity connected; Cable available; Phone available
- Home design: Multi-family residential income property; Two levels; Built in 1984; Complex: Hillsboro Oaks Apartments
- Construction: Frame, wood and metal siding construction; Metal roof; Pillar/post/pier foundation; 5 buildings totaling 20 units (this listing is 1 unit)
- Exterior features: Asphalt common parking; Lot approximately 0.65 acres; Will not subdivide; Subdivision: Harden
Interior
- Kitchen: Dishwasher; Electric cooktop; Electric oven; Electric range; Refrigerator; Electric water heater
- Bedrooms: 2 bedrooms
- Flooring: Luxury vinyl plank
- Bathrooms: 1 full bathroom
- Heating & cooling: Central air; Ceiling fans; Electric heating
- Interior features: Open floor plan; Cable TV available
- Laundry & utility: Master water meter
Neighborhood map
What this means for you Summary
Snapshot
- This is a 20 × 2.0-bed/1.5-bath units multifamily listed at $1.40M.
Deal economics
- At list price, monthly cash flow is $6k ($73k/yr) — positive. Per door: $305/mo.
- The deal already cash-flows at list — no discount required.
- Meets the 1% rule at list price ($19k rent vs $1.40M).
- Recommended offer: $1.35M (3.0% below list) — sets the bar for market timing.
- Cap rate 11.5% vs local median 3.7% in Hillsboro — top-decile yield for the area; either an underpriced asset or a hidden risk that comps aren't pricing in. Stress-test before assuming the spread holds.
Location & tenants
- Location reads 64/100 on livability (#803 in TX) — a middle-class / working-renter tenant base. Strengths: cost of living A+, housing A+, crime B+; Watch: amenities F, commute F, employment D-.
- Hillsboro ISD (town): math 46% / reading 39% proficiency, ranked #370 of 826 in TX (top 45%) — families likely to look elsewhere, expect single-tenant / working-renter base with shorter leases; 71% free/reduced lunch — lower-income household profile, screen leases tightly.
- Zoned schools: Hillsboro El (704 students, 74% FRL) — zoned schools at 74% FRL track the district average.
- Market conditions: 156 active listings in the ZIP; 65 units permitted in Hill County in 2024 (0 in 5+ unit buildings).
Forward outlook
- Local home prices are declining (-3.0%/yr); year-one equity from $10k of loan paydown is wiped out by about $42k of value loss. Plan a longer hold.
- Hill County population projected at -12% by 2050 — secular population decline; favor cash flow + early exit over multi-decade hold.
- At projected returns (-3.0% appreciation + 3.0% rent growth), your $391k cash investment doubles in ~7 years — after that, you're playing with house money.
Negotiation context
- It's been on market 33 days — a 3% lower offer ($1.35M) is reasonable based on typical stale-listing flexibility.
- 8 sale attempts since 3y ago with the ask held roughly flat each time — persistent listings suggest the price (not the market) is what's stuck; bring a comps-based counter.
Risks & watch-outs
- Climate carrying-cost: major wind risk, 27% chance of damaging wind over 30y; moderate wildfire risk; extreme-heat days projected 7→23/yr by 2055 (HVAC capex compounding) — expect insurance premiums to compound above CPI over the hold.
Questions for the listing agent
- It's been on market 33 days. Have you received any prior offers? Is the seller open to a 3% concession, seller financing, or rate buy-down credit?
- Can we see the unit-by-unit rent roll, current vacancy, and any below-market leases? What's the average tenancy length?
- What capital expenditures (roof, boiler, parking lot, exteriors) have been made in the last 5 years, and what's planned in the next 2?
- Is there a deadline driving the sale (1031 exchange, divorce, estate, relocation)? That informs how much negotiation room exists.
- Schools are F-rated, which usually means shorter tenancies and higher turnover. Who's the typical renter profile here, and what's been the actual vacancy rate?
- What's the average days-on-market for RENTAL listings here right now (not sales)? A rising rental-DOM trend means longer vacancies and softer asking-rent achievability than the comps imply.
- What's the recent tenant-quality profile in this submarket — average credit score on applications, eviction rate, late-payment / NSF rate, and stable-employment percentage? A property-management company in the area should have these aggregated.
- How much new apartment / multifamily construction is in the pipeline within 1–3 miles? Heavy new supply (>2% of stock underway) typically softens rents 12–24 months out; light construction supports rent growth.
Investment metrics
- 1% rule
- 1.37% ✓
- Cap rate
- 11.55%
- Cash-on-cash
- 18.76%
- DSCR
- 1.83
- GRM
- 6.1
CMA / ARV
No comps found within radius.
Projected returns pro-forma
-3.0% appreciation · 3.0% rent growth · sell at horizon
- IRR
- 10.5%
- Equity multiple
- 1.42×
- Total profit
- $162,803
- Equity at exit
- $207,999
- IRR
- 19.6%
- Equity multiple
- 2.64×
- Total profit
- $642,232
- Equity at exit
- $120,614
Cash invested: $390,600 (down + closing). Projections, not guarantees.
Landlord ↔ Tenant lean methodology
- Overall (STATE)
- 87 Strongly Landlord-Friendly
- State Texas
- 87 Strongly Landlord-Friendly · R+5
- County
- — inherits STATE
- City
- — inherits STATE
ZIP-level market 76645
- Home prices YoY
- -33.5%
- Active inventory
- 156
- Price-to-rent
- 121.4×
Monthly cashflow live
- Estimated rent
- $19,156 medium interval (Pro) →
- Mortgage (P&I)
- −$7,316
- Tax from tax record
- −$1,130 /mo · $13,557/yr
- Insurance
- −$581
- HOA
- −$0
- Vacancy / Maint / Mgmt
- −$4,023
- Net cashflow
- $6,107
Break-even live
20-unit breakdown (identical units grouped — click to expand)
| Units | Beds | Baths | Est. rent |
|---|---|---|---|
| 20× units | 2.0 | 1.5 | $19,160 |
| #1 | 2.0 | 1.5 | $958 |
| #2 | 2.0 | 1.5 | $958 |
| #3 | 2.0 | 1.5 | $958 |
| #4 | 2.0 | 1.5 | $958 |
| #5 | 2.0 | 1.5 | $958 |
| #6 | 2.0 | 1.5 | $958 |
| #7 | 2.0 | 1.5 | $958 |
| #8 | 2.0 | 1.5 | $958 |
| #9 | 2.0 | 1.5 | $958 |
| #10 | 2.0 | 1.5 | $958 |
| #11 | 2.0 | 1.5 | $958 |
| #12 | 2.0 | 1.5 | $958 |
| #13 | 2.0 | 1.5 | $958 |
| #14 | 2.0 | 1.5 | $958 |
| #15 | 2.0 | 1.5 | $958 |
| #16 | 2.0 | 1.5 | $958 |
| #17 | 2.0 | 1.5 | $958 |
| #18 | 2.0 | 1.5 | $958 |
| #19 | 2.0 | 1.5 | $958 |
| #20 | 2.0 | 1.5 | $958 |
| Total (20 units) | $19,156 | ||
UW: 25.0% down · 7.5% · 30yr · 1.5% tax · 5.0% vac · 8.0% maint · 8.0% mgmt
Financing live
Cash to close
- Down payment
- $348,750
- Closing costs
- $41,850
- Reserves months
- —
- Total cash needed
- —
Loan-product check · same deal, 3 products live
Conventional
25% down · 7.5% · 30yr
- Down + closing
- —
- Monthly P&I
- —
- Monthly cashflow
- —
- DSCR
- —
- Eligible?
- —
Personal DTI + credit; lowest rate.
DSCR
20% down · 8.5% · 30yr
- Down + closing
- —
- Monthly P&I
- —
- Monthly cashflow
- —
- DSCR
- —
- Eligible?
- —
No personal income docs; deal must DSCR.
Hard money
10% down · 12.0% · 12mo
- Down + closing
- —
- Monthly P&I
- —
- Monthly cashflow
- —
- DSCR
- —
- Eligible?
- —
Short-term bridge; refi at stabilization.
Listing history 36 events
-
2026-06-18days on market $1,395,000 Active 33 DOM
-
2026-06-17days on market $1,395,000 Active 32 DOM
-
2026-06-16days on market $1,395,000 Active 31 DOM
-
2026-06-15days on market $1,395,000 Active 30 DOM
-
2026-06-13days on market $1,395,000 Active 28 DOM
-
2026-06-12days on market $1,395,000 Active 27 DOM
-
2026-06-10days on market $1,395,000 Active 24 DOM
-
2026-06-08days on market $1,395,000 Active 23 DOM
-
2026-06-08days on market $1,395,000 Active 22 DOM
-
2026-06-07days on market $1,395,000 Active 21 DOM
-
2026-06-03days on market $1,395,000 Active 18 DOM
-
2026-06-02days on market $1,395,000 Active 17 DOM
-
2026-06-01days on market $1,395,000 Active 16 DOM
-
2026-05-31days on market $1,395,000 Active 15 DOM
-
2026-05-15$1,395,000 Active
-
2026-01-23historical
-
2025-10-31historical Active Option Contract
-
2025-04-16price $1,395,000
-
2025-04-15status Active
-
2025-03-21historical Active Option Contract
-
2025-01-24price $1,495,000
-
2025-01-23price $1,500,000
-
2024-09-23status Active
-
2024-08-23status Pending
-
2024-03-23historical $850
-
2024-03-20$850
-
2024-03-14historical $850
-
2024-01-29$850
-
2024-01-29historical $850
-
2024-01-26$1,600,000 Active
-
2023-12-24$850
-
2023-08-20historical $975
-
2023-08-19$975
-
2022-12-03historical
-
2021-06-18soldstatus
-
2006-10-06soldstatus
ⓘ Source: listings_history table (triggers on properties + properties_extension) + one-shot
backfill from property_details.listing_events for pre-trigger history.
Tax reassessment forecast TX · Resets to sale price
- Current annual tax
- $13,557 · $1,130/mo
- Projected year-2 tax
- $25,528 · $2,127/mo
- Expected delta
- +$11,972/yr (+$998/mo · 88.3%)
ⓘ Screening estimate from a state-policy table — verify with the county assessor before closing.
Climate risk First Street
- Flood 1/10 Low FEMA zone X (unshaded) · 0% chance over 30 yrs
- Wildfire 5/10 Major
- Heat 7/10 Severe 7 d/yr ≥108°F today · 23 d/yr by 30 yrs out
- Wind 6/10 Major 27% chance of damaging wind over 30 yrs
- Air quality 2/10 Low 1 unhealthy d/yr today · 1 by 30 yrs out
Nearby sold comps map
Loading sold comps map…
Walkable amenities ~0.75 mi
Loading nearby amenities…
Taxation est. · year 1
- Rental income
- $229,872
- − Mortgage interest
- −$78,142
- − Property taxes
- −$13,557
- − Insurance
- −$6,975
- − Repairs & maintenance
- −$18,390
- − Management
- −$18,390
- − Depreciation
- −$40,582
- Taxable income
- $53,837
- Est. tax owed @ 24.0%
- −$12,921
- After-tax cash flow
- $60,360/yr
For passive investors: Depreciation is non-cash, so a rental often shows a tax loss while cash-flowing — sheltering income. Rental losses are passive: they offset passive income freely, and up to $25,000/yr can offset ordinary (W-2) income if you actively participate and your MAGI is under $100k (phasing out to $0 by $150k); unused losses carry forward. On sale, claimed depreciation is recaptured at up to 25%, and gains may owe capital-gains tax (a 1031 exchange can defer both). Figures are a year-1 estimate at your 24.0% rate — not tax advice; consult a CPA.
Schools (NCES district)
- District
- Hillsboro ISD
- NCES district ID
- 4823280
- Math proficiency
- 46% ▲ 4.00%
- Reading proficiency
- 39% ▲ 2.00%
- Median HH income
- $34,483
- Composite
- 35.12/100
- National rank
- #5016
- State rank
- #370 of 826 in TX
Livability — Hillsboro
- Score
- 64/100
- State rank
- #803
- US rank
- #14657
Category grades
Schools grade is shown separately in the Schools card above.
Census & demographics
- Census place
- Hillsboro, TX
- City population
- 11,321
- Population (ZIP)
- 11,321
Population outlook (Hill County) Hauer SSP2
- Today (2025)
- 34,013 people
- By 2030
- 33,289 · -2.1%
- By 2040
- 31,688 · -6.8%
- By 2050
- 30,100 · -11.5%
- By 2075
- 26,818 · -21.2%
- By 2100
- 22,918 · -32.6%
Race, ethnicity, and origin ACS 2023
- Neighborhood character
- Diverse neighborhood (Simpson 0.60)
- Race & ethnicity
- White 52% Hispanic / Latino 34% Black 10% Two or more races 8% Native American 1%
- Hispanic origin (detail)
- Mexican 32%
- Common ancestry
- Slovak 1% Lithuanian 1% Serbian 1%
- Foreign-born
- 11% · Canada
- Languages at home
- 73% English-only · Spanish 26%
Political lean MEDSL · Hill
- 2024 margin
- Solid R (+64.4) · D 17.5% · R 81.8%
- 2008→2024 swing
- -23.0pp toward R · 2008: -41.4pp · 2024: -64.4pp
- All cycles
- 2024: R+64.4 2020: R+60.7 2016: R+58.4 2012: R+53.0 2008: R+41.4
Not yet ingested
- Civics
- —
Market trends
- HPI YoY
- ▼ -124.83%
- Current HPI
- 248.3182
- Rent YoY
- —
- Metro
- —
- State GDP YoY
- ▲ 3.95%
- F500 in state
- 110
Industry mix (Fortune 500 HQ in TX)
| Industry | F500 HQs | Revenue |
|---|---|---|
| Energy | 16 | $1,198B |
|
||
| Technology | 5 | $198B |
|
||
| Engineering / Construction | 4 | $72B |
|
||
| Energy Services | 3 | $60B |
|
||
| Utilities | 3 | $41B |
|
||
| Healthcare | 2 | $330B |
|
||
Price history
-12.8% since first listed22 events — show timeline
- 2026-05-15 Listed $1,395,000 NTREIS
- 2026-01-23 Listing Removed — NTREIS
- 2025-10-31 Contingent — NTREIS
- 2025-04-16 Price Changed $1,395,000 NTREIS
- 2025-04-15 Relisted — NTREIS
- 2025-03-21 Contingent — NTREIS
- 2025-01-24 Price Changed $1,495,000 NTREIS
- 2025-01-23 Price Changed $1,500,000 NTREIS
- 2024-09-23 Relisted — NTREIS
- 2024-08-23 Pending — NTREIS
- 2024-03-23 Rental Removed $850 APPFOLIO
- 2024-03-20 Listed for Rent $850 APPFOLIO
- 2024-03-14 Rental Removed $850 APPFOLIO
- 2024-01-29 Listed for Rent $850 APPFOLIO
- 2024-01-29 Rental Removed $850 APPFOLIO
- 2024-01-26 Listed $1,600,000 NTREIS
- 2023-12-24 Listed for Rent $850 APPFOLIO
- 2023-08-20 Rental Removed $975 APPFOLIO
- 2023-08-19 Listed for Rent $975 APPFOLIO
- 2022-12-03 Rental Removed — APPFOLIO
- 2021-06-18 Sold (Public Records) — Public Records
- 2006-10-06 Sold (Public Records) — Public Records
Property tax history
+5.3%/yrLatest (2025): $13,557 · +24.2% YoY. Source: county tax records.
Cash-flow waterfall
monthlySold comps — $/sqft
last 12 mo · ≤1 miLoading sold comps…