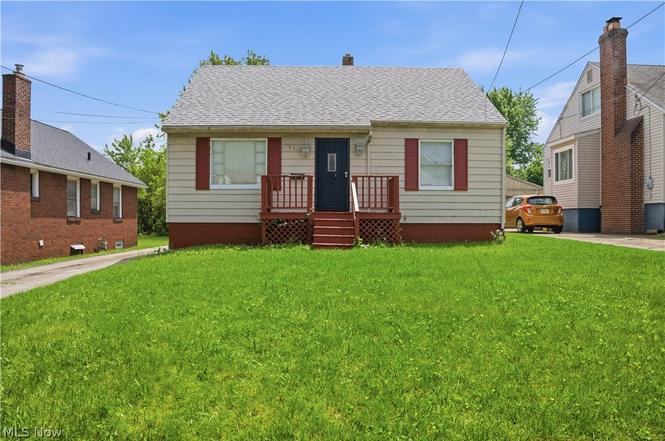
1313 Humbolt Ave · Youngstown, OH
Flood risk 1/10 · Minimal
- FEMA flood zone
- X (unshaded)
- Chance of flooding over 30 yrs
- 0.0%
- Est. flood insurance / yr
- $473 – $860
Fire risk 1/10 · Minimal
- Est. fire insurance / yr
- $713 – $1,323
Heat risk 3/10 · Minor
- Hot days now (above 97°F)
- 7 days/yr
- Hot days in 30 yrs
- 17 days/yr
Wind risk 1/10 · Minimal
- Chance of severe wind over 30 yrs
- —
Air-quality risk 3/10 · Minor
- Unhealthy air days now
- 1 days/yr
- Unhealthy air days in 30 yrs
- 4 days/yr
Risk factors via First Street. Map © Google.
Why this score? — see what drove the C+ grade
The composite is a weighted blend of 9 inputs, each scored 0–100. Each bar is that input's sub-score; the figure is the points it added to the 100-point composite (weight × sub-score).
- Cash flow +30.0/30.0
- DSCR +10.0/10.0
- 1% rule +7.4/10.0
- Appreciation +5.9/10.0
- Livability +4.0/5.0
- Rent growth +2.5/5.0
- Condition / age +2.5/5.0
- Schools +0.9/10.0
- ARV discount +0.0/15.0
$105,000
🖨 Deal sheet 📄 Offer letter ✓ Due diligence
Listing remarks
Welcome home to this beautifully updated 3-bedroom Cape Cod! Featuring an updated kitchen and bathroom, this home also boasts new flooring and fresh paint throughout, making it truly move-in ready. Major updates include a new roof (2023) and a newer furnace (2023) for peace of mind. Enjoy the additional enclosed deck, perfect to finish and transform into your own flex space — whether it’s a sunroom, office, or play area. Don’t miss the chance to own this well-maintained home with modern updates and timeless charm! Schedule a showing today before its gone!
Key facts
- Fresh paint
- Newer furnace
- New flooring
Tags
Property features AI
Finance
- Financial info: Annual tax noted (refer to listing for current amount)
Exterior
- Parking: Detached garage (1 car)
- Utilities: Public water; Public sewer
- Home design: Single-family property
- Construction: Built per public records; Asphalt/fiberglass roof
- Exterior features: Aluminum siding
Interior
- Bedrooms: Two main-level bedrooms
- Bathrooms: Two full bathrooms; One main-level bathroom
- Heating & cooling: Forced air heating
- Interior features: Full basement
Neighborhood map
What this means for you Summary
Snapshot
- This is a 3-bed/1.0-bath single-family listed at $105k.
Deal economics
- At list price, monthly cash flow is $399 ($5k/yr) — positive.
- The deal already cash-flows at list — no discount required.
- Meets the 1% rule at list price ($1k rent vs $105k).
- Recommended offer: $92k (12.0% below list) — sets the bar for market timing.
- Cap rate 10.9% vs local median 7.0% in Youngstown — top-decile yield for the area; either an underpriced asset or a hidden risk that comps aren't pricing in. Stress-test before assuming the spread holds.
Location & tenants
- Location reads 81/100 on livability (#99 in OH, #1,506 nationally) — a professional / high-income tenant draw. Strengths: amenities A+, commute A+, cost of living A+; Watch: crime F, employment F.
- Youngstown City (urban): math 8% / reading 17% proficiency, ranked #649 of 656 in OH (top 99%) — low school quality limits family demand, transient renter base, plan for 1-2y turnover; 88% free/reduced lunch — lower-income household profile, screen leases tightly.
- Market conditions: 45 active listings in the ZIP; 8 comparable units currently listed for rent nearby; rentals at typical pace (median 21d on market — plan ~3-4 weeks tenant-placement turnaround); lower-income renter base — watch delinquency; 147 units permitted in Mahoning County in 2024 (0 in 5+ unit buildings).
- At $1,301/mo this rent would consume 50% of the median local household income ($31k/yr) (locally 566% of renters already pay >50% of income on rent) — very limited rent-growth headroom before tenants either downsize or default.
Forward outlook
- In year one you build about $3k of equity ($726 loan paydown + $2k appreciation (1.8% local appreciation)).
- Mahoning County population projected at -14% by 2050 — secular population decline; favor cash flow + early exit over multi-decade hold.
- At projected returns (1.8% appreciation + 3.0% rent growth), your $29k cash investment doubles in ~4 years — after that, you're playing with house money.
Negotiation context
- It's been on market 193 days — a 12% lower offer ($92k) is reasonable based on typical stale-listing flexibility.
- 8 sale attempts since 25y ago; this cycle's ask has dropped $15k (12%) from the opening price — seller is motivated, your offer sets the floor, not the list.
Risks & watch-outs
- Watch-outs: built in 1953 — expect roof / HVAC / electrical / plumbing capex.
Questions for the listing agent
- It's been on market 193 days. Have you received any prior offers? Is the seller open to a 12% concession, seller financing, or rate buy-down credit?
- Built in 1953 — when were the roof, HVAC, electrical panel, plumbing, and water heater last replaced?
- Why hasn't it sold? Are there any deal-killer items the seller is aware of (foundation, flood, title, zoning, code violations)?
- Is there a deadline driving the sale (1031 exchange, divorce, estate, relocation)? That informs how much negotiation room exists.
- Crime grade is F in this area — have there been break-ins, vandalism, or insurance claims at this property in the last 3 years? What carrier currently insures it and at what premium?
- What's the average days-on-market for RENTAL listings here right now (not sales)? A rising rental-DOM trend means longer vacancies and softer asking-rent achievability than the comps imply.
- What's the recent tenant-quality profile in this submarket — average credit score on applications, eviction rate, late-payment / NSF rate, and stable-employment percentage? A property-management company in the area should have these aggregated.
- How much new for-sale + rental construction is in the pipeline within 1–3 miles? Heavy new supply typically softens prices + rents 12–24 months out; constrained supply supports both.
Investment metrics
- 1% rule
- 1.24% ✓
- Cap rate
- 10.86%
- Cash-on-cash
- 16.30%
- DSCR
- 1.73
- GRM
- 6.7
CMA / ARV
- ARV (on-the-fly)
- $77,952
- Comps found
- 12
Show comp detail 12 sales within ~0.75 mi
| Address | Dist | Beds/Ba | Sqft | Sold | Price | $/sf | Match |
|---|---|---|---|---|---|---|---|
| 1210 Aberdeen Ave | 0.23mi | 3/2.0 | 1,316 (-2%) | 1mo | $177,000 | $134 | 81 |
| 1208 Aberdeen Ave | 0.23mi | 3/2.0 | 1,316 (-2%) | 2mo | $175,000 | $133 | 80 |
| 1447 Humbolt Ave | 0.20mi | 3/2.0 | 1,413 (+5%) | 8mo | $62,000 | $44 | 72 |
| 805 E Boston Ave | 0.50mi | 3/1.0 | 1,335 (-1%) | 6mo | $68,000 | $51 | 71 |
| 3551 Shirley Rd | 0.52mi | 3/2.0 | 1,341 (-0%) | 2mo | $142,000 | $106 | 69 |
| 1122 Inverness Ave | 0.42mi | 3/2.0 | 1,309 (-3%) | 4mo | $126,900 | $97 | 69 |
| 708 Miller St | 0.62mi | 3/1.0 | 1,304 (-3%) | 1mo | $55,000 | $42 | 65 |
| 939 E Florida Ave | 0.24mi | 3/1.0 | 1,505 (+12%) | 6mo | $87,000 | $58 | 64 |
| 827 E Avondale Ave | 0.49mi | 3/1.0 | 1,224 (-9%) | 4mo | $64,000 | $52 | 58 |
| 968 Cameron Ave | 0.54mi | 3/1.0 | 1,464 (+9%) | 8mo | $94,200 | $64 | 53 |
| 884 E Dewey Ave | 0.49mi | 3/2.0 | 1,488 (+11%) | 5mo | $39,000 | $26 | 51 |
| 544 Miller St | 0.71mi | 3/1.5 | 1,170 (-13%) | 3mo | $47,000 | $40 | 40 |
Match score weights: distance 35% · size 25% · config 20% · recency 20%. Top-matched comps best support the ARV.
Projected returns pro-forma
1.78% appreciation · 3.0% rent growth · sell at horizon
- IRR
- 20.1%
- Equity multiple
- 2.07×
- Total profit
- $31,413
- Equity at exit
- $40,152
- IRR
- 22.3%
- Equity multiple
- 3.89×
- Total profit
- $84,820
- Equity at exit
- $56,864
Cash invested: $29,400 (down + closing). Projections, not guarantees.
Landlord ↔ Tenant lean methodology
- Overall (STATE)
- 73 Landlord-Friendly
- State Ohio
- 73 Landlord-Friendly · R+6
- County
- — inherits STATE
- City
- — inherits STATE
ZIP-level market 44502
- Home prices YoY
- 0.7%
- Active inventory
- 45
- Price-to-rent
- 6.7×
Monthly cashflow live
- Estimated rent
- $1,301 high interval (Pro) →
- Mortgage (P&I)
- −$551
- Tax from tax record
- −$34 /mo · $410/yr
- Insurance
- −$44
- HOA
- −$0
- Vacancy / Maint / Mgmt
- −$273
- Net cashflow
- $399
Break-even live
UW: 25.0% down · 7.5% · 30yr · 1.5% tax · 5.0% vac · 8.0% maint · 8.0% mgmt
Financing live
Cash to close
- Down payment
- $26,250
- Closing costs
- $3,150
- Reserves months
- —
- Total cash needed
- —
Loan-product check · same deal, 3 products live
Conventional
25% down · 7.5% · 30yr
- Down + closing
- —
- Monthly P&I
- —
- Monthly cashflow
- —
- DSCR
- —
- Eligible?
- —
Personal DTI + credit; lowest rate.
DSCR
20% down · 8.5% · 30yr
- Down + closing
- —
- Monthly P&I
- —
- Monthly cashflow
- —
- DSCR
- —
- Eligible?
- —
No personal income docs; deal must DSCR.
Hard money
10% down · 12.0% · 12mo
- Down + closing
- —
- Monthly P&I
- —
- Monthly cashflow
- —
- DSCR
- —
- Eligible?
- —
Short-term bridge; refi at stabilization.
Rent comps 8 comps
| Address | Beds | Baths | Sqft | Rent | $/sqft | DOM | Units | Dist |
|---|---|---|---|---|---|---|---|---|
| 3446 Ambert Ave Youngstown, OH | 4.0 | 1.0 | 1100 | $1,250 | $1.14 | 13d | 1 | 0.54mi |
| 1803 Pointview Ave Youngstown, OH | 2.0 | 1.0 | 950 | $1,000 | $1.05 | 43d | 1 | 0.76mi |
| 512 E Philadelphia Ave Unit 1 Youngstown, OH | 2.0 | 1.0 | 1200 | $899 | $0.75 | 20d | 1 | 0.77mi |
| 1914 S Heights Ave Youngstown, OH | 3.0 | 1.0 | 1115 | $1,950 | $1.75 | 43d | 1 | 0.85mi |
| 540 Cameron Ave Youngstown, OH | 4.0 | 2.0 | 1780 | $1,300 | $0.73 | 20d | 1 | 0.87mi |
| 236 Hilton Ave Youngstown, OH | 4.0 | 1.5 | 1488 | $1,195 | $0.80 | 20d | 1 | 1.17mi |
| 610 Elm St Struthers, OH | 3.0 | 1.0 | 1050 | $1,500 | $1.43 | 13d | 1 | 1.41mi |
| 4807 Sheridan Rd Youngstown, OH | 3.0 | 1.5 | 1586 | $1,750 | $1.10 | 13d | 1 | 1.43mi |
Listing history 32 events
-
2026-06-19days on market $105,000 Active 193 DOM
-
2026-06-18days on market $105,000 Active 192 DOM
-
2026-06-17days on market $105,000 Active 191 DOM
-
2026-06-16days on market $105,000 Active 190 DOM
-
2026-06-15days on market $105,000 Active 189 DOM
-
2026-06-14days on market $105,000 Active 187 DOM
-
2026-06-13pricedays on market $105,000 Active 186 DOM
-
2026-06-10days on market $115,000 Active 184 DOM
-
2026-06-09days on market $115,000 Active 183 DOM
-
2026-06-08days on market $115,000 Active 182 DOM
-
2026-06-07days on market $115,000 Active 181 DOM
-
2026-06-03days on market $115,000 Active 177 DOM
-
2026-06-02days on market $115,000 Active 176 DOM
-
2026-06-01days on market $115,000 Active 175 DOM
-
2026-05-31days on market $115,000 Active 174 DOM
-
2026-05-30days on market $115,000 Active 173 DOM
-
2026-05-20status Active
-
2026-02-28status Active
-
2025-09-23price $115,000
-
2025-08-29$120,000 Active
-
2016-06-01historical
-
2016-01-06$8,900 Active
-
2014-09-25historical
-
2014-03-25$9,900
-
2009-08-12historical
-
2009-05-12$29,000
-
2004-12-28soldstatus $161,900
-
2003-01-31soldstatus $16,000
-
2002-06-30historical
-
2002-06-03$18,900
-
2001-07-20$30,750
-
1993-03-22soldstatus $35,000
ⓘ Source: listings_history table (triggers on properties + properties_extension) + one-shot
backfill from property_details.listing_events for pre-trigger history.
Tax reassessment forecast OH · Partial reset (capped growth)
- Current annual tax
- $410 · $34/mo
- Projected year-2 tax
- $1,024 · $85/mo
- Expected delta
- +$614/yr (+$51/mo · 149.9%)
ⓘ Screening estimate from a state-policy table — verify with the county assessor before closing.
Climate risk First Street
- Flood 1/10 Low FEMA zone X (unshaded) · 0% chance over 30 yrs
- Wildfire 1/10 Low
- Heat 3/10 Moderate 7 d/yr ≥97°F today · 17 d/yr by 30 yrs out
- Wind 1/10 Low
- Air quality 3/10 Moderate 1 unhealthy d/yr today · 4 by 30 yrs out
Nearby sold comps map
Loading sold comps map…
Walkable amenities ~0.75 mi
Loading nearby amenities…
Taxation est. · year 1
- Rental income
- $15,615
- − Mortgage interest
- −$5,882
- − Property taxes
- −$410
- − Insurance
- −$525
- − Repairs & maintenance
- −$1,249
- − Management
- −$1,249
- − Depreciation
- −$3,055
- Taxable income
- $3,246
- Est. tax owed @ 24.0%
- −$779
- After-tax cash flow
- $4,015/yr
For passive investors: Depreciation is non-cash, so a rental often shows a tax loss while cash-flowing — sheltering income. Rental losses are passive: they offset passive income freely, and up to $25,000/yr can offset ordinary (W-2) income if you actively participate and your MAGI is under $100k (phasing out to $0 by $150k); unused losses carry forward. On sale, claimed depreciation is recaptured at up to 25%, and gains may owe capital-gains tax (a 1031 exchange can defer both). Figures are a year-1 estimate at your 24.0% rate — not tax advice; consult a CPA.
Schools (NCES district)
- District
- Youngstown City
- NCES district ID
- 3904516
- Math proficiency
- 8% ▼ -15.00%
- Reading proficiency
- 17% ▼ -10.00%
- Median HH income
- $25,257
- Composite
- 9.29/100
- National rank
- #9858
- State rank
- #649 of 656 in OH
Livability — Youngstown
- Score
- 81/100
- State rank
- #99
- US rank
- #1506
Category grades
Schools grade is shown separately in the Schools card above.
Census & demographics
- Census place
- Youngstown, OH
- County
- Mahoning County · 84,956 people
- City population
- 28,503
- Metro
- Youngstown-Warren-Boardman, OH-PA
- Population (ZIP)
- 9,594
- Household income
- $31,170
- Rent vs Own
- Severe rent burden
- 566.0
Population outlook (Mahoning County) Hauer SSP2
- Today (2025)
- 223,932 people
- By 2030
- 218,387 · -2.5%
- By 2040
- 205,367 · -8.3%
- By 2050
- 193,606 · -13.5%
- By 2075
- 173,694 · -22.4%
- By 2100
- 151,147 · -32.5%
Race, ethnicity, and origin ACS 2023
- Neighborhood character
- Diverse neighborhood (Simpson 0.67)
- Race & ethnicity
- White 44% Black 35% Two or more races 12% Hispanic / Latino 11%
- Hispanic origin (detail)
- Mexican 1% Puerto Rican 9%
- Common ancestry
- Romanian 2% Serbian 1% Iranian 1%
- Foreign-born
- 4% · Canada
- Languages at home
- 91% English-only · Spanish 6% Other Indo-European 1% Arabic 1%
Political lean MEDSL · Mahoning
- 2024 margin
- Lean R (+9.4) · D 44.9% · R 54.4%
- 2008→2024 swing
- -36.1pp toward R · 2008: 26.6pp · 2024: -9.4pp
- All cycles
- 2024: R+9.4 2020: R+1.9 2016: D+3.0 2012: D+27.7 2008: D+26.6
Not yet ingested
- Civics
- —
Market trends
- HPI YoY
- ▲ 1.78%
- Current HPI
- 246.2163
- Rent YoY
- —
- Metro
- Youngstown-Warren-Boardman, OH-PA
- State GDP YoY
- ▲ 1.98%
- F500 in state
- 48
Industry mix (Fortune 500 HQ in OH)
| Industry | F500 HQs | Revenue |
|---|---|---|
| Insurance | 3 | $145B |
|
||
| Industrial Machinery | 3 | $49B |
|
||
| Financial Services | 3 | $24B |
|
||
| Consumer Goods | 2 | $93B |
|
||
| Aerospace / Defense | 2 | $47B |
|
||
| Utilities | 2 | $33B |
|
||
Price history
+228.6% since first listed16 events — show timeline
- 2026-05-20 Relisted — MLSNOW
- 2026-02-28 Relisted — MLSNOW
- 2025-09-23 Price Changed $115,000 MLSNOW
- 2025-08-29 Listed $120,000 MLSNOW
- 2016-06-01 Listing Removed — MLSNOW
- 2016-01-06 Listed $8,900 MLSNOW
- 2014-09-25 Listing Removed — MLSNOW
- 2014-03-25 Listed $9,900 MLSNOW
- 2009-08-12 Listing Removed — MLSNOW
- 2009-05-12 Listed $29,000 MLSNOW
- 2004-12-28 Sold (Public Records) $161,900 Public Records
- 2003-01-31 Sold (MLS) $16,000 MLSNOW
- 2002-06-30 Listing Removed — MLSNOW
- 2002-06-03 Listed $18,900 MLSNOW
- 2001-07-20 Listed $30,750 MLSNOW
- 1993-03-22 Sold (Public Records) $35,000 Public Records
Property tax history
-2.9%/yrLatest (2025): $410 · -11.8% YoY. Source: county tax records.
Cash-flow waterfall
monthlySold comps — $/sqft
last 12 mo · ≤1 miLoading sold comps…