 Fourplex
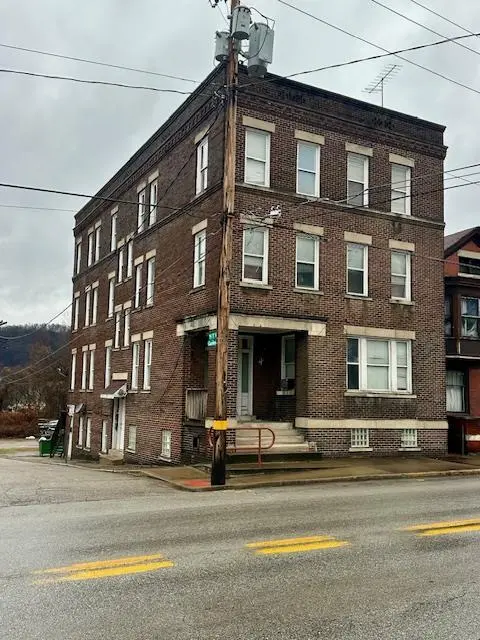
23 Garden Ct · Wheeling, WV
Flood risk 1/10 · Minimal
- FEMA flood zone
- X (unshaded)
- Chance of flooding over 30 yrs
- 0.0%
- Est. flood insurance / yr
- $473 – $860
Fire risk 1/10 · Minimal
- Est. fire insurance / yr
- $787 – $1,461
Heat risk 4/10 · Minor
- Hot days now (above 98°F)
- 7 days/yr
- Hot days in 30 yrs
- 19 days/yr
Wind risk 1/10 · Minimal
- Chance of severe wind over 30 yrs
- —
Air-quality risk 2/10 · Minimal
- Unhealthy air days now
- 1 days/yr
- Unhealthy air days in 30 yrs
- 2 days/yr
Risk factors via First Street. Map © Google.
Why this score? — see what drove the B- grade
The composite is a weighted blend of 9 inputs, each scored 0–100. Each bar is that input's sub-score; the figure is the points it added to the 100-point composite (weight × sub-score).
- Cash flow +30.0/30.0
- 1% rule +10.0/10.0
- DSCR +10.0/10.0
- ARV discount +7.5/15.0
- Schools +3.5/10.0
- Livability +3.5/5.0
- Rent growth +3.3/5.0
- Condition / age +2.2/5.0
- Appreciation +0.0/10.0
$275,000
🖨 Deal sheet 📄 Offer letter ✓ Due diligence
Multi-family units
County records classify this as Multi-Family (5+ Unit). Listing-text estimate: 4 units. estimate disagrees with records
5+ unit building — per-unit beds/baths from public records are typically unavailable; the breakdown below (if shown) is an estimate from the listing text.
Listing remarks MLS
This prime multi-unit apartment building is a fantastic investment opportunity, offering steady revenue generation in a highly desirable location. With well-maintained units and strong rental demand, it promises reliable cash flow and potential for appreciation. Don't miss out on owning a profitable property in a sought-after area.
Key facts
- 3,485 sq ft lot
- Built 1920
- Listed 191 days
Neighborhood map
What this means for you Summary
Snapshot
- This is a 4 × 3-bed/?-bath units multifamily listed at $275k. Condition is rated fair.
Deal economics
- At list price, monthly cash flow is $2k ($24k/yr) — positive. Per door: $492/mo.
- The deal already cash-flows at list — no discount required.
- Meets the 1% rule at list price ($5k rent vs $275k).
- Recommended offer: $242k (12.0% below list) — sets the bar for market timing.
- Cap rate 14.9% vs local median 4.3% in Wheeling — top-decile yield for the area; either an underpriced asset or a hidden risk that comps aren't pricing in. Stress-test before assuming the spread holds.
Location & tenants
- Location reads 69/100 on livability (#74 in WV) — a middle-class / working-renter tenant base. Strengths: cost of living A+, housing A+, health & safety A-; Watch: crime F, amenities F, commute F.
- Ohio County Schools (urban): math 34% / reading 49% proficiency, ranked #5 of 55 in WV (top 9%) — families likely to look elsewhere, expect single-tenant / working-renter base with shorter leases.
- Market conditions: Rents rising (+3.0%/yr); 223 active listings in the ZIP; 2 units permitted in Ohio County in 2024 (0 in 5+ unit buildings).
- At $4,896/mo this rent would consume 102% of the median local household income ($58k/yr) (locally 1630% of renters already pay >50% of income on rent) — very limited rent-growth headroom before tenants either downsize or default.
Forward outlook
- Local home prices are declining (-3.0%/yr); year-one equity from $2k of loan paydown is wiped out by about $8k of value loss. Plan a longer hold.
- Ohio County population projected at -17% by 2050 — secular population decline; favor cash flow + early exit over multi-decade hold.
- At projected returns (-3.0% appreciation + 3.0% rent growth), your $77k cash investment doubles in ~4 years — after that, you're playing with house money.
Negotiation context
- It's been on market 192 days — a 12% lower offer ($242k) is reasonable based on typical stale-listing flexibility.
- 5 sale attempts since 23y ago; this cycle's ask has dropped $35k (11%) from the opening price — seller is motivated, your offer sets the floor, not the list.
Risks & watch-outs
- Watch-outs: built in 1920 — expect roof / HVAC / electrical / plumbing capex.
Questions for the listing agent
- It's been on market 192 days. Have you received any prior offers? Is the seller open to a 12% concession, seller financing, or rate buy-down credit?
- Can we see the unit-by-unit rent roll, current vacancy, and any below-market leases? What's the average tenancy length?
- What capital expenditures (roof, boiler, parking lot, exteriors) have been made in the last 5 years, and what's planned in the next 2?
- Have any recent inspections been done? Can we get a copy of the seller's disclosures and any deferred-maintenance estimates?
- Built in 1920 — when were the roof, HVAC, electrical panel, plumbing, and water heater last replaced?
- Why hasn't it sold? Are there any deal-killer items the seller is aware of (foundation, flood, title, zoning, code violations)?
- Is there a deadline driving the sale (1031 exchange, divorce, estate, relocation)? That informs how much negotiation room exists.
- Schools are B-rated — typically a magnet for longer-tenancy family renters. What's the average tenant stay here, and is there a school-zone premium baked into asking?
- Crime grade is F in this area — have there been break-ins, vandalism, or insurance claims at this property in the last 3 years? What carrier currently insures it and at what premium?
- What's the average days-on-market for RENTAL listings here right now (not sales)? A rising rental-DOM trend means longer vacancies and softer asking-rent achievability than the comps imply.
- What's the recent tenant-quality profile in this submarket — average credit score on applications, eviction rate, late-payment / NSF rate, and stable-employment percentage? A property-management company in the area should have these aggregated.
- How much new apartment / multifamily construction is in the pipeline within 1–3 miles? Heavy new supply (>2% of stock underway) typically softens rents 12–24 months out; light construction supports rent growth.
Investment metrics
- 1% rule
- 1.78% ✓
- Cap rate
- 14.88%
- Cash-on-cash
- 30.66%
- DSCR
- 2.36
- GRM
- 4.7
CMA / ARV
- ARV (median comp)
- $48,987
- List price
- $275,000
- Delta
- 461.37%
- Verdict
- OVERPRICED
- Comps
- 4 within 2.0 mi
Projected returns pro-forma
-3.0% appreciation · 3.03% rent growth · sell at horizon
- IRR
- 25.4%
- Equity multiple
- 2.05×
- Total profit
- $80,963
- Equity at exit
- $41,003
- IRR
- 33.2%
- Equity multiple
- 4.02×
- Total profit
- $232,756
- Equity at exit
- $23,777
Cash invested: $77,000 (down + closing). Projections, not guarantees.
Landlord ↔ Tenant lean methodology
- Overall (STATE)
- 83 Strongly Landlord-Friendly
- State West Virginia
- 83 Strongly Landlord-Friendly · R+22
- County
- — inherits STATE
- City
- — inherits STATE
ZIP-level market 26003
- Home prices YoY
- -23.4%
- Rents YoY
- 3.0%
- Active inventory
- 223
- Price-to-rent
- 18.7×
Monthly cashflow live
- Estimated rent
- $4,896 medium interval (Pro) →
- Mortgage (P&I)
- −$1,442
- Tax est. 1.5%
- −$344 /mo · $4,125/yr
- Insurance
- −$115
- HOA
- −$0
- Vacancy / Maint / Mgmt
- −$1,028
- Net cashflow
- $1,967
Break-even live
4-unit breakdown (identical units grouped — click to expand)
| Units | Beds | Baths | Est. rent |
|---|---|---|---|
| 4× units | 3 | — | $4,896 |
| #1 | 3 | — | $1,224 |
| #2 | 3 | — | $1,224 |
| #3 | 3 | — | $1,224 |
| #4 | 3 | — | $1,224 |
| Total (4 units) | $4,896 | ||
UW: 25.0% down · 7.5% · 30yr · 1.5% tax · 5.0% vac · 8.0% maint · 8.0% mgmt
Financing live
Cash to close
- Down payment
- $68,750
- Closing costs
- $8,250
- Reserves months
- —
- Total cash needed
- —
Loan-product check · same deal, 3 products live
Conventional
25% down · 7.5% · 30yr
- Down + closing
- —
- Monthly P&I
- —
- Monthly cashflow
- —
- DSCR
- —
- Eligible?
- —
Personal DTI + credit; lowest rate.
DSCR
20% down · 8.5% · 30yr
- Down + closing
- —
- Monthly P&I
- —
- Monthly cashflow
- —
- DSCR
- —
- Eligible?
- —
No personal income docs; deal must DSCR.
Hard money
10% down · 12.0% · 12mo
- Down + closing
- —
- Monthly P&I
- —
- Monthly cashflow
- —
- DSCR
- —
- Eligible?
- —
Short-term bridge; refi at stabilization.
Listing history 35 events
-
2026-06-19days on market $275,000 Active 192 DOM
-
2026-06-18price $275,000 Active 191 DOM
-
2026-06-18days on market $294,900 Active 191 DOM
-
2026-06-17days on market $294,900 Active 190 DOM
-
2026-06-16days on market $294,900 Active 189 DOM
-
2026-06-15days on market $294,900 Active 188 DOM
-
2026-06-14days on market $294,900 Active 186 DOM
-
2026-06-12days on market $294,900 Active 185 DOM
-
2026-06-09days on market $294,900 Active 182 DOM
-
2026-06-08days on market $294,900 Active 181 DOM
-
2026-06-07days on market $294,900 Active 180 DOM
-
2026-06-05days on market $294,900 Active 177 DOM
-
2026-06-03days on market $294,900 Active 176 DOM
-
2026-06-02days on market $294,900 Active 175 DOM
-
2026-06-01days on market $294,900 Active 174 DOM
-
2026-05-31price $294,900 Active 173 DOM
-
2026-05-31days on market $299,900 Active 173 DOM
-
2026-05-30days on market $299,900 Active 172 DOM
-
2026-04-03price $299,900 333-char remark
Show marketing remark (333 chars)
This prime multi-unit apartment building is a fantastic investment opportunity, offering steady revenue generation in a highly desirable location. With well-maintained units and strong rental demand, it promises reliable cash flow and potential for appreciation. Don't miss out on owning a profitable property in a sought-after area.
-
2026-02-11price $305,000 333-char remark
Show marketing remark (333 chars)
This prime multi-unit apartment building is a fantastic investment opportunity, offering steady revenue generation in a highly desirable location. With well-maintained units and strong rental demand, it promises reliable cash flow and potential for appreciation. Don't miss out on owning a profitable property in a sought-after area.
-
2025-12-09$310,000 Active 333-char remark
Show marketing remark (333 chars)
This prime multi-unit apartment building is a fantastic investment opportunity, offering steady revenue generation in a highly desirable location. With well-maintained units and strong rental demand, it promises reliable cash flow and potential for appreciation. Don't miss out on owning a profitable property in a sought-after area.
-
2025-08-01price $297,400
-
2025-06-05price $299,900
-
2025-04-30price $305,000
-
2025-04-02price $309,000
-
2024-10-21price $309,900
-
2024-06-05price $312,500
-
2019-08-21soldstatus $295,000
-
2019-04-10$349,900
-
2014-03-21soldstatus $40,000
-
2013-12-27$45,000
-
2006-12-15soldstatus $86,500
-
2006-01-16$99,000
-
2003-06-07soldstatus $117,000
-
2003-01-03$130,000
ⓘ Source: listings_history table (triggers on properties + properties_extension) + one-shot
backfill from property_details.listing_events for pre-trigger history.
Climate risk First Street
- Flood 1/10 Low FEMA zone X (unshaded) · 0% chance over 30 yrs
- Wildfire 1/10 Low
- Heat 4/10 Moderate 7 d/yr ≥98°F today · 19 d/yr by 30 yrs out
- Wind 1/10 Low
- Air quality 2/10 Low 1 unhealthy d/yr today · 2 by 30 yrs out
Nearby sold comps map
Loading sold comps map…
Walkable amenities ~0.75 mi
Loading nearby amenities…
Taxation est. · year 1
- Rental income
- $58,752
- − Mortgage interest
- −$15,404
- − Property taxes
- −$4,125
- − Insurance
- −$1,375
- − Repairs & maintenance
- −$4,700
- − Management
- −$4,700
- − Depreciation
- −$8,000
- Taxable income
- $20,447
- Est. tax owed @ 24.0%
- −$4,907
- After-tax cash flow
- $18,701/yr
For passive investors: Depreciation is non-cash, so a rental often shows a tax loss while cash-flowing — sheltering income. Rental losses are passive: they offset passive income freely, and up to $25,000/yr can offset ordinary (W-2) income if you actively participate and your MAGI is under $100k (phasing out to $0 by $150k); unused losses carry forward. On sale, claimed depreciation is recaptured at up to 25%, and gains may owe capital-gains tax (a 1031 exchange can defer both). Figures are a year-1 estimate at your 24.0% rate — not tax advice; consult a CPA.
Condition & rehab AI · 13 photos
This multi-family apartment building is in fair condition, with significant repairs and maintenance needed to improve its overall condition and increase its value for both resale and rental.
Repairs flagged
- Major roof — The roof appears to be in need of replacement, with visible signs of wear and tear.
- Major exterior walls — The exterior walls appear to be in poor condition, with visible cracks and discoloration.
- Major fencing — The fencing appears to be in poor condition, with visible rust and damage.
Value-add opportunities
- Both roof replacement — Replacing the roof would significantly improve the overall condition of the property and increase its value for both resale and rental.
- Both exterior wall repairs — Repairing the exterior walls would improve the overall condition of the property and increase its value for both resale and rental.
- Both fencing replacement — Replacing the fencing would improve the overall condition of the property and increase its value for both resale and rental.
Renovation cost estimate screening
| Repair item | Severity | Est. cost |
|---|---|---|
| roof · The roof appears to be in need of replacement, with visible signs of wear and tear. | Major | $15,000–50,000 |
| exterior walls · The exterior walls appear to be in poor condition, with visible cracks and discoloration. | Major | $15,000–50,000 |
| fencing · The fencing appears to be in poor condition, with visible rust and damage. | Major | $15,000–50,000 |
| Total estimated repair cost · 3 items | $45,000–150,000 |
Value-add ROI direction
- Both roof replacement — Replacing the roof would significantly improve the overall condition of the property and increase its value for both resale and rental. ↑
- Both exterior wall repairs — Repairing the exterior walls would improve the overall condition of the property and increase its value for both resale and rental. ↑
- Both fencing replacement — Replacing the fencing would improve the overall condition of the property and increase its value for both resale and rental. ↑
ⓘ Cost ranges are severity-bucket heuristics (US national rule-of-thumb). Get contractor quotes + a written scope before underwriting a rehab budget.
Schools (NCES district)
- District
- Ohio County Schools
- NCES district ID
- 5401050
- Math proficiency
- 34% ▼ -9.00%
- Reading proficiency
- 49% ▼ -6.00%
- Median HH income
- $41,572
- Composite
- 34.88/100
- National rank
- #5085
- State rank
- #5 of 55 in WV
Livability — Wheeling
- Score
- 69/100
- State rank
- #74
- US rank
- #8950
Category grades
Schools grade is shown separately in the Schools card above.
Census & demographics
- Census place
- Wheeling, WV
- County
- Ohio County · 39,982 people
- City population
- 39,982
- Metro
- Wheeling, WV-OH
- Population (ZIP)
- 39,982
- Household income
- $57,703
- Rent vs Own
- Severe rent burden
- 1630.0
Population outlook (Ohio County) Hauer SSP2
- Today (2025)
- 40,604 people
- By 2030
- 39,150 · -3.6%
- By 2040
- 36,039 · -11.2%
- By 2050
- 33,582 · -17.3%
- By 2075
- 28,662 · -29.4%
- By 2100
- 22,963 · -43.4%
Race, ethnicity, and origin ACS 2023
- Neighborhood character
- Predominantly White (90%)
- Race & ethnicity
- White 90% Two or more races 6% Black 3% Hispanic / Latino 2%
- Common ancestry
- Romanian 6% Serbian 3% Slovak 2%
- Foreign-born
- 3% · Canada
- Languages at home
- 97% English-only · Other Indo-European 1% Spanish 1% German/W. Germanic 1%
Political lean MEDSL · Ohio
- 2024 margin
- Strong R (+26.0) · D 36.0% · R 62.0% · Other 2.0%
- 2008→2024 swing
- -15.3pp toward R · 2008: -10.8pp · 2024: -26.0pp
- All cycles
- 2024: R+26.0 2020: R+25.8 2016: R+31.6 2012: R+22.5 2008: R+10.8
Not yet ingested
- Civics
- —
Market trends
- HPI YoY
- ▼ -68.09%
- Current HPI
- 223.4106
- Rent YoY
- ▲ 3.03%
- Metro
- Wheeling, WV-OH
- State GDP YoY
- —
- F500 in state
- 0
Price history
+130.7% since first listed17 events — show timeline
- 2026-04-03 Price Changed $299,900 WBOR
- 2026-02-11 Price Changed $305,000 WBOR
- 2025-12-09 Listed $310,000 WBOR
- 2025-08-01 Price Changed $297,400 WBOR
- 2025-06-05 Price Changed $299,900 WBOR
- 2025-04-30 Price Changed $305,000 WBOR
- 2025-04-02 Price Changed $309,000 WBOR
- 2024-10-21 Price Changed $309,900 WBOR
- 2024-06-05 Price Changed $312,500 WBOR
- 2019-08-21 Sold (MLS) $295,000 WBOR
- 2019-04-10 Listed $349,900 WBOR
- 2014-03-21 Sold (MLS) $40,000 WBOR
- 2013-12-27 Listed $45,000 WBOR
- 2006-12-15 Sold (MLS) $86,500 WBOR
- 2006-01-16 Listed $99,000 WBOR
- 2003-06-07 Sold (MLS) $117,000 WBOR
- 2003-01-03 Listed $130,000 WBOR
Cash-flow waterfall
monthlySold comps — $/sqft
last 12 mo · ≤1 miLoading sold comps…