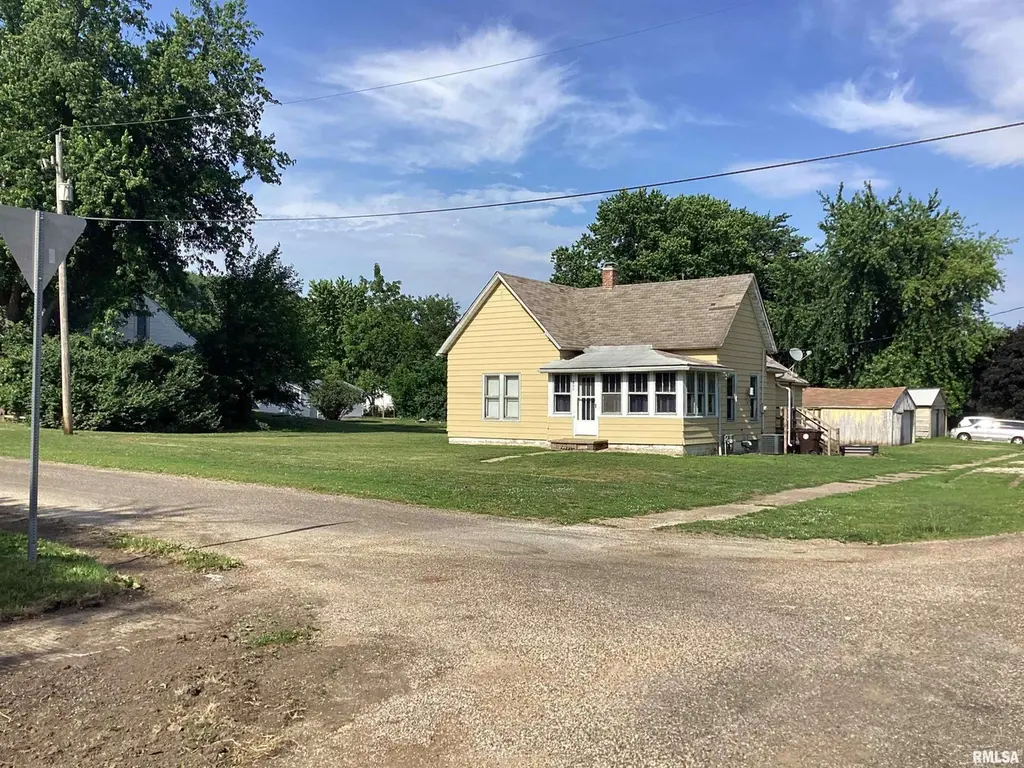
301 E 2nd St · Kingston Mines, IL
Flood risk 1/10 · Minimal
- FEMA flood zone
- X
- Chance of flooding over 30 yrs
- 0.0%
- Est. flood insurance / yr
- $473 – $860
Fire risk 1/10 · Minimal
- Est. fire insurance / yr
- $804 – $1,492
Heat risk 3/10 · Minor
- Hot days now (above 106°F)
- 7 days/yr
- Hot days in 30 yrs
- 19 days/yr
Wind risk 2/10 · Minimal
- Chance of severe wind over 30 yrs
- 1.0%
Air-quality risk 2/10 · Minimal
- Unhealthy air days now
- 1 days/yr
- Unhealthy air days in 30 yrs
- 2 days/yr
Risk factors via First Street. Map © Google.
Why this score? — see what drove the A- grade
The composite is a weighted blend of 9 inputs, each scored 0–100. Each bar is that input's sub-score; the figure is the points it added to the 100-point composite (weight × sub-score).
- Cash flow +30.0/30.0
- ARV discount +15.0/15.0
- 1% rule +10.0/10.0
- DSCR +10.0/10.0
- Appreciation +5.0/10.0
- Livability +3.0/5.0
- Rent growth +2.5/5.0
- Condition / age +2.5/5.0
- Schools +2.1/10.0
$65,000
🖨 Deal sheet 📄 Offer letter ✓ Due diligence
Listing remarks MLS
Two bedroom home on a good sized corner lot. Two stall garage with attached storage shed. This property needs work but has good sized rooms.
Key facts
- Built in cabinet
- French doors
- Main floor laundry
Tags
Property features AI
Exterior
- Parking: Detached 2-car garage
- Utilities: Public water; Septic system
- Home design: Single-family residence; One story (main living on main level with basement and additional levels noted); Enclosed front porch
- Construction: Shingle roof; Partial, unfinished basement
- Exterior features: Shed(s); Corner lot; Level lot; Paved road access
Interior
- Kitchen: Dishwasher; Refrigerator
- Bedrooms: Two bedrooms (both on the main level); Egress windows in bedrooms
- Flooring: Laminate flooring throughout main living areas and bedrooms
- Bathrooms: One full bathroom
- Heating & cooling: Forced air heating; Gas water heater; Central air conditioning; High-efficiency heating and cooling equipment
- Interior features: Dishwasher; Dryer; Refrigerator; Washer; No fireplaces
- Laundry & utility: Main-level laundry; Washer and Dryer included
Neighborhood map
What this means for you Summary
Snapshot
- This is a 3-bed/1.0-bath single-family listed at $65k.
Deal economics
- At list price, monthly cash flow is $426 ($5k/yr) — positive.
- The deal already cash-flows at list — no discount required.
- Meets the 1% rule at list price ($1k rent vs $65k).
- Recommended offer: $64k (1.5% below list) — sets the bar for market timing.
Location & tenants
- Location reads 60/100 on livability (#988 in IL) — a middle-class / working-renter tenant base. Strengths: cost of living A+, housing A+; Watch: crime D-, amenities F, commute F.
- Illini Bluffs CUSD 327 (rural): math 16% / reading 28% proficiency, ranked #343 of 620 in IL (top 55%) — low school quality limits family demand, transient renter base, plan for 1-2y turnover; only 20% free/reduced lunch — higher-income household profile.
- Zoned schools: Illini Bluffs High School (math 15% / reading 24%, grade F, #379 of 693 statewide, top 57%, 267 students, 0% FRL) — zoned schools average 0% FRL vs 20% district-wide (20 pts lower); this property's tenant base skews higher-income than the district average.
- Market conditions: 1 active listings in the ZIP; 73 units permitted in Peoria County in 2024 (0 in 5+ unit buildings).
Forward outlook
- In year one you build about $2k of equity ($449 loan paydown + $2k appreciation (3.0% local appreciation)).
- Peoria County population projected at -11% by 2050 — secular population decline; favor cash flow + early exit over multi-decade hold.
- At projected returns (3.0% appreciation + 3.0% rent growth), your $18k cash investment doubles in ~3 years — after that, you're playing with house money.
Negotiation context
- It's been on market 18 days — a 2% lower offer ($64k) is reasonable based on typical stale-listing flexibility.
- 3 sale attempts since 18y ago with the ask held roughly flat each time — persistent listings suggest the price (not the market) is what's stuck; bring a comps-based counter.
- Current owner paid $16k; list at $65k implies a 306% gain — meaningful room to come down on a strong offer.
Risks & watch-outs
- Watch-outs: built in 1900 — expect roof / HVAC / electrical / plumbing capex.
Questions for the listing agent
- Built in 1900 — when were the roof, HVAC, electrical panel, plumbing, and water heater last replaced?
- Is there a deadline driving the sale (1031 exchange, divorce, estate, relocation)? That informs how much negotiation room exists.
- Schools are F-rated, which usually means shorter tenancies and higher turnover. Who's the typical renter profile here, and what's been the actual vacancy rate?
- Crime grade is D in this area — have there been break-ins, vandalism, or insurance claims at this property in the last 3 years? What carrier currently insures it and at what premium?
- What's the average days-on-market for RENTAL listings here right now (not sales)? A rising rental-DOM trend means longer vacancies and softer asking-rent achievability than the comps imply.
- What's the recent tenant-quality profile in this submarket — average credit score on applications, eviction rate, late-payment / NSF rate, and stable-employment percentage? A property-management company in the area should have these aggregated.
- How much new for-sale + rental construction is in the pipeline within 1–3 miles? Heavy new supply typically softens prices + rents 12–24 months out; constrained supply supports both.
Investment metrics
- 1% rule
- 1.73% ✓
- Cap rate
- 14.15%
- Cash-on-cash
- 28.07%
- DSCR
- 2.25
- GRM
- 4.8
CMA / ARV
- ARV (on-the-fly)
- $105,060
- Comps found
- 1
Show comp detail 1 sale within ~0.75 mi
| Address | Dist | Beds/Ba | Sqft | Sold | Price | $/sf | Match |
|---|---|---|---|---|---|---|---|
| 302 Madison St | 0.15mi | 2/1.0 (-1) | 1,056 (+4%) | 3mo | $109,000 | $103 | 80 |
Match score weights: distance 35% · size 25% · config 20% · recency 20%. Top-matched comps best support the ARV.
Projected returns pro-forma
3.0% appreciation · 3.0% rent growth · sell at horizon
- IRR
- 34.0%
- Equity multiple
- 2.92×
- Total profit
- $34,972
- Equity at exit
- $29,227
- IRR
- 34.2%
- Equity multiple
- 5.75×
- Total profit
- $86,537
- Equity at exit
- $45,042
Cash invested: $18,200 (down + closing). Projections, not guarantees.
Landlord ↔ Tenant lean methodology
- Overall (STATE)
- 43 Moderately Tenant-Leaning
- State Illinois
- 43 Moderately Tenant-Leaning · D+7
- County
- — inherits STATE
- City
- — inherits STATE
ZIP-level market 61539-0135
- Active inventory
- 1
- Price-to-rent
- 4.8×
Monthly cashflow live
- Estimated rent
- $1,123 medium interval (Pro) →
- Mortgage (P&I)
- −$341
- Tax from tax record
- −$94 /mo · $1,123/yr
- Insurance
- −$27
- HOA
- −$0
- Vacancy / Maint / Mgmt
- −$236
- Net cashflow
- $426
Break-even live
UW: 25.0% down · 7.5% · 30yr · 1.5% tax · 5.0% vac · 8.0% maint · 8.0% mgmt
Financing live
Cash to close
- Down payment
- $16,250
- Closing costs
- $1,950
- Reserves months
- —
- Total cash needed
- —
Loan-product check · same deal, 3 products live
Conventional
25% down · 7.5% · 30yr
- Down + closing
- —
- Monthly P&I
- —
- Monthly cashflow
- —
- DSCR
- —
- Eligible?
- —
Personal DTI + credit; lowest rate.
DSCR
20% down · 8.5% · 30yr
- Down + closing
- —
- Monthly P&I
- —
- Monthly cashflow
- —
- DSCR
- —
- Eligible?
- —
No personal income docs; deal must DSCR.
Hard money
10% down · 12.0% · 12mo
- Down + closing
- —
- Monthly P&I
- —
- Monthly cashflow
- —
- DSCR
- —
- Eligible?
- —
Short-term bridge; refi at stabilization.
Listing history 14 events
-
2026-06-19days on market $65,000 Under Contract 18 DOM
-
2026-06-18days on market $65,000 Under Contract 17 DOM
-
2026-06-17days on market $65,000 Under Contract 16 DOM
-
2026-06-16days on market $65,000 Under Contract 15 DOM
-
2026-06-15status $65,000 Under Contract 14 DOM
-
2026-06-15days on market $65,000 Active 14 DOM
-
2026-06-14days on market $65,000 Active 12 DOM
-
2026-06-13days on market $65,000 Active 11 DOM
-
2026-06-10days on market $65,000 Active 9 DOM
-
2026-06-09days on market $65,000 Active 8 DOM
-
2026-06-08days on market $65,000 Active 7 DOM
-
2026-06-07days on market $65,000 Active 6 DOM
-
2026-06-02remarks 488-char remark
-
2026-06-02$65,000 Active 1 DOM
ⓘ Source: listings_history table (triggers on properties + properties_extension) + one-shot
backfill from property_details.listing_events for pre-trigger history.
Tax reassessment forecast IL · Partial reset (capped growth)
- Current annual tax
- $1,123 · $94/mo
- Projected year-2 tax
- $1,299 · $108/mo
- Expected delta
- +$176/yr (+$15/mo · 15.7%)
ⓘ Screening estimate from a state-policy table — verify with the county assessor before closing.
Climate risk First Street
- Flood 1/10 Low FEMA zone X · 0% chance over 30 yrs
- Wildfire 1/10 Low
- Heat 3/10 Moderate 7 d/yr ≥106°F today · 19 d/yr by 30 yrs out
- Wind 2/10 Low 100% chance of damaging wind over 30 yrs
- Air quality 2/10 Low 1 unhealthy d/yr today · 2 by 30 yrs out
Nearby sold comps map
Loading sold comps map…
Walkable amenities ~0.75 mi
Loading nearby amenities…
Taxation est. · year 1
- Rental income
- $13,477
- − Mortgage interest
- −$3,641
- − Property taxes
- −$1,123
- − Insurance
- −$325
- − Repairs & maintenance
- −$1,078
- − Management
- −$1,078
- − Depreciation
- −$1,891
- Taxable income
- $4,342
- Est. tax owed @ 24.0%
- −$1,042
- After-tax cash flow
- $4,067/yr
For passive investors: Depreciation is non-cash, so a rental often shows a tax loss while cash-flowing — sheltering income. Rental losses are passive: they offset passive income freely, and up to $25,000/yr can offset ordinary (W-2) income if you actively participate and your MAGI is under $100k (phasing out to $0 by $150k); unused losses carry forward. On sale, claimed depreciation is recaptured at up to 25%, and gains may owe capital-gains tax (a 1031 exchange can defer both). Figures are a year-1 estimate at your 24.0% rate — not tax advice; consult a CPA.
Schools (NCES district)
- District
- Illini Bluffs CUSD 327
- NCES district ID
- 1719960
- Math proficiency
- 16% ▼ -12.00%
- Reading proficiency
- 28% ▼ -22.00%
- Median HH income
- $68,929
- Composite
- 21.34/100
- National rank
- #8370
- State rank
- #343 of 620 in IL
Livability — Kingston Mines
- Score
- 60/100
- State rank
- #988
- US rank
- #19030
Category grades
Schools grade is shown separately in the Schools card above.
Census & demographics
- Census place
- Kingston Mines, IL
Population outlook (Peoria County) Hauer SSP2
- Today (2025)
- 183,007 people
- By 2030
- 179,643 · -1.8%
- By 2040
- 171,782 · -6.1%
- By 2050
- 163,508 · -10.7%
- By 2075
- 140,178 · -23.4%
- By 2100
- 114,493 · -37.4%
Not yet ingested
- Political lean
- —
- Race & ethnicity
- —
- Common origin
- —
- Civics
- —
Market trends
- HPI YoY
- —
- Current HPI
- —
- Rent YoY
- —
- Metro
- —
- State GDP YoY
- ▲ 1.59%
- F500 in state
- 60
Industry mix (Fortune 500 HQ in IL)
| Industry | F500 HQs | Revenue |
|---|---|---|
| Insurance | 4 | $201B |
|
||
| Consumer Goods | 4 | $87B |
|
||
| Industrial Machinery | 3 | $64B |
|
||
| Healthcare | 2 | $55B |
|
||
| Retail / Pharmacy | 1 | $148B |
|
||
| Agriculture / Food | 1 | $86B |
|
||
Price history
+35.7% since first listed6 events — show timeline
- 2026-06-01 Listed $65,000 RMLSA as Distributed by MLS Grid
- 2018-06-29 Sold (MLS) $16,000 RMLSA as Distributed by MLS Grid
- 2018-05-21 Listed $16,000 RMLSA as Distributed by MLS Grid
- 2009-02-17 Sold (Public Records) $44,000 Public Records
- 2009-02-12 Sold (MLS) $44,000 RMLSA as Distributed by MLS Grid
- 2008-07-30 Listed $47,900 RMLSA as Distributed by MLS Grid
Property tax history
+3.4%/yrLatest (2024): $1,123 · +1.8% YoY. Source: county tax records.
Cash-flow waterfall
monthlySold comps — $/sqft
last 12 mo · ≤1 miLoading sold comps…