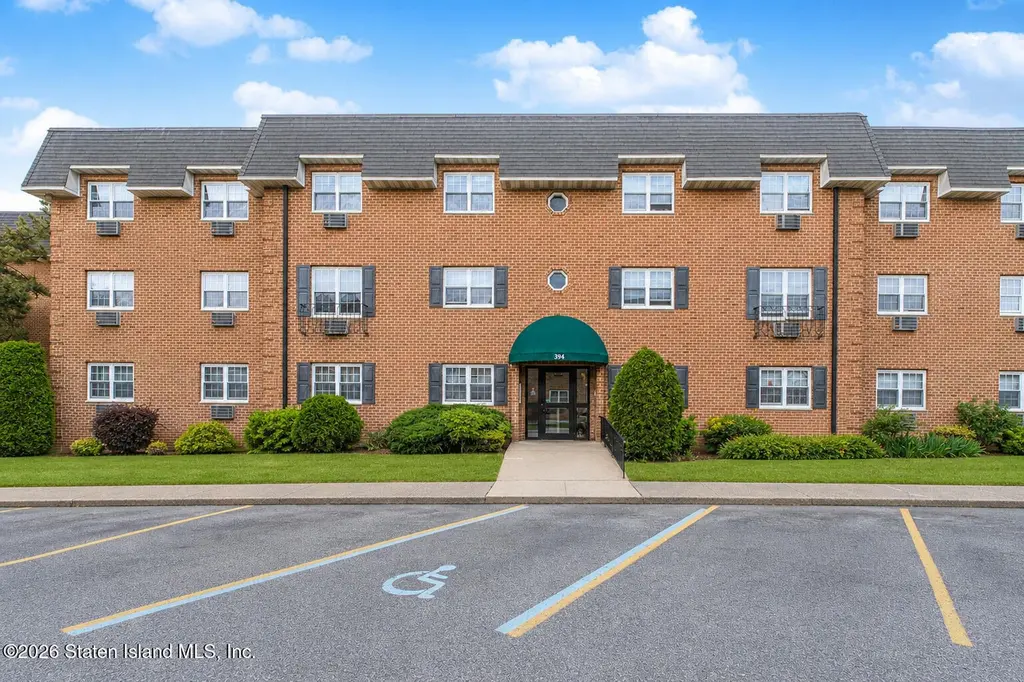
394 Maryland Ave Unit 2a · New York, NY
Flood risk 1/10 · Minimal
- FEMA flood zone
- X (unshaded)
- Chance of flooding over 30 yrs
- 0.0%
- Est. flood insurance / yr
- $507 – $1,088
Fire risk 1/10 · Minimal
- Est. fire insurance / yr
- $691 – $1,283
Heat risk 7/10 · Major
- Hot days now (above 98°F)
- 7 days/yr
- Hot days in 30 yrs
- 16 days/yr
Wind risk 6/10 · Moderate
- Chance of severe wind over 30 yrs
- 65.0%
Air-quality risk 4/10 · Minor
- Unhealthy air days now
- 5 days/yr
- Unhealthy air days in 30 yrs
- 7 days/yr
Risk factors via First Street. Map © Google.
Why this score? — see what drove the F grade
The composite is a weighted blend of 9 inputs, each scored 0–100. Each bar is that input's sub-score; the figure is the points it added to the 100-point composite (weight × sub-score).
- ARV discount +7.5/15.0
- Schools +5.0/10.0
- Rent growth +4.4/5.0
- Livability +3.8/5.0
- 1% rule +3.4/10.0
- Condition / age +2.5/5.0
- Cash flow +0.0/30.0
- DSCR +0.0/10.0
- Appreciation +0.0/10.0
$409,000
🖨 Deal sheet (PDF) 📄 Offer letter ✓ Due diligence
Listing remarks
Welcome to "Chateau Villa", a well-manicured private community that offers amenities such as a pool, dog park, children's playground, and parking. This spacious 1,300 sq. ft. apartment features a comfortable, well-designed layout with three bedrooms and two full bathrooms. The unit features a large, open-concept living and dining area, perfect for both relaxing and entertaining. Two true-to-size bedrooms, while the primary suite provides a private retreat with its own ensuite bathroom and a walk-in closet. Natural light fills the apartment throughout the day, creating a bright and inviting atmosphere in every room. Conveniently located, the property offers an easy commute to both
Key facts
- Pool
- Built 1974
- Listed 45 days
Property features AI
Finance
- Other: Zoning: R3-2; Lot approximately 0.03 acres; Parcel number available
- Financial info: Information not provided
- HOA & community: Chateau Villa association (monthly fees); Association fees include taxes, snow removal, sewer, outside maintenance, water, gas
Exterior
- Parking: On-street parking
- Security: Information not provided
- Utilities: 110V electric
- Home design: Apartment; Single-story; Excellent condition; Approximate year built
- Construction: Brick construction
- Exterior features: In-ground pool
Interior
- Kitchen: Dishwasher; Refrigerator
- Bedrooms: Information not provided
- Flooring: Information not provided
- Bathrooms: 1 full bathroom; 1 three-quarter bathroom (total 2 bathrooms)
- Heating & cooling: Natural gas heating; Forced air heating; Has cooling
- Interior features: Walk-in closet(s); Central air (units)
- Laundry & utility: Information not provided
Neighborhood map
What this means for you Summary
Snapshot
- This is a 3-bed/2.0-bath condo listed at $409k.
Deal economics
- At list price, monthly cash flow is $-2k ($-22k/yr) — negative.
- To cash-flow at today's rent, offer at most $392k (4.2% below list).
- To meet the 1% rule (rent ≥ 1% of price), the offer needs to be $343k (16.2% below list).
- Recommended offer: $343k (16.2% below list) — sets the bar for 1% rule.
- Cap rate 0.8% vs local median 2.6% in New York — below-typical yield; the buyer is paying a premium for something (appreciation thesis, condition, location) that the cap rate doesn't capture.
Location & tenants
- Location reads 75/100 on livability (#268 in NY, #4,188 nationally) — a middle-class / working-renter tenant base. Strengths: amenities A+, commute A+, health & safety A; Watch: crime F, cost of living F.
- Market conditions: Rents rising fast (+7.5%/yr); 254 active listings in the ZIP; 5 comparable units currently listed for rent nearby; rentals at typical pace (median 25d on market — plan ~3-4 weeks tenant-placement turnaround); solid renter incomes; 480 units permitted in Richmond County in 2024 (22 in 5+ unit buildings).
- At $3,428/mo this rent would consume 49% of the median local household income ($83k/yr) (locally 1647% of renters already pay >50% of income on rent) — very limited rent-growth headroom before tenants either downsize or default.
Forward outlook
- Local home prices are declining (-3.0%/yr); year-one equity from $3k of loan paydown is wiped out by about $12k of value loss. Plan a longer hold.
- Richmond County population projected to shrink 5% by 2050 — rents likely to lag national; underwrite the cash flow, not the appreciation.
Negotiation context
- It's been on market 45 days — a 3% lower offer ($397k) is reasonable based on typical stale-listing flexibility.
- 4 sale attempts since 30y ago with the ask held roughly flat each time — persistent listings suggest the price (not the market) is what's stuck; bring a comps-based counter.
- Current owner paid $50k; list at $409k implies a 718% gain — meaningful room to come down on a strong offer.
Risks & watch-outs
- Watch-outs: HOA is 51% of rent.
- Climate carrying-cost: major wind risk, 65% chance of damaging wind over 30y; extreme-heat days projected 7→16/yr by 2055 (HVAC capex compounding) — expect insurance premiums to compound above CPI over the hold.
Questions for the listing agent
- What do current leases actually rent for vs. the listed asking? Can we see a recent rent roll and the last 12 months of T-12 income?
- It's been on market 45 days. Have you received any prior offers? Is the seller open to a 16% concession, seller financing, or rate buy-down credit?
- Built in 1974 — when were the roof, HVAC, electrical panel, plumbing, and water heater last replaced?
- What does the HOA fee cover, when was the last increase, and are there any pending special assessments or reserve-fund shortfalls?
- Any open or pending special assessments — roof, HVAC, plumbing, elevator, façade? What's the per-unit balance and payoff schedule, and is the seller paying it off at close or rolling it to the buyer?
- Is there a deadline driving the sale (1031 exchange, divorce, estate, relocation)? That informs how much negotiation room exists.
- Schools are B-rated — typically a magnet for longer-tenancy family renters. What's the average tenant stay here, and is there a school-zone premium baked into asking?
- Crime grade is F in this area — have there been break-ins, vandalism, or insurance claims at this property in the last 3 years? What carrier currently insures it and at what premium?
- The area grade is low — what's the realistic commute time and amenity access for the typical tenant pool here? Any planned neighborhood developments (good or bad) we should know about?
- What's the average days-on-market for RENTAL listings here right now (not sales)? A rising rental-DOM trend means longer vacancies and softer asking-rent achievability than the comps imply.
- What's the recent tenant-quality profile in this submarket — average credit score on applications, eviction rate, late-payment / NSF rate, and stable-employment percentage? A property-management company in the area should have these aggregated.
- How much new apartment / multifamily construction is in the pipeline within 1–3 miles? Heavy new supply (>2% of stock underway) typically softens rents 12–24 months out; light construction supports rent growth.
Investment metrics
- 1% rule
- 0.84% ✗
- Cap rate
- 0.81%
- Cash-on-cash
- -19.59%
- DSCR
- 0.13
- GRM
- 9.9
CMA / ARV
No comps found within radius.
Projected returns pro-forma
-3.0% appreciation · 7.5% rent growth · sell at horizon
- IRR
- -45.7%
- Equity multiple
- -0.47×
- Total profit
- $-168,002
- Equity at exit
- $60,983
- IRR
- -34.0%
- Equity multiple
- -0.94×
- Total profit
- $-221,980
- Equity at exit
- $35,363
Cash invested: $114,520 (down + closing). Projections, not guarantees.
Landlord ↔ Tenant lean methodology
- Overall (CITY)
- 0 Strongly Tenant-Friendly
- State New York
- 15 Strongly Tenant-Friendly · D+10
- County
- — inherits STATE
- City New York
- 0 Strongly Tenant-Friendly · D+34
ZIP-level market 10305
- Rents YoY
- 7.5%
- Active inventory
- 254
- Price-to-rent
- 9.9×
Monthly cashflow live
- Estimated rent
- $3,428 high interval (Pro) →
- Mortgage (P&I)
- −$2,145
- Tax est. 1.5%
- −$511 /mo · $6,135/yr
- Insurance
- −$170
- HOA est. from 5 same-building comps
- −$1,751
- Vacancy / Maint / Mgmt
- −$720
- Net cashflow
- $-1,870
Break-even live
Sensitivity live
| Price | -10% $-1,587 | -5% $-1,728 | +0% $-1,870 | +5% $-2,011 | +10% $-2,152 |
|---|---|---|---|---|---|
| Rent | -10% $-2,140 | -5% $-2,005 | +0% $-1,870 | +5% $-1,734 | +10% $-1,599 |
| Rate | -1.0pp $-1,664 | -0.5pp $-1,766 | base $-1,870 | +0.5pp $-1,976 | +1.0pp $-2,083 |
UW: 25.0% down · 7.5% · 30yr · 1.5% tax · 5.0% vac · 8.0% maint · 8.0% mgmt
Financing live
Cash to close
- Down payment
- $102,250
- Closing costs
- $12,270
- Reserves months
- —
- Total cash needed
- —
Loan-product check · same deal, 3 products live
Conventional
25% down · 7.5% · 30yr
- Down + closing
- —
- Monthly P&I
- —
- Monthly cashflow
- —
- DSCR
- —
- Eligible?
- —
Personal DTI + credit; lowest rate.
DSCR
20% down · 8.5% · 30yr
- Down + closing
- —
- Monthly P&I
- —
- Monthly cashflow
- —
- DSCR
- —
- Eligible?
- —
No personal income docs; deal must DSCR.
Hard money
10% down · 12.0% · 12mo
- Down + closing
- —
- Monthly P&I
- —
- Monthly cashflow
- —
- DSCR
- —
- Eligible?
- —
Short-term bridge; refi at stabilization.
Rent comps 5 comps
| Address | Beds | Baths | Sqft | Rent | $/sqft | DOM | Units | Dist |
|---|---|---|---|---|---|---|---|---|
| 305 Osgood Ave Unit 2 Staten Island, NY | 3.0 | 2.0 | 1300 | $3,200 | $2.46 | 25d | 1 | 0.41mi |
| 97 Greenfield Ave Staten Island, NY | 3.0 | 2.5 | 1254 | $3,400 | $2.71 | 25d | 1 | 0.67mi |
| 17 Cunard Ave Staten Island, NY | 3.0 | 2.0 | 1700 | $3,650 | $2.15 | 25d | 1 | 0.81mi |
| 21 Susan Ct Staten Island, NY | 3.0 | 2.5 | 900 | $3,400 | $3.78 | 25d | 1 | 0.90mi |
| 703 Bay St Staten Island, NY | 2.0 | 2.5 | 1337 | $3,500 | $2.62 | 25d | 1 | 1.10mi |
HOA detail condo
- Monthly dues
- $0 · $0/yr
- Likely covers
- pool
- Assessments
- None detected in remarks — confirm with the listing agent.
Listing history 24 events
-
2026-06-18days on market $409,000 Active 45 DOM
-
2026-06-17days on market $409,000 Active 44 DOM
-
2026-06-16days on market $409,000 Active 43 DOM
-
2026-06-15price $409,000 Active 42 DOM
-
2026-06-15days on market $419,000 Active 42 DOM
-
2026-06-13days on market $419,000 Active 40 DOM
-
2026-06-10days on market $419,000 Active 36 DOM
-
2026-06-08days on market $419,000 Active 35 DOM
-
2026-06-08days on market $419,000 Active 34 DOM
-
2026-06-04days on market $419,000 Active 31 DOM
-
2026-06-03days on market $419,000 Active 30 DOM
-
2026-06-01days on market $419,000 Active 28 DOM
-
2026-05-31days on market $419,000 Active 27 DOM
-
2026-05-04$419,000 Active
-
2026-03-17historical
-
2025-12-07price $419,000
-
2025-12-05price $419,000
-
2025-11-17$449,000 Active
-
2025-11-16historical
-
2025-11-09historical
-
2025-06-09price $439,000
-
2025-05-09$459,000 Active
-
1997-04-24soldstatus $50,000
-
1996-04-18$57,900
ⓘ Source: listings_history table (triggers on properties + properties_extension) + one-shot
backfill from property_details.listing_events for pre-trigger history.
Climate risk First Street
- Flood 1/10 Low FEMA zone X (unshaded) · 0% chance over 30 yrs
- Wildfire 1/10 Low
- Heat 7/10 Severe 7 d/yr ≥98°F today · 16 d/yr by 30 yrs out
- Wind 6/10 Major 65% chance of damaging wind over 30 yrs
- Air quality 4/10 Moderate 5 unhealthy d/yr today · 7 by 30 yrs out
Nearby sold comps map
Loading sold comps map…
Walkable amenities ~0.75 mi
Loading nearby amenities…
Taxation est. · year 1
- Rental income
- $41,132
- − Mortgage interest
- −$22,910
- − Property taxes
- −$6,135
- − Insurance
- −$2,045
- − Repairs & maintenance
- −$3,291
- − Management
- −$3,291
- − HOA
- −$21,012
- − Depreciation
- −$11,898
- Taxable loss
- −$29,449
- Est. tax savings @ 24.0%
- +$7,068
- After-tax cash flow
- $-15,368/yr
For passive investors: Depreciation is non-cash, so a rental often shows a tax loss while cash-flowing — sheltering income. Rental losses are passive: they offset passive income freely, and up to $25,000/yr can offset ordinary (W-2) income if you actively participate and your MAGI is under $100k (phasing out to $0 by $150k); unused losses carry forward. On sale, claimed depreciation is recaptured at up to 25%, and gains may owe capital-gains tax (a 1031 exchange can defer both). Figures are a year-1 estimate at your 24.0% rate — not tax advice; consult a CPA.
Schools (NCES district)
No district data.
Livability — New York
- Score
- 75/100
- State rank
- #268
- US rank
- #4188
Category grades
Schools grade is shown separately in the Schools card above.
Census & demographics
- Census place
- New York, NY
- County
- Richmond County · 404,174 people
- City population
- 7,731,280
- Metro
- New York-Newark-Jersey City, NY-NJ-PA
- Population (ZIP)
- 41,270
- Household income
- $83,413
- Rent vs Own
- Severe rent burden
- 1647.0
Population outlook (Richmond County) Hauer SSP2
- Today (2025)
- 482,784 people
- By 2030
- 481,831 · -0.2%
- By 2040
- 473,159 · -2.0%
- By 2050
- 457,242 · -5.3%
- By 2075
- 408,029 · -15.5%
- By 2100
- 341,459 · -29.3%
Race, ethnicity, and origin ACS 2023
- Neighborhood character
- Diverse neighborhood (Simpson 0.60)
- Race & ethnicity
- White 58% Asian 21% Hispanic / Latino 15% Two or more races 7% Black 3%
- Hispanic origin (detail)
- Mexican 4% Puerto Rican 8%
- Common ancestry
- Scotch-Irish 5% Romanian 4% Subsaharan African 2%
- Foreign-born
- 36% · China, Canada, Jamaica
- Languages at home
- 52% English-only · Chinese 13% Russian/Polish/Slavic 12% Other Indo-European 8%
Political lean MEDSL · Richmond
- 2024 margin
- Strong R (+29.8) · D 35.1% · R 64.9%
- 2008→2024 swing
- -25.7pp toward R · 2008: -4.0pp · 2024: -29.8pp
- All cycles
- 2024: R+29.8 2020: R+14.9 2016: R+16.8 2012: D+0.8 2008: R+4.0
Not yet ingested
- Civics
- —
Market trends
- HPI YoY
- ▼ -487.06%
- Current HPI
- 342.7938
- Rent YoY
- ▲ 7.50%
- Metro
- New York-Newark-Jersey City, NY-NJ-PA
- State GDP YoY
- ▲ 2.60%
- F500 in state
- 92
Industry mix (Fortune 500 HQ in NY)
| Industry | F500 HQs | Revenue |
|---|---|---|
| Financial Services | 10 | $950B |
|
||
| Consumer Goods | 9 | $162B |
|
||
| Insurance | 4 | $225B |
|
||
| Telecommunications | 2 | $144B |
|
||
| Pharmaceuticals | 2 | $112B |
|
||
| Media / Entertainment | 2 | $69B |
|
||
Price history
+623.7% since first listed11 events — show timeline
- 2026-05-04 Listed $419,000 SIBORMLS
- 2026-03-17 Listing Removed — SIBORMLS
- 2025-12-07 Price Changed $419,000 BNYMLS
- 2025-12-05 Price Changed $419,000 SIBORMLS
- 2025-11-17 Listed $449,000 SIBORMLS
- 2025-11-16 Coming Soon — SIBORMLS
- 2025-11-09 Listing Removed — SIBORMLS
- 2025-06-09 Price Changed $439,000 SIBORMLS
- 2025-05-09 Listed $459,000 SIBORMLS
- 1997-04-24 Sold (MLS) $50,000 SIBORMLS
- 1996-04-18 Listed $57,900 SIBORMLS
Cash-flow waterfall
monthlySold comps — $/sqft
last 12 mo · ≤1 miLoading sold comps…