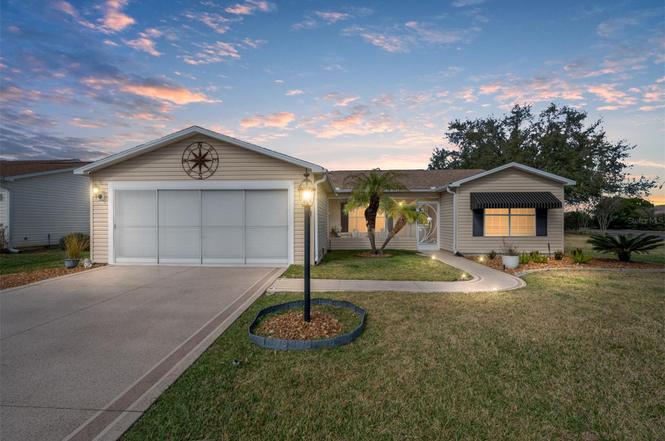
2001 Cipriano Pl · The Villages, FL
Flood risk 1/10 · Minimal
- FEMA flood zone
- X (unshaded)
- Chance of flooding over 30 yrs
- 0.0%
- Est. flood insurance / yr
- $507 – $1,088
Fire risk 4/10 · Minor
- Est. fire insurance / yr
- $947 – $1,759
Heat risk 9/10 · Severe
- Hot days now (above 109°F)
- 7 days/yr
- Hot days in 30 yrs
- 21 days/yr
Wind risk 9/10 · Severe
- Chance of severe wind over 30 yrs
- 99.0%
Air-quality risk 3/10 · Minor
- Unhealthy air days now
- 2 days/yr
- Unhealthy air days in 30 yrs
- 3 days/yr
Risk factors via First Street. Map © Google.
Why this score? — see what drove the D grade
The composite is a weighted blend of 9 inputs, each scored 0–100. Each bar is that input's sub-score; the figure is the points it added to the 100-point composite (weight × sub-score).
- Cash flow +11.6/30.0
- ARV discount +9.2/15.0
- Schools +5.2/10.0
- Rent growth +3.5/5.0
- Livability +3.5/5.0
- DSCR +3.4/10.0
- 1% rule +3.3/10.0
- Condition / age +2.5/5.0
- Appreciation +0.0/10.0
$344,900
🖨 Deal sheet (PDF) 📄 Offer letter ✓ Due diligence
Listing remarks
BOND PAID! • UPGRADES COMPLETED! • MOVE IN READY! • ROOM FOR A POOL! • LOWER TAXES (Sumter County)! Discover the renowned VILLAGES LIFESTYLE in this AMARILLO Ranch home w/ 3 BR/ 2 BA/ 2 Car Garage & 1,527 SF, nestled on an OVERSIZED CORNER LOT in the VILLAGE of SANTO DOMINGO. LOCATION is all about convenience - only 8-10 mins to the US Hwy 441/27 COMMERCIAL CORRIDOR for shopping, dining, entertainment, healthcare, gas, banking, and more! Just a short golf cart ride away is Glenview Country Club & Championship Golf Course, Hacienda Hills Championship Golf Course, and Savannah, El Santiago & La Hacienda Recreation Centers. Enjoy nearby SPANISH SPRINGS &a
Key facts
- Oversized corner lot
- Screened front porch
- Room for a pool
Tags
Property features AI
Finance
- Other: Total building area noted; living area listed from public records; Number of rooms: 9; One lot; Lot dimensions approximately 90 x 91 (0.18 acres)
- Financial info: CDD present; Homestead exemption present; Lease restrictions apply
- HOA & community: Community features include deed restrictions, fitness center, pool, tennis courts, park, golf, golf carts allowed, irrigation with reclaimed water, street lights, and no truck/RV/motorcycle parking; Association amenities include pool, grounds maintenance and recreational facilities; Association rules include fence restrictions, gated entry and vehicle restrictions; Senior community; Pets allowed (dogs OK, number limit applies)
Exterior
- Parking: Attached 2-car garage (19 x 21); Driveway with garage door opener
- Security: Smoke detectors
- Utilities: Public water; Public sewer; Electricity connected; Water connected; Sewer connected; Cable available; Broadband/high-speed internet available; Underground utilities
- Home design: Single family residence; One story; South facing; Entry level: One
- Construction: Vinyl siding with frame construction; Shingle roof; Slab foundation; Builder model: Amarillo; Built as single-family residential
- Exterior features: Covered, enclosed and rear porches; Front porch; Patio; Awnings; Exterior lighting; Rain gutters; Mature landscaping with trees; Level, cleared and landscaped lot; Corner lot within city limits; Oversized paved lot; Public maintained asphalt roads; Irrigation equipment
Interior
- Kitchen: Dishwasher; Microwave; Range; Refrigerator; Stone countertops; Eat-in kitchen
- Bedrooms: 3 bedrooms
- Flooring: Tile flooring
- Bathrooms: 2 full bathrooms
- Heating & cooling: Central heating (electric); Central air conditioning
- Interior features: Cathedral ceilings; Ceiling fans; Eat-in kitchen; Living room/dining room combo; Open floorplan; Solid wood cabinets; Split bedroom layout; Stone counters; Thermostat; Walk-in closets; Blinds, drapes, rods and shades on windows; Attic; Florida room; Inside utility
- Laundry & utility: Laundry room inside; Washer; Dryer; Electric water heater
Neighborhood map
What this means for you Summary
Snapshot
- This is a 3-bed/2.0-bath single-family listed at $345k.
Deal economics
- At list price, monthly cash flow is $-106 ($-1k/yr) — negative.
- To cash-flow at today's rent, offer at most $326k (5.4% below list).
- To meet the 1% rule (rent ≥ 1% of price), the offer needs to be $288k (16.6% below list).
- Recommended offer: $288k (16.6% below list) — sets the bar for 1% rule.
Location & tenants
- Location reads 70/100 on livability (#431 in FL) — a middle-class / working-renter tenant base. Strengths: crime A+, housing A, employment B+; Watch: amenities F, commute F, health & safety F.
- Sumter (rural): math 61% / reading 61% proficiency, ranked #11 of 73 in FL (top 15%) — acceptable for families but not a draw, mixed tenant base, ~2y average lease.
- Zoned schools: Wildwood Elementary School (math 49% / reading 52%, grade D+, #1,055 of 2,144 statewide, top 50%, 940 students, 76% FRL); South Sumter Middle School (math 55% / reading 54%, grade B-, #183 of 571 statewide, top 34%, 897 students, 61% FRL) — zoned schools average 68% FRL vs 51% district-wide (18 pts higher); higher-poverty schools than district average — tighter screening recommended.
- Market conditions: Rents rising fast (+4.0%/yr); 586 active listings in the ZIP; 24 comparable units currently listed for rent nearby; rentals at typical pace (median 23d on market — plan ~3-4 weeks tenant-placement turnaround); 3,961 units permitted in Sumter County in 2024 (248 in 5+ unit buildings).
- At $2,877/mo this rent would consume 59% of the median local household income ($59k/yr) (locally 1047% of renters already pay >50% of income on rent) — very limited rent-growth headroom before tenants either downsize or default.
Forward outlook
- Local home prices are declining (-3.0%/yr); year-one equity from $2k of loan paydown is wiped out by about $10k of value loss. Plan a longer hold.
- Sumter County population projected at +45% by 2050 — long-run rental-demand tailwind backs the buy-and-hold thesis.
Negotiation context
- It's been on market 98 days — a 9% lower offer ($314k) is reasonable based on typical stale-listing flexibility.
- 2 sale attempts with the ask held roughly flat each time — persistent listings suggest the price (not the market) is what's stuck; bring a comps-based counter.
Risks & watch-outs
- Climate carrying-cost: severe wind risk, 99% chance of damaging wind over 30y; extreme-heat days projected 7→21/yr by 2055 (HVAC capex compounding) — expect insurance premiums to compound above CPI over the hold.
Questions for the listing agent
- What do current leases actually rent for vs. the listed asking? Can we see a recent rent roll and the last 12 months of T-12 income?
- It's been on market 98 days. Have you received any prior offers? Is the seller open to a 17% concession, seller financing, or rate buy-down credit?
- What does the HOA fee cover, when was the last increase, and are there any pending special assessments or reserve-fund shortfalls?
- Why hasn't it sold? Are there any deal-killer items the seller is aware of (foundation, flood, title, zoning, code violations)?
- Is there a deadline driving the sale (1031 exchange, divorce, estate, relocation)? That informs how much negotiation room exists.
- Schools are A-rated — typically a magnet for longer-tenancy family renters. What's the average tenant stay here, and is there a school-zone premium baked into asking?
- The area grade is low — what's the realistic commute time and amenity access for the typical tenant pool here? Any planned neighborhood developments (good or bad) we should know about?
- What's the average days-on-market for RENTAL listings here right now (not sales)? A rising rental-DOM trend means longer vacancies and softer asking-rent achievability than the comps imply.
- What's the recent tenant-quality profile in this submarket — average credit score on applications, eviction rate, late-payment / NSF rate, and stable-employment percentage? A property-management company in the area should have these aggregated.
- How much new for-sale + rental construction is in the pipeline within 1–3 miles? Heavy new supply typically softens prices + rents 12–24 months out; constrained supply supports both.
Investment metrics
- 1% rule
- 0.83% ✗
- Cap rate
- 5.93%
- Cash-on-cash
- -1.31%
- DSCR
- 0.94
- GRM
- 10.0
CMA / ARV
- ARV (on-the-fly)
- $358,845
- Comps found
- 12
Show comp detail 12 sales within ~0.75 mi
| Address | Dist | Beds/Ba | Sqft | Sold | Price | $/sf | Match |
|---|---|---|---|---|---|---|---|
| 2016 Claudio Ln | 0.11mi | 3/2.0 | 1,527 (0%) | 3mo | $310,000 | $203 | 92 |
| 1134 Salido Ave | 0.40mi | 3/2.0 | 1,542 (+1%) | 1mo | $360,000 | $233 | 79 |
| 2005 Claudio Ln | 0.05mi | 2/2.0 (-1) | 1,389 (-9%) | 0mo | $317,000 | $228 | 77 |
| 1504 Avila Pl | 0.30mi | 3/2.0 | 1,452 (-5%) | 1mo | $355,000 | $244 | 77 |
| 2027 Cipriano Pl | 0.16mi | 3/2.0 | 1,392 (-9%) | 3mo | $306,000 | $220 | 75 |
| 1506 LA Frontera Ct | 0.55mi | 3/2.0 | 1,527 (0%) | 2mo | $330,000 | $216 | 73 |
| 1148 Chaparral Dr | 0.31mi | 3/2.0 | 1,392 (-9%) | 0mo | $465,000 | $334 | 71 |
| 1505 Alcaraz Pl | 0.35mi | 3/2.0 | 1,634 (+7%) | 2mo | $384,000 | $235 | 70 |
| 1110 Salido Ave | 0.52mi | 3/2.0 | 1,483 (-3%) | 3mo | $435,000 | $293 | 68 |
| 2412 Merida Cir | 0.67mi | 3/2.0 | 1,527 (0%) | 2mo | $282,500 | $185 | 67 |
| 2125 Zaragoza Pl | 0.68mi | 3/2.0 | 1,494 (-2%) | 1mo | $370,000 | $248 | 64 |
| 1312 Landeros Ln | 0.57mi | 3/2.0 | 1,392 (-9%) | 3mo | $331,000 | $238 | 56 |
Match score weights: distance 35% · size 25% · config 20% · recency 20%. Top-matched comps best support the ARV.
Projected returns pro-forma
-3.0% appreciation · 4.03% rent growth · sell at horizon
- IRR
- -17.3%
- Equity multiple
- 0.38×
- Total profit
- $-59,566
- Equity at exit
- $51,426
- IRR
- -7.5%
- Equity multiple
- 0.51×
- Total profit
- $-47,750
- Equity at exit
- $29,821
Cash invested: $96,572 (down + closing). Projections, not guarantees.
Landlord ↔ Tenant lean methodology
- Overall (STATE)
- 87 Strongly Landlord-Friendly
- State Florida
- 87 Strongly Landlord-Friendly · R+3
- County
- — inherits STATE
- City
- — inherits STATE
ZIP-level market 32159
- Home prices YoY
- -16.0%
- Rents YoY
- 4.0%
- Active inventory
- 586
- Price-to-rent
- 10.0×
Monthly cashflow live
- Estimated rent
- $2,877 high interval (Pro) →
- Mortgage (P&I)
- −$1,809
- Tax from tax record
- −$222 /mo · $2,662/yr
- Insurance
- −$144
- HOA
- −$204
- Vacancy / Maint / Mgmt
- −$604
- Net cashflow
- $-106
Break-even live
Sensitivity live
| Price | -10% $90 | -5% $-8 | +0% $-106 | +5% $-203 | +10% $-301 |
|---|---|---|---|---|---|
| Rent | -10% $-333 | -5% $-219 | +0% $-106 | +5% $8 | +10% $122 |
| Rate | -1.0pp $68 | -0.5pp $-18 | base $-106 | +0.5pp $-195 | +1.0pp $-286 |
UW: 25.0% down · 7.5% · 30yr · 1.5% tax · 5.0% vac · 8.0% maint · 8.0% mgmt
Financing live
Cash to close
- Down payment
- $86,225
- Closing costs
- $10,347
- Reserves months
- —
- Total cash needed
- —
Loan-product check · same deal, 3 products live
Conventional
25% down · 7.5% · 30yr
- Down + closing
- —
- Monthly P&I
- —
- Monthly cashflow
- —
- DSCR
- —
- Eligible?
- —
Personal DTI + credit; lowest rate.
DSCR
20% down · 8.5% · 30yr
- Down + closing
- —
- Monthly P&I
- —
- Monthly cashflow
- —
- DSCR
- —
- Eligible?
- —
No personal income docs; deal must DSCR.
Hard money
10% down · 12.0% · 12mo
- Down + closing
- —
- Monthly P&I
- —
- Monthly cashflow
- —
- DSCR
- —
- Eligible?
- —
Short-term bridge; refi at stabilization.
Rent comps 24 comps
| Address | Beds | Baths | Sqft | Rent | $/sqft | DOM | Units | Dist |
|---|---|---|---|---|---|---|---|---|
| 2006 Cardona Way Lady Lake, FL | 2.0 | 2.0 | 1428 | $3,900 | $2.73 | 23d | 1 | 0.20mi |
| 1505 Doria Ln Lady Lake, FL | 3.0 | 2.0 | 2048 | $3,500 | $1.71 | 23d | 1 | 0.30mi |
| 1377 Camero Dr Lady Lake, FL | 3.0 | 2.0 | 1462 | $5,500 | $3.76 | 23d | 1 | 0.51mi |
| 2126 Sansores St Lady Lake, FL | 3.0 | 2.0 | 1748 | $3,700 | $2.12 | 23d | 1 | 0.60mi |
| 2137 Gerardo Ave Lady Lake, FL | 3.0 | 2.0 | 1940 | $5,600 | $2.89 | 23d | 1 | 0.74mi |
| 13904 County Road 109D Lady Lake, FL | 3.0 | 2.0 | 1568 | $1,550 | $0.99 | 23d | 1 | 0.90mi |
| 13957 County Road 109D Lady Lake, FL | 2.0 | 2.0 | 1482 | $1,650 | $1.11 | 23d | 1 | 0.95mi |
| 2002 Salinas Ave Lady Lake, FL | 3.0 | 2.0 | 1642 | $5,500 | $3.35 | 23d | 1 | 0.96mi |
| 1314 Corona Ave Lady Lake, FL | 2.0 | 2.0 | 1656 | $2,500 | $1.51 | 23d | 1 | 1.19mi |
| 1524 Martinez Dr Lady Lake, FL | 2.0 | 2.0 | 1199 | $2,095 | $1.75 | 23d | 1 | 1.21mi |
| 10397 SE 176th St Summerfield, FL | 2.0 | 2.0 | 1296 | $2,150 | $1.66 | 23d | 1 | 1.22mi |
| 722 Camino del Rey Dr Lady Lake, FL | 3.0 | 2.0 | 1205 | $2,000 | $1.66 | 23d | 1 | 1.26mi |
| 1522 Yucatan Way Unit 1525265P Lady Lake, FL | 2.0 | 2.0 | 1732 | $1,829 | $1.06 | 23d | 1 | 1.29mi |
| 13740 Lead LN The Villages, FL | 1.0–3.0 | 1.0–2.0 | 1029 | $2,150 | $2.09 | 23d | 38 | 1.35mi |
| 2829 Burgos Dr The Villages, FL | 2.0 | 2.0 | 1156 | $1,850 | $1.60 | 23d | 1 | 1.37mi |
| 1401 W Schwartz Blvd Lady Lake, FL | 2.0 | 2.0 | 1552 | $1,999 | $1.29 | 25d | 1 | 1.41mi |
| 13765 NE 136th Loop Lady Lake, FL | 1.0–3.0 | 1.0–2.0 | 1078 | $1,991 | $1.85 | 23d | 36 | 1.42mi |
| 17817 SE 115th Ct Unit 1 Summerfield, FL | 3.0 | 2.0 | 2144 | $2,300 | $1.07 | 23d | 1 | 1.42mi |
| 17532 SE 100th Ct Summerfield, FL | 2.0 | 2.0 | 1217 | $1,800 | $1.48 | 23d | 1 | 1.43mi |
| 1129 Santa Cruz Dr The Villages, FL | 2.0 | 2.0 | 1102 | $2,350 | $2.13 | 23d | 1 | 1.46mi |
| 1304 Santa Rosa Ct Lady Lake, FL | 2.0 | 2.0 | 1286 | $4,500 | $3.50 | 23d | 1 | 1.47mi |
| 2909 Meadow Lawn Ln The Villages, FL | 2.0 | 2.0 | 1132 | $4,300 | $3.80 | 23d | 1 | 1.47mi |
| 17951 SE 115th Cir Summerfield, FL | 3.0 | 2.0 | 1829 | $2,100 | $1.15 | 15d | 1 | 1.48mi |
| 1648 Belle Grove Dr The Villages, FL | 2.0 | 2.0 | 1132 | $4,250 | $3.75 | 23d | 1 | 1.49mi |
HOA detail
- Monthly dues
- $204 · $2,448/yr
- Likely covers
- gaspool
Listing history 21 events
-
2026-06-22days on market $344,900 Active 98 DOM
-
2026-06-19days on market $344,900 Active 96 DOM
-
2026-06-18days on market $344,900 Active 95 DOM
-
2026-06-17days on market $344,900 Active 94 DOM
-
2026-06-16days on market $344,900 Active 93 DOM
-
2026-06-15days on market $344,900 Active 92 DOM
-
2026-06-14days on market $344,900 Active 90 DOM
-
2026-06-13days on market $344,900 Active 89 DOM
-
2026-06-10days on market $344,900 Active 87 DOM
-
2026-06-09days on market $344,900 Active 86 DOM
-
2026-06-08days on market $344,900 Active 85 DOM
-
2026-06-07days on market $344,900 Active 84 DOM
-
2026-06-02days on market $344,900 Active 79 DOM
-
2026-06-01days on market $344,900 Active 78 DOM
-
2026-05-31days on market $344,900 Active 77 DOM
-
2026-05-30days on market $344,900 Active 76 DOM
-
2026-03-19status Active
-
2026-02-04$344,900 Active
-
2025-01-07soldstatus $350,000
-
2021-08-06soldstatus $290,000
-
2015-02-03soldstatus $199,000
ⓘ Source: listings_history table (triggers on properties + properties_extension) + one-shot
backfill from property_details.listing_events for pre-trigger history.
Tax reassessment forecast FL · Resets to sale price
- Current annual tax
- $2,662 · $222/mo
- Projected year-2 tax
- $2,863 · $239/mo
- Expected delta
- +$201/yr (+$17/mo · 7.6%)
ⓘ Screening estimate from a state-policy table — verify with the county assessor before closing.
Climate risk First Street
- Flood 1/10 Low FEMA zone X (unshaded) · 0% chance over 30 yrs
- Wildfire 4/10 Moderate
- Heat 9/10 Extreme 7 d/yr ≥109°F today · 21 d/yr by 30 yrs out
- Wind 9/10 Extreme 99% chance of damaging wind over 30 yrs
- Air quality 3/10 Moderate 2 unhealthy d/yr today · 3 by 30 yrs out
Nearby sold comps map
Loading sold comps map…
Walkable amenities ~0.75 mi
Loading nearby amenities…
Taxation est. · year 1
- Rental income
- $34,520
- − Mortgage interest
- −$19,320
- − Property taxes
- −$2,662
- − Insurance
- −$1,724
- − Repairs & maintenance
- −$2,762
- − Management
- −$2,762
- − HOA
- −$2,448
- − Depreciation
- −$10,033
- Taxable loss
- −$7,191
- Est. tax savings @ 24.0%
- +$1,726
- After-tax cash flow
- $458/yr
For passive investors: Depreciation is non-cash, so a rental often shows a tax loss while cash-flowing — sheltering income. Rental losses are passive: they offset passive income freely, and up to $25,000/yr can offset ordinary (W-2) income if you actively participate and your MAGI is under $100k (phasing out to $0 by $150k); unused losses carry forward. On sale, claimed depreciation is recaptured at up to 25%, and gains may owe capital-gains tax (a 1031 exchange can defer both). Figures are a year-1 estimate at your 24.0% rate — not tax advice; consult a CPA.
Schools (NCES district)
- District
- Sumter
- NCES district ID
- 1201800
- Math proficiency
- 61% ▼ -4.00%
- Reading proficiency
- 61% ▼ -2.00%
- Median HH income
- $48,240
- Composite
- 51.74/100
- National rank
- #1682
- State rank
- #11 of 73 in FL
Livability — The Villages
- Score
- 70/100
- State rank
- #431
- US rank
- #7363
Category grades
Schools grade is shown separately in the Schools card above.
Census & demographics
- Census place
- The Villages, FL
- County
- Lake County · 364,602 people
- City population
- 83,973
- Metro
- Orlando-Kissimmee-Sanford, FL
- Population (ZIP)
- 32,107
- Household income
- $58,518
- Rent vs Own
- Severe rent burden
- 1047.0
Population outlook (Sumter County) Hauer SSP2
- Today (2025)
- 161,172 people
- By 2030
- 180,083 · +11.7%
- By 2040
- 209,892 · +30.2%
- By 2050
- 234,186 · +45.3%
- By 2075
- 284,602 · +76.6%
- By 2100
- 317,039 · +96.7%
Race, ethnicity, and origin ACS 2023
- Neighborhood character
- Predominantly White (86%)
- Race & ethnicity
- White 86% Hispanic / Latino 6% Two or more races 5% Black 4% Asian 1%
- Hispanic origin (detail)
- Puerto Rican 3%
- Common ancestry
- Romanian 4% Lithuanian 3% Slovak 3%
- Foreign-born
- 5% · Canada, Jamaica
- Languages at home
- 93% English-only · Spanish 4% German/W. Germanic 1% Other Indo-European 1%
Political lean MEDSL · Sumter
- 2024 margin
- Solid R (+37.6) · D 30.9% · R 68.6%
- 2008→2024 swing
- -10.6pp toward R · 2008: -27.0pp · 2024: -37.6pp
- All cycles
- 2024: R+37.6 2020: R+36.1 2016: R+39.2 2012: R+34.9 2008: R+27.0
Not yet ingested
- Civics
- —
Market trends
- HPI YoY
- ▼ -45.24%
- Current HPI
- 237.6208
- Rent YoY
- ▲ 4.03%
- Metro
- Orlando-Kissimmee-Sanford, FL
- State GDP YoY
- ▲ 3.28%
- F500 in state
- 36
Industry mix (Fortune 500 HQ in FL)
| Industry | F500 HQs | Revenue |
|---|---|---|
| Industrial Technology | 2 | $29B |
|
||
| Insurance | 2 | $17B |
|
||
| Retail | 1 | $60B |
|
||
| Technology Distribution | 1 | $58B |
|
||
| Homebuilding | 1 | $35B |
|
||
| Technology Manufacturing | 1 | $35B |
|
||
Price history
+73.3% since first listed5 events — show timeline
- 2026-03-19 Relisted — Stellar MLS as Distributed by MLS Grid
- 2026-02-04 Listed $344,900 Stellar MLS as Distributed by MLS Grid
- 2025-01-07 Sold (Public Records) $350,000 Public Records
- 2021-08-06 Sold (Public Records) $290,000 Public Records
- 2015-02-03 Sold (Public Records) $199,000 Public Records
Property tax history
+3.8%/yrLatest (2025): $2,662 · -26.8% YoY. Source: county tax records.
Cash-flow waterfall
monthlySold comps — $/sqft
last 12 mo · ≤1 miLoading sold comps…