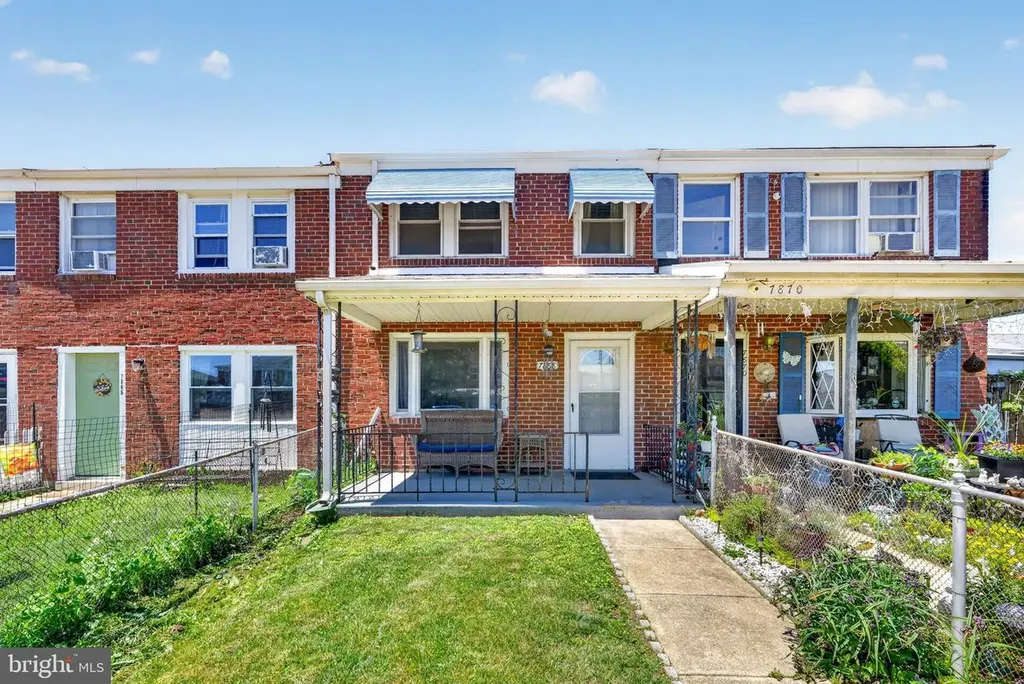
7868 Saint Bridget Ln · Dundalk, MD
Flood risk 1/10 · Minimal
- FEMA flood zone
- X (unshaded)
- Chance of flooding over 30 yrs
- 0.0%
- Est. flood insurance / yr
- $507 – $1,088
Fire risk 1/10 · Minimal
- Est. fire insurance / yr
- $755 – $1,403
Heat risk 8/10 · Major
- Hot days now (above 104°F)
- 7 days/yr
- Hot days in 30 yrs
- 16 days/yr
Wind risk 6/10 · Moderate
- Chance of severe wind over 30 yrs
- 60.0%
Air-quality risk 5/10 · Moderate
- Unhealthy air days now
- 6 days/yr
- Unhealthy air days in 30 yrs
- 8 days/yr
Risk factors via First Street. Map © Google.
Why this score? — see what drove the C- grade
The composite is a weighted blend of 9 inputs, each scored 0–100. Each bar is that input's sub-score; the figure is the points it added to the 100-point composite (weight × sub-score).
- Cash flow +22.6/30.0
- DSCR +7.2/10.0
- ARV discount +6.4/15.0
- 1% rule +5.6/10.0
- Livability +4.2/5.0
- Rent growth +2.5/5.0
- Condition / age +2.5/5.0
- Schools +2.3/10.0
- Appreciation +0.0/10.0
$195,000
🖨 Deal sheet 📄 Offer letter ✓ Due diligence
Listing remarks MLS
Dundalk - Beautifully remodeled 3 bedroom townhouse. Move right in. All the updating has been done for you. New Floors, New Kitchen Cabinets, New Kitchen Appliances, New Paint, New Carpet, Granite Counters, New Closet Doors, New Front and Back Porch Roofs and nearly new HVAC. Large covered patio and off street parking are a plus. Located only minutes from I695.
Key facts
- Built 1956
- Listed 6 days
Property features AI
Exterior
- Parking: Driveway; On-street parking
- Utilities: Public water; Public sewer; Electric service
- Home design: Interior townhouse/rowhouse
- Construction: Brick exterior; Slab foundation; Built year per assessor
- Exterior features: Brick construction; Above-grade and below-grade structures; Property located within city limits; Ground rent paid annually
Interior
- Bedrooms: Three bedrooms on the first upper level
- Bathrooms: One full bathroom
- Heating & cooling: Central heating (electric); Central air conditioning (electric); Electric hot water
- Interior features: Unfinished basement; Living area per assessor
Neighborhood map
What this means for you Summary
Snapshot
- This is a 3-bed/1.0-bath townhouse listed at $195k.
Deal economics
- At list price, monthly cash flow is $332 ($4k/yr) — positive.
- The deal already cash-flows at list — no discount required.
- Meets the 1% rule at list price ($2k rent vs $195k).
- Cap rate 8.3% vs local median 6.2% in Dundalk — top-decile yield for the area; either an underpriced asset or a hidden risk that comps aren't pricing in. Stress-test before assuming the spread holds.
Location & tenants
- Location reads 85/100 on livability (#16 in MD, #510 nationally) — a professional / high-income tenant draw. Strengths: amenities A+, commute A+, housing A+; Watch: crime F.
- Baltimore County Public Schools (suburban): math 15% / reading 34% proficiency, ranked #11 of 24 in MD (top 46%) — low school quality limits family demand, transient renter base, plan for 1-2y turnover.
- Market conditions: Rents soft (-0.1%/yr); 236 active listings in the ZIP; 28 comparable units currently listed for rent nearby; rentals at typical pace (median 15d on market — plan ~3-4 weeks tenant-placement turnaround); 1,511 units permitted in Baltimore County in 2024 (643 in 5+ unit buildings).
- This rent runs 39% of the median local income ($64k/yr) — at the standard rent-burdened threshold; future hikes will face affordability resistance.
Forward outlook
- Local home prices are declining (-3.0%/yr); year-one equity from $1k of loan paydown is wiped out by about $6k of value loss. Plan a longer hold.
- Baltimore County population projected at +12% by 2050 — modest demand growth; plan on rents tracking national, not racing it.
Negotiation context
- Only 6 days on market — expect competitive offers; lowballing is unlikely to land.
- 2 sale attempts since 18y ago; this cycle's ask is 62% above the opening price — seller raised mid-cycle; expect resistance to lowballs.
- Current owner paid $124k; list at $195k implies a 58% gain — meaningful room to come down on a strong offer.
Risks & watch-outs
- Watch-outs: built in 1956 — expect roof / HVAC / electrical / plumbing capex.
- Climate carrying-cost: major wind risk, 60% chance of damaging wind over 30y; extreme-heat days projected 7→16/yr by 2055 (HVAC capex compounding) — expect insurance premiums to compound above CPI over the hold.
Questions for the listing agent
- Built in 1956 — when were the roof, HVAC, electrical panel, plumbing, and water heater last replaced?
- Is there a deadline driving the sale (1031 exchange, divorce, estate, relocation)? That informs how much negotiation room exists.
- Schools are A-rated — typically a magnet for longer-tenancy family renters. What's the average tenant stay here, and is there a school-zone premium baked into asking?
- Crime grade is F in this area — have there been break-ins, vandalism, or insurance claims at this property in the last 3 years? What carrier currently insures it and at what premium?
- What's the average days-on-market for RENTAL listings here right now (not sales)? A rising rental-DOM trend means longer vacancies and softer asking-rent achievability than the comps imply.
- What's the recent tenant-quality profile in this submarket — average credit score on applications, eviction rate, late-payment / NSF rate, and stable-employment percentage? A property-management company in the area should have these aggregated.
- How much new for-sale + rental construction is in the pipeline within 1–3 miles? Heavy new supply typically softens prices + rents 12–24 months out; constrained supply supports both.
Investment metrics
- 1% rule
- 1.06% ✓
- Cap rate
- 8.34%
- Cash-on-cash
- 7.29%
- DSCR
- 1.32
- GRM
- 7.9
CMA / ARV
- ARV (on-the-fly)
- $190,464
- Comps found
- 6
Show comp detail 6 sales within ~0.75 mi
| Address | Dist | Beds/Ba | Sqft | Sold | Price | $/sf | Match |
|---|---|---|---|---|---|---|---|
| 7847 Saint Claire | 0.04mi | 3/1.0 | 1,024 (0%) | 8mo | $180,000 | $176 | 91 |
| 7858 Saint Claire Ln | 0.05mi | 3/1.5 | 1,024 (0%) | 16mo | $195,000 | $190 | 82 |
| 7845 Saint Patricia Ln | 0.22mi | 4/2.0 (+1) | 1,024 (0%) | 4mo | $220,000 | $215 | 78 |
| 4061 Saint Monica Dr | 0.13mi | 3/1.0 | 1,024 (0%) | 21mo | $162,000 | $158 | 77 |
| 7904 Saint Monica Dr | 0.11mi | 3/1.0 | 1,144 (+12%) | 4mo | $130,000 | $114 | 72 |
| 8225 Park Haven Rd | 0.72mi | 3/1.5 | 1,024 (0%) | 21mo | $190,000 | $186 | 47 |
Match score weights: distance 35% · size 25% · config 20% · recency 20%. Top-matched comps best support the ARV.
Projected returns pro-forma
-3.0% appreciation · 0.0% rent growth · sell at horizon
- IRR
- -8.5%
- Equity multiple
- 0.70×
- Total profit
- $-16,506
- Equity at exit
- $29,075
- IRR
- -3.3%
- Equity multiple
- 0.81×
- Total profit
- $-10,513
- Equity at exit
- $16,860
Cash invested: $54,600 (down + closing). Projections, not guarantees.
Landlord ↔ Tenant lean methodology
- Overall (STATE)
- 27 Tenant-Leaning
- State Maryland
- 27 Tenant-Leaning · D+14
- County
- — inherits STATE
- City
- — inherits STATE
ZIP-level market 21222
- Rents YoY
- -0.1%
- Active inventory
- 236
- Price-to-rent
- 7.9×
Monthly cashflow live
- Estimated rent
- $2,062 high interval (Pro) →
- Mortgage (P&I)
- −$1,023
- Tax from tax record
- −$193 /mo · $2,322/yr
- Insurance
- −$81
- HOA
- −$0
- Vacancy / Maint / Mgmt
- −$433
- Net cashflow
- $332
Break-even live
UW: 25.0% down · 7.5% · 30yr · 1.5% tax · 5.0% vac · 8.0% maint · 8.0% mgmt
Financing live
Cash to close
- Down payment
- $48,750
- Closing costs
- $5,850
- Reserves months
- —
- Total cash needed
- —
Loan-product check · same deal, 3 products live
Conventional
25% down · 7.5% · 30yr
- Down + closing
- —
- Monthly P&I
- —
- Monthly cashflow
- —
- DSCR
- —
- Eligible?
- —
Personal DTI + credit; lowest rate.
DSCR
20% down · 8.5% · 30yr
- Down + closing
- —
- Monthly P&I
- —
- Monthly cashflow
- —
- DSCR
- —
- Eligible?
- —
No personal income docs; deal must DSCR.
Hard money
10% down · 12.0% · 12mo
- Down + closing
- —
- Monthly P&I
- —
- Monthly cashflow
- —
- DSCR
- —
- Eligible?
- —
Short-term bridge; refi at stabilization.
Rent comps 28 comps
| Address | Beds | Baths | Sqft | Rent | $/sqft | DOM | Units | Dist |
|---|---|---|---|---|---|---|---|---|
| 7860 Saint Bridget Ln Dundalk, MD | 4.0 | 1.0 | 1216 | $2,300 | $1.89 | 23d | 1 | 0.03mi |
| 7860 Saint Claire Ln Dundalk, MD | 3.0 | 2.0 | 1024 | $2,200 | $2.15 | 4d | 1 | 0.06mi |
| 7863 Saint Fabian Ln Dundalk, MD | 3.0 | 2.0 | 1424 | $1,950 | $1.37 | 4d | 1 | 0.14mi |
| 7851 Saint Fabian Ln Dundalk, MD | 3.0 | 1.0 | 1024 | $1,595 | $1.56 | 43d | 1 | 0.15mi |
| 4004 St Monica Dr Unit 1 Dundalk, MD | 3.0 | 1.0 | 1024 | $1,895 | $1.85 | 4d | 1 | 0.23mi |
| 4004 Saint Monica Dr Dundalk, MD | 3.0 | 1.0 | 1024 | $1,925 | $1.88 | 4d | 1 | 0.23mi |
| 7412 Saint Patricia Ct Dundalk, MD | 4.0 | 2.0 | 1024 | $2,800 | $2.73 | 17d | 1 | 0.30mi |
| 11 Seabright Ave Dundalk, MD | 3.0 | 1.0 | 948 | $1,874 | $1.98 | 14d | 1 | 0.63mi |
| 1610 Melbourne Rd Dundalk, MD | 1.0–2.0 | 1.0 | 664 | $1,240 | $1.87 | 12d | 1 | 0.70mi |
| 8146 Del Haven Rd Dundalk, MD | 3.0 | 2.0 | 1424 | $2,700 | $1.90 | 16d | 1 | 0.86mi |
| 3413 Wallford Dr Dundalk, MD | 3.0 | 2.0 | 1016 | $2,000 | $1.97 | 43d | 1 | 0.91mi |
| 3427 North Point Rd Dundalk, MD | 3.0 | 1.0 | 1008 | $2,250 | $2.23 | 19d | 1 | 0.94mi |
| 3314 Wallford Dr Dundalk, MD | 3.0 | 1.0 | 1258 | $1,850 | $1.47 | 14d | 1 | 1.01mi |
| 3317 Belsford Ct Dundalk, MD | 3.0 | 1.0 | 1258 | $1,950 | $1.55 | 10d | 1 | 1.01mi |
| 3221 Wallford Dr Unit 3221 Dundalk, MD | 3.0 | 1.0 | 1008 | $1,750 | $1.74 | 4d | 1 | 1.02mi |
| 3221 Wallford Dr Dundalk, MD | 3.0 | 1.0 | 1008 | $1,750 | $1.74 | 3d | 1 | 1.02mi |
| 1925 Jasmine Rd Dundalk, MD | 3.0 | 1.5 | 1024 | $1,825 | $1.78 | 10d | 1 | 1.03mi |
| 2004 Larkhall Rd Dundalk, MD | 3.0 | 1.0 | 1024 | $1,500 | $1.46 | 43d | 1 | 1.07mi |
| 2025 Kelmore Rd Unit 1 Dundalk, MD | 3.0 | 1.0 | 1024 | $2,000 | $1.95 | 43d | 1 | 1.10mi |
| 1930 Frames Rd Dundalk, MD | 3.0 | 2.0 | 1152 | $2,099 | $1.82 | 4d | 1 | 1.11mi |
| 2032 Kelmore Rd Dundalk, MD | 3.0 | 1.0 | 1024 | $1,700 | $1.66 | 43d | 1 | 1.12mi |
| 8499 Lynch Rd Dundalk, MD | 1.0–3.0 | 1.0–2.0 | 950 | $2,202 | $2.32 | 1d | 32 | 1.14mi |
| 3000 Wallford Dr Dundalk, MD | 1.0–2.0 | 1.0 | 717 | $1,330 | $1.85 | 2d | 35 | 1.21mi |
| 7962 Kavanagh Rd Dundalk, MD | 3.0 | 2.0 | 1024 | $1,947 | $1.90 | 14d | 1 | 1.23mi |
| 7917 Wise Ave Dundalk, MD | 2.0 | 1.5 | 1500 | $2,500 | $1.67 | 23d | 1 | 1.24mi |
| 2020 Dineen Dr Dundalk, MD | 3.0 | 1.5 | 1258 | $1,850 | $1.47 | 4d | 1 | 1.27mi |
| 7930 Kavanagh Rd Dundalk, MD | 3.0 | 1.0 | 1024 | $2,195 | $2.14 | 43d | 1 | 1.29mi |
| 7901 Stratman Rd Dundalk, MD | 3.0 | 1.0 | 890 | $1,647 | $1.85 | 2d | 1 | 1.43mi |
Listing history 9 events
-
2026-06-18days on market $195,000 Active 6 DOM
-
2026-06-17days on market $195,000 Active 5 DOM
-
2026-06-16days on market $195,000 Active 4 DOM
-
2026-06-15days on market $195,000 Active 3 DOM
-
2026-06-13statusdays on market $195,000 Active 1 DOM
-
2026-06-09days on market $195,000 Coming Soon 4 DOM
-
2026-06-08days on market $195,000 Coming Soon 3 DOM
-
2026-06-07remarks 359-char remark
-
2026-06-07$195,000 Coming Soon 2 DOM
ⓘ Source: listings_history table (triggers on properties + properties_extension) + one-shot
backfill from property_details.listing_events for pre-trigger history.
Tax reassessment forecast MD · Partial reset (capped growth)
- Current annual tax
- $2,322 · $193/mo
- Projected year-2 tax
- $2,322 · $193/mo
- Expected delta
- $0/yr ($0/mo · 0.0%)
ⓘ Screening estimate from a state-policy table — verify with the county assessor before closing.
Climate risk First Street
- Flood 1/10 Low FEMA zone X (unshaded) · 0% chance over 30 yrs
- Wildfire 1/10 Low
- Heat 8/10 Severe 7 d/yr ≥104°F today · 16 d/yr by 30 yrs out
- Wind 6/10 Major 60% chance of damaging wind over 30 yrs
- Air quality 5/10 Major 6 unhealthy d/yr today · 8 by 30 yrs out
Nearby sold comps map
Loading sold comps map…
Walkable amenities ~0.75 mi
Loading nearby amenities…
Taxation est. · year 1
- Rental income
- $24,747
- − Mortgage interest
- −$10,923
- − Property taxes
- −$2,322
- − Insurance
- −$975
- − Repairs & maintenance
- −$1,980
- − Management
- −$1,980
- − Depreciation
- −$5,673
- Taxable income
- $895
- Est. tax owed @ 24.0%
- −$215
- After-tax cash flow
- $3,767/yr
For passive investors: Depreciation is non-cash, so a rental often shows a tax loss while cash-flowing — sheltering income. Rental losses are passive: they offset passive income freely, and up to $25,000/yr can offset ordinary (W-2) income if you actively participate and your MAGI is under $100k (phasing out to $0 by $150k); unused losses carry forward. On sale, claimed depreciation is recaptured at up to 25%, and gains may owe capital-gains tax (a 1031 exchange can defer both). Figures are a year-1 estimate at your 24.0% rate — not tax advice; consult a CPA.
Schools (NCES district)
- District
- Baltimore County Public Schools
- NCES district ID
- 2400120
- Math proficiency
- 15% ▼ -16.00%
- Reading proficiency
- 34% ▼ -5.00%
- Median HH income
- $66,746
- Composite
- 23.17/100
- National rank
- #7948
- State rank
- #11 of 24 in MD
Livability — Dundalk
- Score
- 85/100
- State rank
- #16
- US rank
- #510
Category grades
Schools grade is shown separately in the Schools card above.
Census & demographics
- Census place
- Dundalk, MD
- County
- Baltimore County · 769,527 people
- City population
- 59,407
- Metro
- Baltimore-Columbia-Towson, MD
- Population (ZIP)
- 59,407
- Household income
- $64,141
- Rent vs Own
- Severe rent burden
- 2566.0
Population outlook (Baltimore County) Hauer SSP2
- Today (2025)
- 885,518 people
- By 2030
- 909,272 · +2.7%
- By 2040
- 951,547 · +7.5%
- By 2050
- 990,955 · +11.9%
- By 2075
- 1,086,411 · +22.7%
- By 2100
- 1,135,078 · +28.2%
Race, ethnicity, and origin ACS 2023
- Neighborhood character
- Diverse neighborhood (Simpson 0.60)
- Race & ethnicity
- White 59% Black 18% Hispanic / Latino 15% Two or more races 7% Asian 2% Native American 1%
- Hispanic origin (detail)
- Mexican 3% Puerto Rican 2%
- Common ancestry
- Romanian 7% Lithuanian 1% Italian 1%
- Foreign-born
- 9% · Canada
- Languages at home
- 85% English-only · Spanish 11% Other Indo-European 2% Arabic 1%
Political lean MEDSL · Baltimore
- 2024 margin
- Strong D (+24.5) · D 61.0% · R 36.5% · Other 2.5%
- 2008→2024 swing
- +9.9pp toward D · 2008: 14.6pp · 2024: 24.5pp
- All cycles
- 2024: D+24.5 2020: D+27.0 2016: D+17.4 2012: D+16.4 2008: D+14.6
Not yet ingested
- Civics
- —
Market trends
- HPI YoY
- ▼ -251.44%
- Current HPI
- 228.4218
- Rent YoY
- ▼ -0.09%
- Metro
- Baltimore-Columbia-Towson, MD
- State GDP YoY
- ▲ 2.97%
- F500 in state
- 12
Industry mix (Fortune 500 HQ in MD)
| Industry | F500 HQs | Revenue |
|---|---|---|
| Aerospace / Defense | 1 | $71B |
|
||
| Utilities | 1 | $25B |
|
||
| Hotels | 1 | $24B |
|
||
| Consumer Goods | 1 | $7B |
|
||
| Real Estate | 1 | $6B |
|
||
| Chemicals | 1 | $2B |
|
||
Price history
+457.1% since first listed8 events — show timeline
- 2026-06-05 Coming Soon $195,000 BRIGHT MLS
- 2018-12-14 Sold (MLS) $123,500 BRIGHT MLS
- 2018-12-12 Pending — BRIGHT MLS
- 2018-10-07 Contingent — BRIGHT MLS
- 2018-10-02 Listed $120,000 BRIGHT MLS
- 2008-12-05 Delisted — MRIS
- 2008-10-06 Listed — MRIS
- 1986-06-26 Sold (Public Records) $35,000 Public Records
Property tax history
+1.8%/yrLatest (2025): $2,322 · +8.8% YoY. Source: county tax records.
Cash-flow waterfall
monthlySold comps — $/sqft
last 12 mo · ≤1 miLoading sold comps…