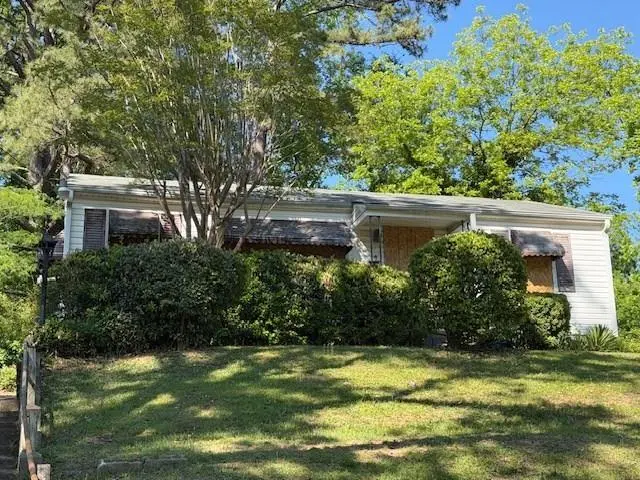
2103 Penelope St NW · Atlanta, GA
Flood risk 1/10 · Minimal
- FEMA flood zone
- X (unshaded)
- Chance of flooding over 30 yrs
- 0.0%
- Est. flood insurance / yr
- $473 – $860
Fire risk 1/10 · Minimal
- Est. fire insurance / yr
- $963 – $1,789
Heat risk 5/10 · Moderate
- Hot days now (above 103°F)
- 7 days/yr
- Hot days in 30 yrs
- 18 days/yr
Wind risk 6/10 · Moderate
- Chance of severe wind over 30 yrs
- 27.0%
Air-quality risk 4/10 · Minor
- Unhealthy air days now
- 3 days/yr
- Unhealthy air days in 30 yrs
- 5 days/yr
Risk factors via First Street. Map © Google.
Why this score? — see what drove the B grade
The composite is a weighted blend of 9 inputs, each scored 0–100. Each bar is that input's sub-score; the figure is the points it added to the 100-point composite (weight × sub-score).
- Cash flow +30.0/30.0
- 1% rule +10.0/10.0
- DSCR +10.0/10.0
- ARV discount +7.5/15.0
- Livability +4.2/5.0
- Rent growth +3.1/5.0
- Schools +2.7/10.0
- Condition / age +2.5/5.0
- Appreciation +0.0/10.0
$99,900
🖨 Deal sheet 📄 Offer letter ✓ Due diligence
Listing remarks MLS
Located in the heart of Atlanta's Westside, this Penelope Street property offers a promising opportunity for buyers looking to add value in a thriving in-town community. The home sits near major redevelopment zones, parks, transit, and key city amenities, making it an appealing option for those seeking long-term potential. With the right vision, this property can be transformed to align with the continued growth of the surrounding area.
Key facts
- 9,748 sq ft lot
- Built 1954
- Listed 20 days
Property features AI
Exterior
- Parking: Driveway with open parking
- Utilities: Public water; Public sewer; Cable available; Electricity available
- Home design: One-level home
- Construction: Frame construction; Block foundation; Other roof type; Resale condition
- Exterior features: Paved road access; Driveway; Open parking available
Interior
- Kitchen: No specific kitchen features listed
- Bedrooms: Two main-level bedrooms
- Flooring: Other flooring
- Bathrooms: One full bathroom (main level)
- Heating & cooling: Central heating; Central air conditioning
- Interior features: No shared/common walls; Crawl space
- Laundry & utility: No laundry details listed
Neighborhood map
What this means for you Summary
Snapshot
- This is a 2-bed/1.0-bath single-family listed at $100k.
Deal economics
- At list price, monthly cash flow is $499 ($6k/yr) — positive.
- The deal already cash-flows at list — no discount required.
- Meets the 1% rule at list price ($2k rent vs $100k).
- Recommended offer: $98k (1.5% below list) — sets the bar for market timing.
Location & tenants
- Location reads 83/100 on livability (#6 in GA, #919 nationally) — a professional / high-income tenant draw. Strengths: amenities A+, commute A+, housing A+; Watch: cost of living C-.
- Atlanta Public Schools (urban): math 28% / reading 35% proficiency, ranked #80 of 174 in GA (top 46%) — families likely to look elsewhere, expect single-tenant / working-renter base with shorter leases; 71% free/reduced lunch — lower-income household profile, screen leases tightly.
- Zoned schools: F. L. Stanton Elementary School (math 15% / reading 5%, grade F, #1,076 of 1,228 statewide, top 89%, 207 students, 100% FRL) — zoned schools average 100% FRL vs 71% district-wide (29 pts higher); higher-poverty schools than district average — tighter screening recommended.
- Zoned-school proficiency averages 10% at this address vs 32% district-wide (-22 pts) — the specific schools serving this property underperform the Atlanta Public Schools average; the district grade overstates school quality for this exact location.
- Market conditions: Rents rising (+2.5%/yr); 293 active listings in the ZIP; 40 comparable units currently listed for rent nearby; rentals at typical pace (median 25d on market — plan ~3-4 weeks tenant-placement turnaround); lower-income renter base — watch delinquency; 11,565 units permitted in Fulton County in 2024 (8,159 in 5+ unit buildings).
Forward outlook
- Local home prices are declining (-3.0%/yr); year-one equity from $691 of loan paydown is wiped out by about $3k of value loss. Plan a longer hold.
- Fulton County population projected at +38% by 2050 — long-run rental-demand tailwind backs the buy-and-hold thesis.
- At projected returns (-3.0% appreciation + 2.5% rent growth), your $28k cash investment doubles in ~6 years — after that, you're playing with house money.
Negotiation context
- It's been on market 20 days — a 2% lower offer ($98k) is reasonable based on typical stale-listing flexibility.
- 2 sale attempts; this cycle's ask has dropped $65k (39%) from the opening price — seller is motivated, your offer sets the floor, not the list.
- Current owner paid $43k; list at $100k implies a 132% gain — meaningful room to come down on a strong offer.
Risks & watch-outs
- Watch-outs: built in 1954 — expect roof / HVAC / electrical / plumbing capex.
- Climate carrying-cost: major wind risk, 27% chance of damaging wind over 30y; extreme-heat days projected 7→18/yr by 2055 (HVAC capex compounding) — expect insurance premiums to compound above CPI over the hold.
Questions for the listing agent
- Built in 1954 — when were the roof, HVAC, electrical panel, plumbing, and water heater last replaced?
- Is there a deadline driving the sale (1031 exchange, divorce, estate, relocation)? That informs how much negotiation room exists.
- What's the average days-on-market for RENTAL listings here right now (not sales)? A rising rental-DOM trend means longer vacancies and softer asking-rent achievability than the comps imply.
- What's the recent tenant-quality profile in this submarket — average credit score on applications, eviction rate, late-payment / NSF rate, and stable-employment percentage? A property-management company in the area should have these aggregated.
- How much new for-sale + rental construction is in the pipeline within 1–3 miles? Heavy new supply typically softens prices + rents 12–24 months out; constrained supply supports both.
Investment metrics
- 1% rule
- 1.51% ✓
- Cap rate
- 12.29%
- Cash-on-cash
- 21.40%
- DSCR
- 1.95
- GRM
- 5.5
CMA / ARV
- ARV (on-the-fly)
- $204,750
- Comps found
- 12
Show comp detail 12 sales within ~0.75 mi
| Address | Dist | Beds/Ba | Sqft | Sold | Price | $/sf | Match |
|---|---|---|---|---|---|---|---|
| 2040 Penelope St NW | 0.13mi | 2/2.0 | 1,042 (-1%) | 3mo | $160,000 | $154 | 86 |
| 2081 Verbena St NW | 0.11mi | 3/2.0 (+1) | 1,100 (+5%) | 8mo | $215,000 | $195 | 71 |
| 100 Dahlia Ave NW | 0.49mi | 2/1.5 | 1,050 (0%) | 6mo | $245,696 | $234 | 70 |
| 2219 Wingate St SW | 0.46mi | 2/2.0 | 1,066 (+2%) | 8mo | $280,000 | $263 | 65 |
| 170 Adeline Ave NW | 0.51mi | 3/2.0 (+1) | 1,040 (-1%) | 3mo | $235,000 | $226 | 63 |
| 2200 Larchwood Rd SW | 0.49mi | 2/2.0 | 984 (-6%) | 3mo | $146,000 | $148 | 60 |
| 346 Henry Aaron Ave SW | 0.50mi | 3/1.0 (+1) | 1,108 (+6%) | 7mo | $149,000 | $134 | 56 |
| 305 Henry Aaron Ave SW | 0.43mi | 3/2.0 (+1) | 1,144 (+9%) | 6mo | $320,000 | $280 | 51 |
| 191 Florida Ave SW | 0.59mi | 3/1.0 (+1) | 950 (-10%) | 3mo | $135,000 | $142 | 49 |
| 354 Henry Aaron Ave SW | 0.54mi | 3/2.0 (+1) | 1,113 (+6%) | 8mo | $199,000 | $179 | 49 |
| 2274 Larchwood Rd SW | 0.56mi | 3/1.0 (+1) | 1,152 (+10%) | 7mo | $70,000 | $61 | 47 |
| 102 Dahlia Ave NW | 0.50mi | 3/2.0 (+1) | 1,200 (+14%) | 6mo | $244,000 | $203 | 39 |
Match score weights: distance 35% · size 25% · config 20% · recency 20%. Top-matched comps best support the ARV.
Projected returns pro-forma
-3.0% appreciation · 2.53% rent growth · sell at horizon
- IRR
- 13.4%
- Equity multiple
- 1.53×
- Total profit
- $14,901
- Equity at exit
- $14,895
- IRR
- 21.9%
- Equity multiple
- 2.83×
- Total profit
- $51,103
- Equity at exit
- $8,638
Cash invested: $27,972 (down + closing). Projections, not guarantees.
Landlord ↔ Tenant lean methodology
- Overall (STATE)
- 90 Strongly Landlord-Friendly
- State Georgia
- 90 Strongly Landlord-Friendly · R+3
- County
- — inherits STATE
- City
- — inherits STATE
ZIP-level market 30314
- Home prices YoY
- -22.9%
- Rents YoY
- 2.5%
- Active inventory
- 293
- Price-to-rent
- 5.5×
Monthly cashflow live
- Estimated rent
- $1,505 high interval (Pro) →
- Mortgage (P&I)
- −$524
- Tax est. 1.5%
- −$125 /mo · $1,498/yr
- Insurance
- −$42
- HOA
- −$0
- Vacancy / Maint / Mgmt
- −$316
- Net cashflow
- $499
Break-even live
UW: 25.0% down · 7.5% · 30yr · 1.5% tax · 5.0% vac · 8.0% maint · 8.0% mgmt
Financing live
Cash to close
- Down payment
- $24,975
- Closing costs
- $2,997
- Reserves months
- —
- Total cash needed
- —
Loan-product check · same deal, 3 products live
Conventional
25% down · 7.5% · 30yr
- Down + closing
- —
- Monthly P&I
- —
- Monthly cashflow
- —
- DSCR
- —
- Eligible?
- —
Personal DTI + credit; lowest rate.
DSCR
20% down · 8.5% · 30yr
- Down + closing
- —
- Monthly P&I
- —
- Monthly cashflow
- —
- DSCR
- —
- Eligible?
- —
No personal income docs; deal must DSCR.
Hard money
10% down · 12.0% · 12mo
- Down + closing
- —
- Monthly P&I
- —
- Monthly cashflow
- —
- DSCR
- —
- Eligible?
- —
Short-term bridge; refi at stabilization.
Rent comps 40 comps
| Address | Beds | Baths | Sqft | Rent | $/sqft | DOM | Units | Dist |
|---|---|---|---|---|---|---|---|---|
| 295 Penelope Dr NW Atlanta, GA | 1.0–2.0 | 1.0 | 751 | $1,542 | $2.05 | 22d | 1 | 0.36mi |
| 1839 Penelope Rd NW Atlanta, GA | 3.0 | 1.0 | 988 | $1,400 | $1.42 | 24d | 1 | 0.39mi |
| 166 Anderson Ave NW Unit B17 Atlanta, GA | 2.0 | 1.0 | 760 | $1,150 | $1.51 | 24d | 1 | 0.43mi |
| 166 Anderson Ave NW Unit B18 Atlanta, GA | 2.0 | 1.0 | 760 | $1,095 | $1.44 | 3d | 1 | 0.43mi |
| 166 Anderson Ave NW Unit B12 Atlanta, GA | 2.0 | 1.0 | 760 | $1,095 | $1.44 | 8d | 1 | 0.43mi |
| 166 Anderson Ave NW Apt B4 Atlanta, GA | 2.0 | 1.0 | 760 | $1,095 | $1.44 | 12d | 1 | 0.43mi |
| 2227 Telhurst St SW Atlanta, GA | 2.0 | 2.0 | 928 | $1,395 | $1.50 | 14d | 1 | 0.45mi |
| 2227 Telhurst St SW Atlanta, GA | 2.0 | 2.0 | 928 | $1,395 | $1.50 | 4d | 1 | 0.45mi |
| 324 Brooks Ave SW Unit A Atlanta, GA | 2.0 | 1.0 | 1176 | $1,000 | $0.85 | 24d | 1 | 0.49mi |
| 324 Brooks Ave SW Unit B Atlanta, GA | 2.0 | 1.0 | 1176 | $1,050 | $0.89 | 24d | 1 | 0.49mi |
| 273 Wadley St NW Atlanta, GA | 3.0 | 2.0 | 1406 | $1,990 | $1.42 | 24d | 1 | 0.50mi |
| 0 W Lake Ave NW Atlanta, GA | 3.0 | 2.5 | 1300 | $1,900 | $1.46 | 2d | 1 | 0.56mi |
| 364 Brooks Ave SW Atlanta, GA | 3.0 | 2.0 | 1134 | $1,495 | $1.32 | 8d | 1 | 0.57mi |
| 2111 Martin Luther King Junior Dr NW Atlanta, GA | 3.0 | 1.0 | 1470 | $1,800 | $1.22 | 24d | 1 | 0.60mi |
| 1824 Tiger Flowers Dr NW Atlanta, GA | 1.0 | 1.0 | 1400 | $925 | $0.66 | 24d | 1 | 0.61mi |
| 269 Florida Ave SW Atlanta, GA | 3.0 | 1.0 | 925 | $1,850 | $2.00 | 24d | 1 | 0.64mi |
| 2199 Tiger Flowers Dr NW Atlanta, GA | 3.0 | 1.0 | 936 | $1,325 | $1.42 | 24d | 1 | 0.65mi |
| 156 Fairfield Pl NW Unit B-9 Atlanta, GA | 2.0 | 1.0 | 750 | $1,199 | $1.60 | 24d | 1 | 0.66mi |
| 1770 Springview Rd NW Atlanta, GA | 3.0 | 2.0 | 1262 | $2,000 | $1.58 | 24d | 1 | 0.73mi |
| 2423 M.L.K. Jr Dr SW Atlanta, GA | 1.0–3.0 | 1.0–2.0 | 1120 | $1,356 | $1.21 | 2d | 19 | 0.75mi |
| 176 Racine St SW Atlanta, GA | 3.0 | 2.0 | 1423 | $2,800 | $1.97 | 24d | 1 | 0.77mi |
| 195 W Lake Ave NW Unit 1 Atlanta, GA | 3.0 | 2.0 | 1245 | $2,654 | $2.13 | 24d | 1 | 0.77mi |
| 1916 Joseph E. Boone Blvd NW Unit B Atlanta, GA | 2.0 | 1.0 | 1000 | $1,195 | $1.20 | 24d | 1 | 0.79mi |
| 1916 Joseph E. Boone Blvd NW Unit A Atlanta, GA | 3.0 | 1.0 | 1100 | $1,550 | $1.41 | 21d | 1 | 0.79mi |
| 240 Whitaker Cir NW Atlanta, GA | 1.0 | 1.0 | 1414 | $665 | $0.47 | 5d | 1 | 0.82mi |
| 240 Whitaker Cir NW Atlanta, GA | 1.0 | 1.0 | 1414 | $685 | $0.48 | 18d | 1 | 0.82mi |
| 340 Dixie Hills Cir NW Unit C1 Atlanta, GA | 2.0 | 1.0 | 775 | $1,099 | $1.42 | 24d | 1 | 0.84mi |
| 1699 Derry Ave SW Atlanta, GA | 2.0 | 1.0 | 825 | $1,800 | $2.18 | 24d | 1 | 0.89mi |
| 39 Holly Rd NW Atlanta, GA | 1.0 | 1.0 | 1120 | $970 | $0.87 | 8d | 1 | 0.97mi |
| 39 Holly Rd NW Atlanta, GA | 1.0 | 1.0 | 1120 | $775 | $0.69 | 24d | 1 | 0.97mi |
| 1948 Detroit Ave NW Unit A Atlanta, GA | 3.0 | 2.5 | 1205 | $1,900 | $1.58 | 24d | 1 | 0.97mi |
| 2059 Detroit Ave NW Atlanta, GA | 2.0 | 1.0 | 750 | $1,340 | $1.79 | 22d | 1 | 0.98mi |
| 2506 Godfrey Dr NW Atlanta, GA | 1.0 | 1.0 | 1344 | $650 | $0.48 | 24d | 1 | 1.00mi |
| 1894 North Ave NW Atlanta, GA | 2.0 | 1.5 | 1098 | $1,995 | $1.82 | 24d | 1 | 1.08mi |
| 518 Pelton Pl NW Atlanta, GA | 1.0 | 1.0 | 1036 | $750 | $0.72 | 24d | 1 | 1.11mi |
| 390 W Lake Ave NW Apt A1 Atlanta, GA | 3.0 | 1.5 | 1256 | $1,299 | $1.03 | 24d | 1 | 1.11mi |
| 390 W Lake Ave NW Unit A10 Atlanta, GA | 3.0 | 1.5 | 1256 | $1,275 | $1.02 | 24d | 1 | 1.11mi |
| 390 W Lake Ave NW Unit B9 Atlanta, GA | 2.0 | 1.5 | 1256 | $1,275 | $1.02 | 24d | 1 | 1.11mi |
| 1619 Stokes Ave SW Atlanta, GA | 3.0 | 2.0 | 1332 | $2,400 | $1.80 | 3d | 1 | 1.11mi |
| 511 Emily Pl NW Atlanta, GA | 3.0 | 1.0 | 1101 | $1,745 | $1.58 | 24d | 1 | 1.12mi |
Listing history 14 events
-
2026-06-18days on market $99,900 Active 20 DOM
-
2026-06-17days on market $99,900 Active 19 DOM
-
2026-06-16days on market $99,900 Active 18 DOM
-
2026-06-15days on market $99,900 Active 17 DOM
-
2026-06-13days on market $99,900 Active 15 DOM
-
2026-06-13days on market $99,900 Active 14 DOM
-
2026-06-09days on market $99,900 Active 11 DOM
-
2026-06-08days on market $99,900 Active 10 DOM
-
2026-06-07days on market $99,900 Active 9 DOM
-
2026-06-04pricedays on market $99,900 Active 6 DOM
-
2026-06-03days on market $164,900 Active 5 DOM
-
2026-06-02days on market $164,900 Active 4 DOM
-
2026-06-01days on market $164,900 Active 3 DOM
-
2026-05-31days on market $164,900 Active 2 DOM
ⓘ Source: listings_history table (triggers on properties + properties_extension) + one-shot
backfill from property_details.listing_events for pre-trigger history.
Climate risk First Street
- Flood 1/10 Low FEMA zone X (unshaded) · 0% chance over 30 yrs
- Wildfire 1/10 Low
- Heat 5/10 Major 7 d/yr ≥103°F today · 18 d/yr by 30 yrs out
- Wind 6/10 Major 27% chance of damaging wind over 30 yrs
- Air quality 4/10 Moderate 3 unhealthy d/yr today · 5 by 30 yrs out
Nearby sold comps map
Loading sold comps map…
Walkable amenities ~0.75 mi
Loading nearby amenities…
Taxation est. · year 1
- Rental income
- $18,065
- − Mortgage interest
- −$5,596
- − Property taxes
- −$1,498
- − Insurance
- −$500
- − Repairs & maintenance
- −$1,445
- − Management
- −$1,445
- − Depreciation
- −$2,906
- Taxable income
- $4,674
- Est. tax owed @ 24.0%
- −$1,122
- After-tax cash flow
- $4,865/yr
For passive investors: Depreciation is non-cash, so a rental often shows a tax loss while cash-flowing — sheltering income. Rental losses are passive: they offset passive income freely, and up to $25,000/yr can offset ordinary (W-2) income if you actively participate and your MAGI is under $100k (phasing out to $0 by $150k); unused losses carry forward. On sale, claimed depreciation is recaptured at up to 25%, and gains may owe capital-gains tax (a 1031 exchange can defer both). Figures are a year-1 estimate at your 24.0% rate — not tax advice; consult a CPA.
Schools (NCES district)
- District
- Atlanta Public Schools
- NCES district ID
- 1300120
- Math proficiency
- 28% ▼ -6.00%
- Reading proficiency
- 35% ▼ -2.00%
- Median HH income
- $48,306
- Composite
- 27.27/100
- National rank
- #7006
- State rank
- #80 of 174 in GA
Livability — Atlanta
- Score
- 83/100
- State rank
- #6
- US rank
- #919
Category grades
Schools grade is shown separately in the Schools card above.
Census & demographics
- Census place
- Atlanta, GA
- County
- Fulton County · 1,094,430 people
- City population
- 629,525
- Metro
- Atlanta-Sandy Springs-Alpharetta, GA
- Population (ZIP)
- 23,333
- Household income
- $42,089
- Rent vs Own
- Severe rent burden
- 1293.0
Population outlook (Fulton County) Hauer SSP2
- Today (2025)
- 1,203,707 people
- By 2030
- 1,299,706 · +8.0%
- By 2040
- 1,488,256 · +23.6%
- By 2050
- 1,664,580 · +38.3%
- By 2075
- 2,036,072 · +69.2%
- By 2100
- 2,222,402 · +84.6%
Race, ethnicity, and origin ACS 2023
- Neighborhood character
- Predominantly Black (76%)
- Race & ethnicity
- Black 76% White 11% Hispanic / Latino 7% Asian 4% Two or more races 3%
- Hispanic origin (detail)
- Mexican 4% Dominican 1%
- Common ancestry
- Lithuanian 1%
- Foreign-born
- 6% · Canada, China, South Korea
- Languages at home
- 89% English-only · Spanish 5% Other Indo-European 1% Chinese 1%
Political lean MEDSL · Fulton
- 2024 margin
- Solid D (+44.9) · D 71.9% · R 27.0% · Other 1.1%
- 2008→2024 swing
- +9.8pp toward D · 2008: 35.0pp · 2024: 44.9pp
- All cycles
- 2024: D+44.9 2020: D+46.4 2016: D+42.1 2012: D+29.6 2008: D+35.0
Not yet ingested
- Civics
- —
Market trends
- HPI YoY
- ▼ -95.32%
- Current HPI
- 321.4626
- Rent YoY
- ▲ 2.53%
- Metro
- Atlanta-Sandy Springs-Alpharetta, GA
- State GDP YoY
- ▲ 2.66%
- F500 in state
- 28
Industry mix (Fortune 500 HQ in GA)
| Industry | F500 HQs | Revenue |
|---|---|---|
| Paper / Packaging | 2 | $29B |
|
||
| Retail | 1 | $160B |
|
||
| Transportation / Logistics | 1 | $91B |
|
||
| Airlines | 1 | $62B |
|
||
| Consumer Goods | 1 | $47B |
|
||
| Utilities | 1 | $25B |
|
||
Price history
+283.5% since first listed3 events — show timeline
- 2026-05-29 Listed $164,900 GAMLS
- 2026-05-29 Listed $164,900 FMLS
- 1989-08-11 Sold (Public Records) $43,000 Public Records
Property tax history
-15.0%/yrLatest (2025): $11 · -54.8% YoY. Source: county tax records.
Cash-flow waterfall
monthlySold comps — $/sqft
last 12 mo · ≤1 miLoading sold comps…