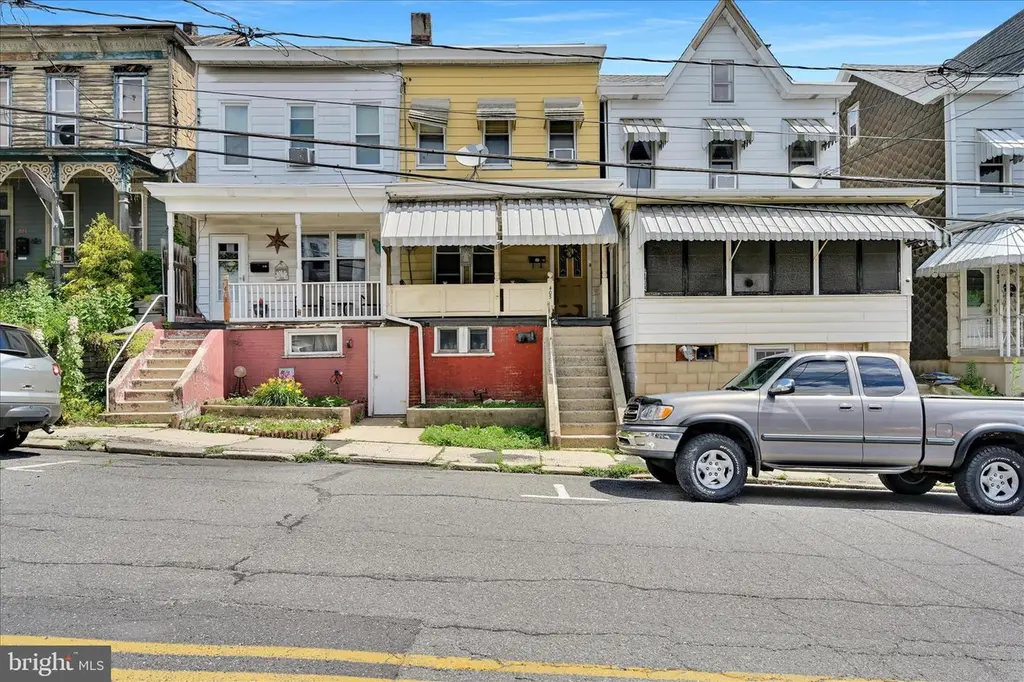
405 S Saint John St · Schuylkill Haven, PA
Flood risk 1/10 · Minimal
- FEMA flood zone
- X (unshaded)
- Chance of flooding over 30 yrs
- 0.0%
- Est. flood insurance / yr
- $473 – $860
Fire risk 1/10 · Minimal
- Est. fire insurance / yr
- $511 – $949
Heat risk 5/10 · Moderate
- Hot days now (above 97°F)
- 7 days/yr
- Hot days in 30 yrs
- 17 days/yr
Wind risk 4/10 · Minor
- Chance of severe wind over 30 yrs
- 8.0%
Air-quality risk 2/10 · Minimal
- Unhealthy air days now
- 1 days/yr
- Unhealthy air days in 30 yrs
- 2 days/yr
Risk factors via First Street. Map © Google.
Why this score? — see what drove the B+ grade
The composite is a weighted blend of 9 inputs, each scored 0–100. Each bar is that input's sub-score; the figure is the points it added to the 100-point composite (weight × sub-score).
- Cash flow +30.0/30.0
- ARV discount +15.0/15.0
- 1% rule +10.0/10.0
- DSCR +10.0/10.0
- Livability +4.0/5.0
- Schools +3.6/10.0
- Rent growth +2.5/5.0
- Condition / age +2.5/5.0
- Appreciation +0.0/10.0
$85,000
🖨 Deal sheet 📄 Offer letter ✓ Due diligence
Listing remarks
Move right into Schuylkill Haven or add a great property to your investment portfolio for just $85,000. This affordable three bedroom, one bath home is conveniently located on St. John Street within walking distance of downtown shops, restaurants, banks, the post office, local businesses, and the community park. Enjoy the charm and convenience of small town living with everyday necessities just a short walk from your front door. Whether you are a first time homebuyer, downsizing, or searching for your next investment opportunity, this property offers outstanding value in one of Schuylkill County's most desirable communities. Show anytime.
Key facts
- Community park
- Built 1920
- Listed 2 days
Tags
Property features AI
Exterior
- Parking: On-street parking
- Utilities: Public water; Public sewer
- Home design: Interior townhouse/rowhouse; Fee simple ownership; Year built estimated
- Construction: Aluminum siding; Block foundation
- Exterior features: Lot roughly 16 x 108 feet; Not in a federal flood zone
Interior
- Bedrooms: Three bedrooms on the first upper level
- Bathrooms: One full bathroom
- Heating & cooling: Baseboard hot water heating; Oil-fired heating; Electric hot water
- Interior features: Estimated living area; Full basement (approximately 80% footprint)
Neighborhood map
What this means for you Summary
Snapshot
- This is a 3-bed/1.0-bath townhouse listed at $85k.
Deal economics
- At list price, monthly cash flow is $372 ($4k/yr) — positive.
- The deal already cash-flows at list — no discount required.
- Meets the 1% rule at list price ($2k rent vs $85k).
Location & tenants
- Location reads 80/100 on livability (#197 in PA, #1,714 nationally) — a professional / high-income tenant draw. Strengths: crime A+, cost of living A+, housing A+; Watch: amenities C-, commute F, employment F.
- Schuylkill Haven Area SD (town): math 27% / reading 56% proficiency, ranked #330 of 539 in PA (top 61%) — families likely to look elsewhere, expect single-tenant / working-renter base with shorter leases.
- Zoned schools: Schuylkill Haven El Ctr (math 47% / reading 67%, grade C+, #444 of 1,518 statewide, top 32%, 434 students, 53% FRL); Schuylkill Haven Ms (math 15% / reading 52%, grade F, #342 of 512 statewide, top 67%, 260 students, 50% FRL); Schuylkill Haven Shs (math 32% / reading 52%, grade F, #232 of 437 statewide, top 57%, 445 students, 41% FRL) — zoned schools average 48% FRL vs 33% district-wide (15 pts higher); higher-poverty schools than district average — tighter screening recommended.
- Market conditions: 52 active listings in the ZIP; 1 comparable units currently listed for rent nearby; 169 units permitted in Schuylkill County in 2024 (0 in 5+ unit buildings).
Forward outlook
- Local home prices are declining (-3.0%/yr); year-one equity from $588 of loan paydown is wiped out by about $3k of value loss. Plan a longer hold.
- Schuylkill County population projected at -16% by 2050 — secular population decline; favor cash flow + early exit over multi-decade hold.
- At projected returns (-3.0% appreciation + 3.0% rent growth), your $24k cash investment doubles in ~7 years — after that, you're playing with house money.
Negotiation context
- Only 3 days on market — expect competitive offers; lowballing is unlikely to land.
Risks & watch-outs
- Watch-outs: property tax is 4.7% of price; built in 1920 — expect roof / HVAC / electrical / plumbing capex.
- Climate carrying-cost: extreme-heat days projected 7→17/yr by 2055 (HVAC capex compounding) — expect insurance premiums to compound above CPI over the hold.
Questions for the listing agent
- Built in 1920 — when were the roof, HVAC, electrical panel, plumbing, and water heater last replaced?
- Property tax is high relative to price — has the assessment been appealed recently, and will the sale trigger a re-assessment?
- Is there a deadline driving the sale (1031 exchange, divorce, estate, relocation)? That informs how much negotiation room exists.
- Schools are B-rated — typically a magnet for longer-tenancy family renters. What's the average tenant stay here, and is there a school-zone premium baked into asking?
- What's the average days-on-market for RENTAL listings here right now (not sales)? A rising rental-DOM trend means longer vacancies and softer asking-rent achievability than the comps imply.
- What's the recent tenant-quality profile in this submarket — average credit score on applications, eviction rate, late-payment / NSF rate, and stable-employment percentage? A property-management company in the area should have these aggregated.
- How much new for-sale + rental construction is in the pipeline within 1–3 miles? Heavy new supply typically softens prices + rents 12–24 months out; constrained supply supports both.
Investment metrics
- 1% rule
- 1.76% ✓
- Cap rate
- 11.54%
- Cash-on-cash
- 18.74%
- DSCR
- 1.83
- GRM
- 4.7
CMA / ARV
- ARV (on-the-fly)
- $146,160
- Comps found
- 12
Show comp detail 12 sales within ~0.75 mi
| Address | Dist | Beds/Ba | Sqft | Sold | Price | $/sf | Match |
|---|---|---|---|---|---|---|---|
| 209 Parkway | 0.14mi | 3/1.0 | 1,376 (-1%) | 19mo | $142,900 | $104 | 76 |
| 416 E Union St | 0.29mi | 3/1.5 | 1,328 (-5%) | 7mo | $163,000 | $123 | 71 |
| 36 S Saint Peter St | 0.22mi | 3/1.0 | 1,461 (+5%) | 13mo | $80,000 | $55 | 70 |
| 122 E Market St | 0.12mi | 3/2.0 | 1,450 (+4%) | 21mo | $155,000 | $107 | 66 |
| 131 S Margaretta St | 0.21mi | 4/1.0 (+1) | 1,357 (-2%) | 18mo | $128,000 | $94 | 66 |
| 137 S Margaretta St | 0.21mi | 3/1.5 | 1,548 (+11%) | 7mo | $170,000 | $110 | 64 |
| 118 Parkway | 0.19mi | 4/1.5 (+1) | 1,500 (+8%) | 19mo | $158,000 | $105 | 56 |
| 32 S Stanton St | 0.71mi | 3/1.0 | 1,278 (-8%) | 3mo | $110,000 | $86 | 51 |
| 27 Avenue A | 0.40mi | 2/1.5 (-1) | 1,455 (+4%) | 20mo | $144,900 | $100 | 50 |
| 113 N Berne St | 0.44mi | 3/1.0 | 1,292 (-7%) | 21mo | $146,000 | $113 | 50 |
| 203 Haven St | 0.55mi | 3/1.0 | 1,575 (+13%) | 5mo | $99,000 | $63 | 49 |
| 28 Stanton St | 0.71mi | 3/1.0 | 1,272 (-9%) | 18mo | $155,000 | $122 | 37 |
Match score weights: distance 35% · size 25% · config 20% · recency 20%. Top-matched comps best support the ARV.
Projected returns pro-forma
-3.0% appreciation · 3.0% rent growth · sell at horizon
- IRR
- 10.7%
- Equity multiple
- 1.42×
- Total profit
- $10,058
- Equity at exit
- $12,674
- IRR
- 19.8%
- Equity multiple
- 2.68×
- Total profit
- $39,894
- Equity at exit
- $7,349
Cash invested: $23,800 (down + closing). Projections, not guarantees.
Landlord ↔ Tenant lean methodology
- Overall (STATE)
- 62 Landlord-Friendly
- State Pennsylvania
- 62 Landlord-Friendly · EVEN
- County
- — inherits STATE
- City
- — inherits STATE
ZIP-level market 17972
- Home prices YoY
- -9.1%
- Active inventory
- 52
- Price-to-rent
- 4.7×
Monthly cashflow live
- Estimated rent
- $1,500 medium interval (Pro) →
- Mortgage (P&I)
- −$446
- Tax from tax record
- −$332 /mo · $3,986/yr
- Insurance
- −$35
- HOA
- −$0
- Vacancy / Maint / Mgmt
- −$315
- Net cashflow
- $372
Break-even live
UW: 25.0% down · 7.5% · 30yr · 1.5% tax · 5.0% vac · 8.0% maint · 8.0% mgmt
Financing live
Cash to close
- Down payment
- $21,250
- Closing costs
- $2,550
- Reserves months
- —
- Total cash needed
- —
Loan-product check · same deal, 3 products live
Conventional
25% down · 7.5% · 30yr
- Down + closing
- —
- Monthly P&I
- —
- Monthly cashflow
- —
- DSCR
- —
- Eligible?
- —
Personal DTI + credit; lowest rate.
DSCR
20% down · 8.5% · 30yr
- Down + closing
- —
- Monthly P&I
- —
- Monthly cashflow
- —
- DSCR
- —
- Eligible?
- —
No personal income docs; deal must DSCR.
Hard money
10% down · 12.0% · 12mo
- Down + closing
- —
- Monthly P&I
- —
- Monthly cashflow
- —
- DSCR
- —
- Eligible?
- —
Short-term bridge; refi at stabilization.
Rent comps 1 comps
| Address | Beds | Baths | Sqft | Rent | $/sqft | DOM | Units | Dist |
|---|---|---|---|---|---|---|---|---|
| 136 W Main St Schuylkill Haven, PA | 3.0 | 2.0 | 1400 | $1,500 | $1.07 | 43d | 1 | 0.27mi |
Listing history 5 events
-
2026-06-19days on market $85,000 Active 3 DOM
-
2026-06-18days on market $85,000 Active 2 DOM
-
2026-06-17status $85,000 Active 1 DOM
-
2026-06-17remarks 646-char remark
-
2026-06-17$85,000 Coming Soon 1 DOM
ⓘ Source: listings_history table (triggers on properties + properties_extension) + one-shot
backfill from property_details.listing_events for pre-trigger history.
Tax reassessment forecast PA · Partial reset (capped growth)
- Current annual tax
- $3,986 · $332/mo
- Projected year-2 tax
- $3,986 · $332/mo
- Expected delta
- $0/yr ($0/mo · 0.0%)
ⓘ Screening estimate from a state-policy table — verify with the county assessor before closing.
Climate risk First Street
- Flood 1/10 Low FEMA zone X (unshaded) · 0% chance over 30 yrs
- Wildfire 1/10 Low
- Heat 5/10 Major 7 d/yr ≥97°F today · 17 d/yr by 30 yrs out
- Wind 4/10 Moderate 8% chance of damaging wind over 30 yrs
- Air quality 2/10 Low 1 unhealthy d/yr today · 2 by 30 yrs out
Nearby sold comps map
Loading sold comps map…
Walkable amenities ~0.75 mi
Loading nearby amenities…
Taxation est. · year 1
- Rental income
- $18,000
- − Mortgage interest
- −$4,761
- − Property taxes
- −$3,986
- − Insurance
- −$425
- − Repairs & maintenance
- −$1,440
- − Management
- −$1,440
- − Depreciation
- −$2,473
- Taxable income
- $3,475
- Est. tax owed @ 24.0%
- −$834
- After-tax cash flow
- $3,626/yr
For passive investors: Depreciation is non-cash, so a rental often shows a tax loss while cash-flowing — sheltering income. Rental losses are passive: they offset passive income freely, and up to $25,000/yr can offset ordinary (W-2) income if you actively participate and your MAGI is under $100k (phasing out to $0 by $150k); unused losses carry forward. On sale, claimed depreciation is recaptured at up to 25%, and gains may owe capital-gains tax (a 1031 exchange can defer both). Figures are a year-1 estimate at your 24.0% rate — not tax advice; consult a CPA.
Schools (NCES district)
- District
- Schuylkill Haven Area SD
- NCES district ID
- 4220910
- Math proficiency
- 27% ▼ -15.00%
- Reading proficiency
- 56% ▼ -11.00%
- Median HH income
- $51,147
- Composite
- 35.73/100
- National rank
- #4857
- State rank
- #330 of 539 in PA
Livability — Schuylkill Haven
- Score
- 80/100
- State rank
- #197
- US rank
- #1714
Category grades
Schools grade is shown separately in the Schools card above.
Census & demographics
- Census place
- Schuylkill Haven, PA
- Population (ZIP)
- 11,294
Population outlook (Schuylkill County) Hauer SSP2
- Today (2025)
- 137,447 people
- By 2030
- 133,121 · -3.1%
- By 2040
- 124,172 · -9.7%
- By 2050
- 115,611 · -15.9%
- By 2075
- 100,796 · -26.7%
- By 2100
- 86,667 · -36.9%
Race, ethnicity, and origin ACS 2023
- Neighborhood character
- Predominantly White (92%)
- Race & ethnicity
- White 92% Two or more races 5% Hispanic / Latino 3% Asian 2%
- Common ancestry
- Romanian 5% Iranian 3% Lithuanian 3%
- Foreign-born
- 1%
- Languages at home
- 97% English-only · Spanish 1% German/W. Germanic 1% Other Asian/Pacific 1%
Political lean MEDSL · Schuylkill
- 2024 margin
- Solid R (+42.1) · D 28.5% · R 70.6%
- 2008→2024 swing
- -33.4pp toward R · 2008: -8.7pp · 2024: -42.1pp
- All cycles
- 2024: R+42.1 2020: R+39.9 2016: R+43.4 2012: R+13.4 2008: R+8.7
Not yet ingested
- Civics
- —
Market trends
- HPI YoY
- ▼ -21.14%
- Current HPI
- 212.0474
- Rent YoY
- —
- Metro
- —
- State GDP YoY
- ▲ 1.68%
- F500 in state
- 34
Industry mix (Fortune 500 HQ in PA)
| Industry | F500 HQs | Revenue |
|---|---|---|
| Healthcare | 2 | $309B |
|
||
| Insurance | 2 | $27B |
|
||
| Telecommunications / Media | 1 | $124B |
|
||
| Industrial Distribution | 1 | $22B |
|
||
| Financial Services | 1 | $20B |
|
||
| Chemicals / Materials | 1 | $18B |
|
||
Price history
+23.2% since first listed2 events — show timeline
- 2026-06-16 Price Changed $85,000 BRIGHT MLS
- 2026-06-16 Coming Soon $69,000 BRIGHT MLS
Property tax history
+11.8%/yrLatest (2026): $3,986 · +196.1% YoY. Source: county tax records.
Cash-flow waterfall
monthlySold comps — $/sqft
last 12 mo · ≤1 miLoading sold comps…