4281 Arcadia Dr · Stonecrest, GA
Flood risk No data
- FEMA flood zone
- —
- Chance of flooding over 30 yrs
- —
- Est. flood insurance / yr
- —
Fire risk No data
- Est. fire insurance / yr
- —
Heat risk No data
- Hot days now (above threshold)
- —
- Hot days in 30 yrs
- —
Wind risk No data
- Chance of severe wind over 30 yrs
- —
Air-quality risk No data
- Unhealthy air days now
- —
- Unhealthy air days in 30 yrs
- —
Risk factors via First Street. Map © Google.
Why this score? — see what drove the C+ grade
The composite is a weighted blend of 9 inputs, each scored 0–100. Each bar is that input's sub-score; the figure is the points it added to the 100-point composite (weight × sub-score).
- Cash flow +24.5/30.0
- ARV discount +15.0/15.0
- DSCR +7.9/10.0
- 1% rule +6.8/10.0
- Rent growth +3.0/5.0
- Livability +2.5/5.0
- Condition / age +2.2/5.0
- Schools +2.1/10.0
- Appreciation +0.0/10.0
$174,530
🖨 Deal sheet 📄 Offer letter ✓ Due diligence
Listing remarks MLS
Offers to be placed on Xome.com. Interior inspections are not available. Do not trespass! Forward all inquiries and questions to Xome Customer Service. NO REPRESENTATION TO VALIDITY OF INFORMATION IS MADE, BUYER TO VERIFY ALL INFORMATION WHERIN.
Key facts
- Built 2023
- Listed 126 days
Neighborhood map
What this means for you Summary
Snapshot
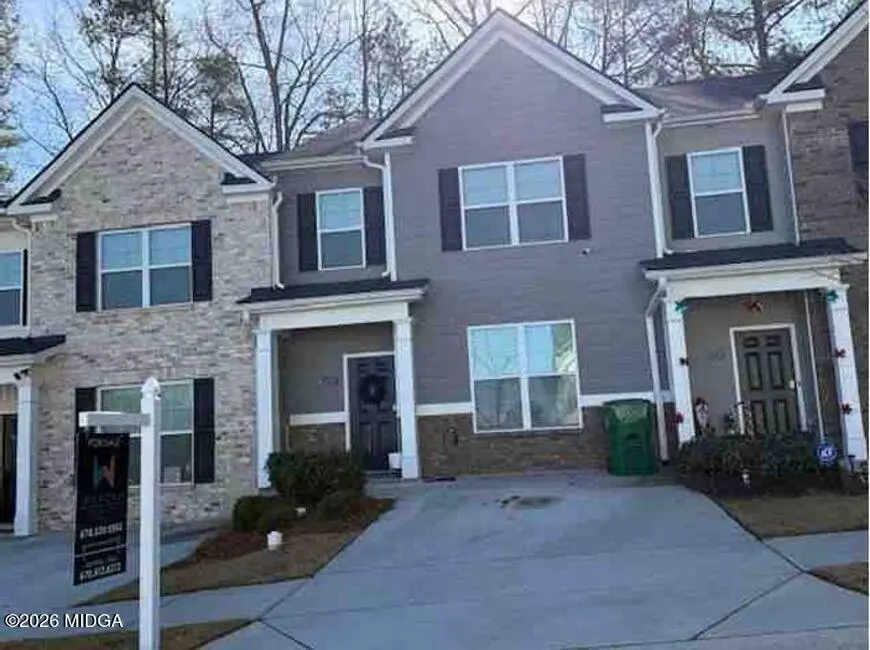
- This is a 3-bed/4.5-bath townhouse listed at $175k. Condition is rated fair.
Deal economics
- At list price, monthly cash flow is $358 ($4k/yr) — positive.
- The deal already cash-flows at list — no discount required.
- Meets the 1% rule at list price ($2k rent vs $175k).
- Recommended offer: $154k (12.0% below list) — sets the bar for market timing.
- Cap rate 8.8% vs local median 5.1% in Stonecrest — top-decile yield for the area; either an underpriced asset or a hidden risk that comps aren't pricing in. Stress-test before assuming the spread holds.
Location & tenants
- Location reads: area grade C — affects rentability + tenant quality, not the cash-flow math above.
- Dekalb County (suburban): math 19% / reading 28% proficiency, ranked #125 of 174 in GA (top 72%) — low school quality limits family demand, transient renter base, plan for 1-2y turnover; 68% free/reduced lunch — lower-income household profile, screen leases tightly.
- Market conditions: Rents rising (+2.2%/yr); 353 active listings in the ZIP; 30 comparable units currently listed for rent nearby; rentals lingering (median 44d on market — plan ~5-8 weeks vacancy on turnover, expect pricing pressure); 53% of comp listings sitting > 30 days — soft ceiling on asking rent; 1,240 units permitted in DeKalb County in 2024 (385 in 5+ unit buildings).
- This rent runs 39% of the median local income ($64k/yr) — at the standard rent-burdened threshold; future hikes will face affordability resistance.
Forward outlook
- Local home prices are declining (-3.0%/yr); year-one equity from $1k of loan paydown is wiped out by about $5k of value loss. Plan a longer hold.
- DeKalb County population projected at +28% by 2050 — long-run rental-demand tailwind backs the buy-and-hold thesis.
Negotiation context
- It's been on market 126 days — a 12% lower offer ($154k) is reasonable based on typical stale-listing flexibility.
- 2 sale attempts; this cycle's ask has dropped $28k (14%) from the opening price — seller is motivated, your offer sets the floor, not the list.
Questions for the listing agent
- It's been on market 126 days. Have you received any prior offers? Is the seller open to a 12% concession, seller financing, or rate buy-down credit?
- Have any recent inspections been done? Can we get a copy of the seller's disclosures and any deferred-maintenance estimates?
- Why hasn't it sold? Are there any deal-killer items the seller is aware of (foundation, flood, title, zoning, code violations)?
- Is there a deadline driving the sale (1031 exchange, divorce, estate, relocation)? That informs how much negotiation room exists.
- What's the average days-on-market for RENTAL listings here right now (not sales)? A rising rental-DOM trend means longer vacancies and softer asking-rent achievability than the comps imply.
- What's the recent tenant-quality profile in this submarket — average credit score on applications, eviction rate, late-payment / NSF rate, and stable-employment percentage? A property-management company in the area should have these aggregated.
- How much new for-sale + rental construction is in the pipeline within 1–3 miles? Heavy new supply typically softens prices + rents 12–24 months out; constrained supply supports both.
Investment metrics
- 1% rule
- 1.18% ✓
- Cap rate
- 8.75%
- Cash-on-cash
- 8.78%
- DSCR
- 1.39
- GRM
- 7.0
CMA / ARV
- ARV (median comp)
- $270,335
- List price
- $174,530
- Delta
- -35.44%
- Verdict
- UNDERPRICED
- Comps
- 20 within 1.0 mi
Show comp detail 12 sales within ~0.75 mi
| Address | Dist | Beds/Ba | Sqft | Sold | Price | $/sf | Match |
|---|---|---|---|---|---|---|---|
| 4282 Callum Ct | 0.10mi | 3/2.5 | 1,675 (0%) | 2mo | $232,000 | $139 | 85 |
| 4277 Arcadia Dr | 0.01mi | 3/2.5 | 1,611 (-4%) | 13mo | $281,850 | $175 | 74 |
| 4279 Arcadia Dr #2 | 0.00mi | 3/2.5 | 1,611 (-4%) | 18mo | $290,200 | $180 | 70 |
| 4288 Callum Ct | 0.10mi | 3/2.5 | 1,611 (-4%) | 15mo | $277,300 | $172 | 68 |
| 4284 Callum Ct | 0.10mi | 3/2.5 | 1,611 (-4%) | 17mo | $277,300 | $172 | 67 |
| 2631 Axel Rdg #40 | 0.05mi | 3/2.5 | 1,611 (-4%) | 20mo | $289,000 | $179 | 67 |
| 4292 Callum Ct | 0.11mi | 3/2.5 | 1,611 (-4%) | 17mo | $277,800 | $172 | 67 |
| 4290 Callum Ct | 0.10mi | 3/2.5 | 1,611 (-4%) | 17mo | $278,200 | $173 | 67 |
| 4294 Callum Ct | 0.11mi | 3/2.5 | 1,611 (-4%) | 17mo | $280,200 | $174 | 67 |
| 4278 Cullum Ct #39 | 0.10mi | 3/2.5 | 1,611 (-4%) | 20mo | $289,700 | $180 | 64 |
| 4280 Cullum Ct #38 | 0.10mi | 3/2.5 | 1,611 (-4%) | 21mo | $287,300 | $178 | 64 |
| 4532 Golf Vista Cir | 0.47mi | 3/2.5 | 1,500 (-10%) | 17mo | $105,000 | $70 | 38 |
Match score weights: distance 35% · size 25% · config 20% · recency 20%. Top-matched comps best support the ARV.
Projected returns pro-forma
-3.0% appreciation · 2.18% rent growth · sell at horizon
- IRR
- -3.9%
- Equity multiple
- 0.85×
- Total profit
- $-7,115
- Equity at exit
- $26,023
- IRR
- 4.8%
- Equity multiple
- 1.34×
- Total profit
- $16,615
- Equity at exit
- $15,090
Cash invested: $48,868 (down + closing). Projections, not guarantees.
Landlord ↔ Tenant lean methodology
- Overall (STATE)
- 90 Strongly Landlord-Friendly
- State Georgia
- 90 Strongly Landlord-Friendly · R+3
- County
- — inherits STATE
- City
- — inherits STATE
ZIP-level market 30034
- Home prices YoY
- -27.4%
- Rents YoY
- 2.2%
- Active inventory
- 353
- Price-to-rent
- 7.0×
Monthly cashflow live
- Estimated rent
- $2,066 high interval (Pro) →
- Mortgage (P&I)
- −$915
- Tax from tax record
- −$287 /mo · $3,441/yr
- Insurance
- −$73
- HOA
- −$0
- Vacancy / Maint / Mgmt
- −$434
- Net cashflow
- $358
Break-even live
UW: 25.0% down · 7.5% · 30yr · 1.5% tax · 5.0% vac · 8.0% maint · 8.0% mgmt
Financing live
Cash to close
- Down payment
- $43,632
- Closing costs
- $5,236
- Reserves months
- —
- Total cash needed
- —
Loan-product check · same deal, 3 products live
Conventional
25% down · 7.5% · 30yr
- Down + closing
- —
- Monthly P&I
- —
- Monthly cashflow
- —
- DSCR
- —
- Eligible?
- —
Personal DTI + credit; lowest rate.
DSCR
20% down · 8.5% · 30yr
- Down + closing
- —
- Monthly P&I
- —
- Monthly cashflow
- —
- DSCR
- —
- Eligible?
- —
No personal income docs; deal must DSCR.
Hard money
10% down · 12.0% · 12mo
- Down + closing
- —
- Monthly P&I
- —
- Monthly cashflow
- —
- DSCR
- —
- Eligible?
- —
Short-term bridge; refi at stabilization.
Rent comps 30 comps
| Address | Beds | Baths | Sqft | Rent | $/sqft | DOM | Units | Dist |
|---|---|---|---|---|---|---|---|---|
| 2692 Paxton PL #14 Decatur, GA | 3.0 | 2.5 | 1611 | $2,299 | $1.43 | 43d | 1 | 0.07mi |
| 4282 Callum Ct Decatur, GA | 3.0 | 2.5 | 1611 | $2,200 | $1.37 | 43d | 1 | 0.11mi |
| 4292 Callum Ct Decatur, GA | 3.0 | 2.5 | 1611 | $2,200 | $1.37 | 43d | 1 | 0.11mi |
| 4336 Pleasant Point Dr Decatur, GA | 1.0–3.0 | 1.0–2.0 | 1010 | $1,235 | $1.22 | 2d | 4 | 0.12mi |
| 4433 Golf Vista Cir Decatur, GA | 3.0 | 2.5 | 1495 | $1,350 | $0.90 | 24d | 1 | 0.36mi |
| 2564 Treadway Dr Decatur, GA | 3.0 | 2.0 | 1927 | $2,950 | $1.53 | 43d | 1 | 0.77mi |
| 4116 Snapfinger Way Decatur, GA | 4.0 | 2.0 | 1334 | $1,719 | $1.29 | 43d | 1 | 0.78mi |
| 4225 Wingfoot Ct Decatur, GA | 2.0 | 2.0 | 1120 | $1,600 | $1.43 | 24d | 1 | 0.79mi |
| 2347 Greenway Dr Decatur, GA | 3.0 | 2.0 | 1200 | $1,975 | $1.65 | 24d | 1 | 0.82mi |
| 2319 Wingfoot Pl Decatur, GA | 3.0 | 2.5 | 1840 | $1,800 | $0.98 | 43d | 1 | 0.82mi |
| 4707 Riverwood Cir Decatur, GA | 3.0 | 2.0 | 1826 | $1,850 | $1.01 | 24d | 1 | 0.84mi |
| 2937 Thompson Cir Decatur, GA | 3.0 | 2.0 | 1480 | $1,860 | $1.26 | 2d | 1 | 0.93mi |
| 4010 Emerald Lake Dr Decatur, GA | 2.0 | 2.0 | 1177 | $1,500 | $1.27 | 43d | 1 | 1.01mi |
| 2248 Emerald Springs Dr Decatur, GA | 3.0 | 2.0 | 1918 | $1,870 | $0.97 | 43d | 1 | 1.18mi |
| 3095 Riders Trl Decatur, GA | 3.0 | 2.0 | 1800 | $4,500 | $2.50 | 1d | 1 | 1.19mi |
| 4085 Canby Ln Decatur, GA | 4.0 | 2.0 | 1400 | $1,650 | $1.18 | 43d | 1 | 1.19mi |
| 4033 Emerald North Cir Decatur, GA | 4.0 | 2.5 | 2000 | $2,061 | $1.03 | 17d | 1 | 1.20mi |
| 2878 Snapfinger Mnr Decatur, GA | 3.0 | 2.5 | 1670 | $1,780 | $1.07 | 3d | 1 | 1.23mi |
| 4505 Dover Castle Dr Decatur, GA | 4.0 | 2.0 | 1532 | $1,923 | $1.26 | 43d | 1 | 1.25mi |
| 2559 Walden Lake Dr Unit 1 Decatur, GA | 3.0 | 2.5 | 1464 | $2,000 | $1.37 | 43d | 1 | 1.29mi |
| 2545 Walden Lake Dr Unit 1 Decatur, GA | 3.0 | 2.5 | 1464 | $2,000 | $1.37 | 43d | 1 | 1.32mi |
| 2569 Terrace Trl Decatur, GA | 3.0 | 3.0 | 1752 | $1,800 | $1.03 | 43d | 1 | 1.33mi |
| 2563 Terrace Trl Decatur, GA | 3.0 | 3.0 | 1752 | $1,950 | $1.11 | 12d | 1 | 1.33mi |
| 2525 Terrace Trl Unit 2525 Decatur, GA | 3.0 | 3.0 | 1593 | $1,850 | $1.16 | 12d | 1 | 1.34mi |
| 4111 Northstrand Dr Decatur, GA | 3.0 | 3.0 | 2173 | $2,031 | $0.93 | 12d | 1 | 1.35mi |
| 2481 Terrace Trl Decatur, GA | 3.0 | 3.0 | 1752 | $2,050 | $1.17 | 43d | 1 | 1.36mi |
| 2553 Terrace Trl Unit 2553 Decatur, GA | 3.0 | 2.0 | 1865 | $1,950 | $1.05 | 12d | 1 | 1.37mi |
| 4066 Marble Arch Ct Decatur, GA | 3.0 | 2.0 | 1344 | $1,800 | $1.34 | 43d | 1 | 1.39mi |
| 4908 Longview Walk Decatur, GA | 3.0 | 2.5 | 1480 | $2,000 | $1.35 | 43d | 1 | 1.45mi |
| 4917 Longview Walk Decatur, GA | 3.0 | 2.5 | 1486 | $2,000 | $1.35 | 20d | 1 | 1.47mi |
Listing history 18 events
-
2026-06-18days on market $174,530 Active 126 DOM
-
2026-06-17days on market $174,530 Active 125 DOM
-
2026-06-16days on market $174,530 Active 124 DOM
-
2026-06-15days on market $174,530 Active 123 DOM
-
2026-06-13days on market $174,530 Active 121 DOM
-
2026-06-09days on market $174,530 Active 117 DOM
-
2026-06-08days on market $174,530 Active 116 DOM
-
2026-06-07days on market $174,530 Active 115 DOM
-
2026-06-04days on market $174,530 Active 112 DOM
-
2026-06-03days on market $174,530 Active 111 DOM
-
2026-06-02days on market $174,530 Active 110 DOM
-
2026-06-01days on market $174,530 Active 109 DOM
-
2026-05-31days on market $174,530 Active 108 DOM
-
2026-04-16price $174,530 245-char remark
Show marketing remark (245 chars)
Offers to be placed on Xome.com. Interior inspections are not available. Do not trespass! Forward all inquiries and questions to Xome Customer Service. NO REPRESENTATION TO VALIDITY OF INFORMATION IS MADE, BUYER TO VERIFY ALL INFORMATION WHERIN.
-
2026-02-11$202,680 Active 245-char remark
Show marketing remark (245 chars)
Offers to be placed on Xome.com. Interior inspections are not available. Do not trespass! Forward all inquiries and questions to Xome Customer Service. NO REPRESENTATION TO VALIDITY OF INFORMATION IS MADE, BUYER TO VERIFY ALL INFORMATION WHERIN.
-
2026-02-11historical
Show marketing remark (245 chars)
Offers to be placed on Xome.com. Interior inspections are not available. Do not trespass! Forward all inquiries and questions to Xome Customer Service. NO REPRESENTATION TO VALIDITY OF INFORMATION IS MADE, BUYER TO VERIFY ALL INFORMATION WHERIN.
-
2026-01-07price $249,999
-
2025-10-10$265,000 New
ⓘ Source: listings_history table (triggers on properties + properties_extension) + one-shot
backfill from property_details.listing_events for pre-trigger history.
Tax reassessment forecast GA · Resets to sale price
- Current annual tax
- $3,441 · $287/mo
- Projected year-2 tax
- $3,441 · $287/mo
- Expected delta
- $0/yr ($0/mo · 0.0%)
ⓘ Screening estimate from a state-policy table — verify with the county assessor before closing.
Nearby sold comps map
Loading sold comps map…
Walkable amenities ~0.75 mi
Loading nearby amenities…
Taxation est. · year 1
- Rental income
- $24,797
- − Mortgage interest
- −$9,776
- − Property taxes
- −$3,441
- − Insurance
- −$873
- − Repairs & maintenance
- −$1,984
- − Management
- −$1,984
- − Depreciation
- −$5,077
- Taxable income
- $1,662
- Est. tax owed @ 24.0%
- −$399
- After-tax cash flow
- $3,894/yr
For passive investors: Depreciation is non-cash, so a rental often shows a tax loss while cash-flowing — sheltering income. Rental losses are passive: they offset passive income freely, and up to $25,000/yr can offset ordinary (W-2) income if you actively participate and your MAGI is under $100k (phasing out to $0 by $150k); unused losses carry forward. On sale, claimed depreciation is recaptured at up to 25%, and gains may owe capital-gains tax (a 1031 exchange can defer both). Figures are a year-1 estimate at your 24.0% rate — not tax advice; consult a CPA.
Condition & rehab AI · 2 photos
The property presents as a well-maintained townhouse with average exterior and interior conditions. Minor repairs and updates to landscaping and interior paint would significantly enhance its value.
Repairs flagged
- Minor Landscaping — The landscaping could benefit from some trimming and maintenance.
- Minor Fencing — The fencing could benefit from some touch-up painting or repair to maintain its appearance.
- Minor Interior paint — The interior paint appears to be in good condition, but touch-ups may be needed for a fresh look.
Value-add opportunities
- Both Landscaping — A well-maintained landscape can enhance curb appeal and property value.
- Both Interior paint — Fresh paint can improve the home's appearance and make it more appealing to potential buyers or renters.
Renovation cost estimate screening
| Repair item | Severity | Est. cost |
|---|---|---|
| Landscaping · The landscaping could benefit from some trimming and maintenance. | Minor | $500–3,000 |
| Fencing · The fencing could benefit from some touch-up painting or repair to maintain its appearance. | Minor | $500–3,000 |
| Interior paint · The interior paint appears to be in good condition, but touch-ups may be needed for a fresh look. | Minor | $500–3,000 |
| Total estimated repair cost · 3 items | $1,500–9,000 |
Value-add ROI direction
- Both Landscaping — A well-maintained landscape can enhance curb appeal and property value. ↑
- Both Interior paint — Fresh paint can improve the home's appearance and make it more appealing to potential buyers or renters. ↑
ⓘ Cost ranges are severity-bucket heuristics (US national rule-of-thumb). Get contractor quotes + a written scope before underwriting a rehab budget.
Schools (NCES district)
- District
- Dekalb County
- NCES district ID
- 1301740
- Math proficiency
- 19% ▼ -12.00%
- Reading proficiency
- 28% ▼ -7.00%
- Median HH income
- $51,448
- Composite
- 20.92/100
- National rank
- #8482
- State rank
- #125 of 174 in GA
Livability — Stonecrest
No livability data for this city. (Only ~50 U.S. cities are tracked.)
Census & demographics
- County
- Dekalb County · 782,738 people
- Metro
- Atlanta-Sandy Springs-Alpharetta, GA
- Population (ZIP)
- 41,847
- Household income
- $63,517
- Rent vs Own
- Severe rent burden
- 1659.0
Population outlook (DeKalb County) Hauer SSP2
- Today (2025)
- 839,977 people
- By 2030
- 891,768 · +6.2%
- By 2040
- 988,894 · +17.7%
- By 2050
- 1,074,583 · +27.9%
- By 2075
- 1,245,026 · +48.2%
- By 2100
- 1,303,135 · +55.1%
Race, ethnicity, and origin ACS 2023
- Neighborhood character
- Predominantly Black (90%)
- Race & ethnicity
- Black 90% White 4% Two or more races 3% Hispanic / Latino 2%
- Common ancestry
- Hispanic 1% Lithuanian 1%
- Foreign-born
- 8% · Canada
- Languages at home
- 93% English-only · Spanish 2% French/Haitian/Cajun 1%
Political lean MEDSL · DeKalb
- 2024 margin
- Solid D (+64.8) · D 81.9% · R 17.1% · Other 1.0%
- 2008→2024 swing
- +6.1pp toward D · 2008: 58.6pp · 2024: 64.8pp
- All cycles
- 2024: D+64.8 2020: D+67.4 2016: D+64.8 2012: D+56.8 2008: D+58.6
Not yet ingested
- Civics
- —
Market trends
- HPI YoY
- ▼ -78.92%
- Current HPI
- 209.5638
- Rent YoY
- ▲ 2.18%
- Metro
- Atlanta-Sandy Springs-Alpharetta, GA
- State GDP YoY
- ▲ 2.66%
- F500 in state
- 28
Industry mix (Fortune 500 HQ in GA)
| Industry | F500 HQs | Revenue |
|---|---|---|
| Paper / Packaging | 2 | $29B |
|
||
| Retail | 1 | $160B |
|
||
| Transportation / Logistics | 1 | $91B |
|
||
| Airlines | 1 | $62B |
|
||
| Consumer Goods | 1 | $47B |
|
||
| Utilities | 1 | $25B |
|
||
Price history
-34.1% since first listed5 events — show timeline
- 2026-04-16 Price Changed $174,530 MGMLS
- 2026-02-11 Listing Removed — GAMLS
- 2026-02-11 Listed $202,680 MGMLS
- 2026-01-07 Price Changed $249,999 GAMLS
- 2025-10-10 Listed $265,000 GAMLS
Property tax history
+77.3%/yrLatest (2025): $3,441 · +2.2% YoY. Source: county tax records.
Cash-flow waterfall
monthlySold comps — $/sqft
last 12 mo · ≤1 miLoading sold comps…