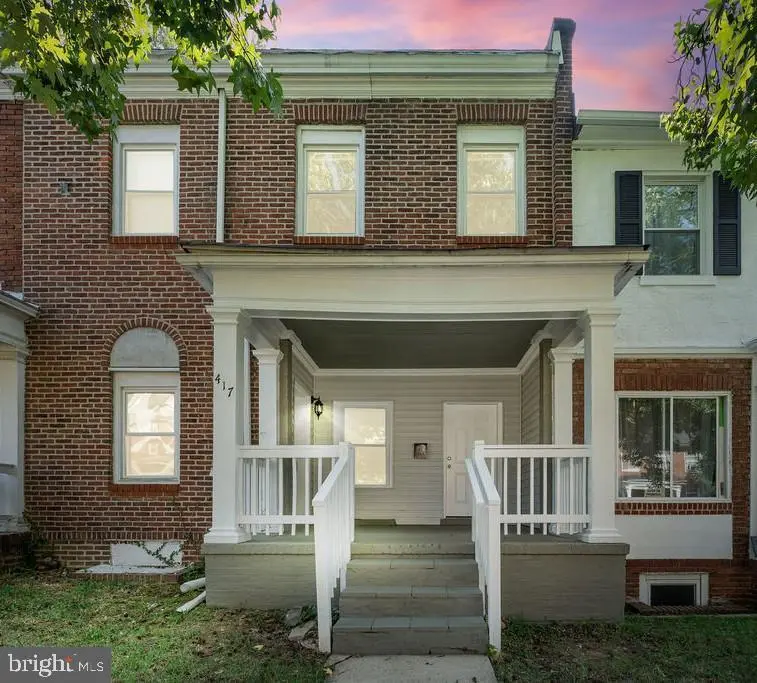
417 Rosecroft Ter · Baltimore, MD
Flood risk 1/10 · Minimal
- FEMA flood zone
- X (unshaded)
- Chance of flooding over 30 yrs
- 0.0%
- Est. flood insurance / yr
- $473 – $860
Fire risk 1/10 · Minimal
- Est. fire insurance / yr
- $755 – $1,403
Heat risk 7/10 · Major
- Hot days now (above 103°F)
- 7 days/yr
- Hot days in 30 yrs
- 15 days/yr
Wind risk 5/10 · Moderate
- Chance of severe wind over 30 yrs
- 24.0%
Air-quality risk 3/10 · Minor
- Unhealthy air days now
- 3 days/yr
- Unhealthy air days in 30 yrs
- 4 days/yr
Risk factors via First Street. Map © Google.
Why this score? — see what drove the B+ grade
The composite is a weighted blend of 9 inputs, each scored 0–100. Each bar is that input's sub-score; the figure is the points it added to the 100-point composite (weight × sub-score).
- Cash flow +30.0/30.0
- ARV discount +15.0/15.0
- DSCR +10.0/10.0
- 1% rule +9.4/10.0
- Rent growth +3.8/5.0
- Livability +3.8/5.0
- Condition / age +2.5/5.0
- Schools +1.0/10.0
- Appreciation +0.0/10.0
$146,000
🖨 Deal sheet 📄 Offer letter ✓ Due diligence
Listing remarks MLS
Welcome to 417 Rosecroft Terrace! This Beautiful spacious row house is on a quiet residential street with 1 Car Parking Pad in the back. With new floors and a fresh coat of paint, this home is move in ready. It has a Large Living and Dining room to allow for entertaining This home boasts 4 bedrooms upstairs with 1 updated bathroom. It has additional SPACE in the unfinished basement. Check the comps on the street. You could purchase this house and get instant equity. Contact me today to submit your offer! Close to shopping, recreation centers, and restaurants. Neighborhood highlights: - 5 minute drive to Wilkens Avenue (shopping center, hospital, restaurants) - 6 minute drive to Giant Food - 7 minute drive to Loudon Park - 3.5 miles from UMBC - 15 minute walk to UMBC shuttle (Paradise Route) - 5 minute Walk to CityLink Purple Line Bus
Key facts
- 2 parking spots
- Built 1924
Property features AI
Finance
- Other: Pets allowed with no pet restrictions
Exterior
- Parking: Two total parking spaces; Two off-street spaces
- Utilities: Public water; No septic system (public sewer); Natural gas heating and hot water
- Home design: Interior townhouse/rowhouse; Building not winterized; Below average condition; Fee simple ownership; Ground rent paid annually
- Construction: Brick construction; Flat roof; Concrete perimeter foundation; Above-grade finished living space per assessor
- Exterior features: Concrete driveway; On-street and off-street parking available; Not in a federal flood zone; Tidal water: none
Interior
- Bedrooms: Four bedrooms on the main level
- Bathrooms: One full bathroom on the main level
- Heating & cooling: Forced air heating; Natural gas hot water
- Interior features: Unfinished basement; Living area per assessor
Neighborhood map
What this means for you Summary
Snapshot
- This is a 4-bed/1.5-bath townhouse listed at $146k.
Deal economics
- At list price, monthly cash flow is $603 ($7k/yr) — positive.
- The deal already cash-flows at list — no discount required.
- Meets the 1% rule at list price ($2k rent vs $146k).
- Cap rate 11.2% vs local median 6.0% in Baltimore — top-decile yield for the area; either an underpriced asset or a hidden risk that comps aren't pricing in. Stress-test before assuming the spread holds.
Location & tenants
- Location reads 76/100 on livability (#90 in MD, #3,396 nationally) — a middle-class / working-renter tenant base. Strengths: amenities A+, commute A+, housing A+; Watch: schools D, crime F.
- Baltimore City Public Schools (urban): math 7% / reading 16% proficiency, ranked #24 of 24 in MD (top 100%) — low school quality limits family demand, transient renter base, plan for 1-2y turnover; 79% free/reduced lunch — lower-income household profile, screen leases tightly.
- Market conditions: Rents rising fast (+5.4%/yr); 252 active listings in the ZIP; 34 comparable units currently listed for rent nearby; rentals at typical pace (median 24d on market — plan ~3-4 weeks tenant-placement turnaround); 1,273 units permitted in Baltimore city in 2024 (1,104 in 5+ unit buildings).
- This rent runs 42% of the median local income ($60k/yr) — at the standard rent-burdened threshold; future hikes will face affordability resistance.
Forward outlook
- Local home prices are declining (-3.0%/yr); year-one equity from $1k of loan paydown is wiped out by about $4k of value loss. Plan a longer hold.
- Baltimore County population projected to shrink 4% by 2050 — rents likely to lag national; underwrite the cash flow, not the appreciation.
- At projected returns (-3.0% appreciation + 5.4% rent growth), your $41k cash investment doubles in ~6 years — after that, you're playing with house money.
Negotiation context
- Only 1 days on market — expect competitive offers; lowballing is unlikely to land.
- 3 sale attempts since 7y ago; this cycle's ask has dropped $52k (26%) from the opening price — seller is motivated, your offer sets the floor, not the list.
Risks & watch-outs
- Watch-outs: built in 1924 — expect roof / HVAC / electrical / plumbing capex.
- Climate carrying-cost: moderate wind risk, 24% chance of damaging wind over 30y; extreme-heat days projected 7→15/yr by 2055 (HVAC capex compounding) — expect insurance premiums to compound above CPI over the hold.
Questions for the listing agent
- Built in 1924 — when were the roof, HVAC, electrical panel, plumbing, and water heater last replaced?
- Is there a deadline driving the sale (1031 exchange, divorce, estate, relocation)? That informs how much negotiation room exists.
- Schools are D-rated, which usually means shorter tenancies and higher turnover. Who's the typical renter profile here, and what's been the actual vacancy rate?
- Crime grade is F in this area — have there been break-ins, vandalism, or insurance claims at this property in the last 3 years? What carrier currently insures it and at what premium?
- What's the average days-on-market for RENTAL listings here right now (not sales)? A rising rental-DOM trend means longer vacancies and softer asking-rent achievability than the comps imply.
- What's the recent tenant-quality profile in this submarket — average credit score on applications, eviction rate, late-payment / NSF rate, and stable-employment percentage? A property-management company in the area should have these aggregated.
- How much new for-sale + rental construction is in the pipeline within 1–3 miles? Heavy new supply typically softens prices + rents 12–24 months out; constrained supply supports both.
Investment metrics
- 1% rule
- 1.44% ✓
- Cap rate
- 11.25%
- Cash-on-cash
- 17.70%
- DSCR
- 1.79
- GRM
- 5.8
CMA / ARV
- ARV (on-the-fly)
- $210,240
- Comps found
- 12
Show comp detail 12 sales within ~0.75 mi
| Address | Dist | Beds/Ba | Sqft | Sold | Price | $/sf | Match |
|---|---|---|---|---|---|---|---|
| 4231 Euclid Ave | 0.30mi | 3/1.0 (-1) | 1,856 (+6%) | 1mo | $90,100 | $49 | 69 |
| 4404 Frederick Ave | 0.38mi | 4/2.0 | 1,880 (+7%) | 5mo | $240,000 | $128 | 64 |
| 428 S Augusta Ave | 0.13mi | 4/2.5 | 1,500 (-14%) | 3mo | $249,900 | $167 | 64 |
| 3804 Old Frederick Rd | 0.36mi | 5/2.5 (+1) | 1,872 (+7%) | 1mo | $250,000 | $134 | 62 |
| 3356 Wilkens Ave | 0.63mi | 4/1.0 | 1,688 (-4%) | 2mo | $96,000 | $57 | 61 |
| 210 S Augusta Ave | 0.27mi | 3/2.0 (-1) | 1,580 (-10%) | 6mo | $170,000 | $108 | 58 |
| 24 S Tremont Rd | 0.72mi | 4/2.0 | 1,800 (+3%) | 5mo | $220,000 | $122 | 55 |
| 46 Cobber Ln | 0.59mi | 3/2.5 (-1) | 1,683 (-4%) | 4mo | $245,000 | $146 | 54 |
| 631 S Beechfield Ave S | 0.72mi | 3/1.5 (-1) | 1,705 (-3%) | 8mo | $185,000 | $109 | 50 |
| 4626 Frederick Ave | 0.58mi | 3/2.0 (-1) | 1,568 (-10%) | 2mo | $165,000 | $105 | 47 |
| 755 S Woodington Rd | 0.58mi | 4/1.5 | 1,542 (-12%) | 7mo | $185,000 | $120 | 47 |
| 123 S Monastery Ave | 0.43mi | 3/2.0 (-1) | 1,512 (-14%) | 6mo | $68,000 | $45 | 46 |
Match score weights: distance 35% · size 25% · config 20% · recency 20%. Top-matched comps best support the ARV.
Projected returns pro-forma
-3.0% appreciation · 5.38% rent growth · sell at horizon
- IRR
- 11.9%
- Equity multiple
- 1.49×
- Total profit
- $19,969
- Equity at exit
- $21,769
- IRR
- 22.8%
- Equity multiple
- 3.19×
- Total profit
- $89,359
- Equity at exit
- $12,623
Cash invested: $40,880 (down + closing). Projections, not guarantees.
Landlord ↔ Tenant lean methodology
- Overall (CITY)
- 12 Strongly Tenant-Friendly
- State Maryland
- 27 Tenant-Leaning · D+14
- County
- — inherits STATE
- City Baltimore
- 12 Strongly Tenant-Friendly · D+58
ZIP-level market 21229
- Rents YoY
- 5.4%
- Active inventory
- 252
- Price-to-rent
- 5.8×
Monthly cashflow live
- Estimated rent
- $2,108 high interval (Pro) →
- Mortgage (P&I)
- −$766
- Tax from tax record
- −$236 /mo · $2,835/yr
- Insurance
- −$61
- HOA
- −$0
- Vacancy / Maint / Mgmt
- −$443
- Net cashflow
- $603
Break-even live
UW: 25.0% down · 7.5% · 30yr · 1.5% tax · 5.0% vac · 8.0% maint · 8.0% mgmt
Financing live
Cash to close
- Down payment
- $36,500
- Closing costs
- $4,380
- Reserves months
- —
- Total cash needed
- —
Loan-product check · same deal, 3 products live
Conventional
25% down · 7.5% · 30yr
- Down + closing
- —
- Monthly P&I
- —
- Monthly cashflow
- —
- DSCR
- —
- Eligible?
- —
Personal DTI + credit; lowest rate.
DSCR
20% down · 8.5% · 30yr
- Down + closing
- —
- Monthly P&I
- —
- Monthly cashflow
- —
- DSCR
- —
- Eligible?
- —
No personal income docs; deal must DSCR.
Hard money
10% down · 12.0% · 12mo
- Down + closing
- —
- Monthly P&I
- —
- Monthly cashflow
- —
- DSCR
- —
- Eligible?
- —
Short-term bridge; refi at stabilization.
Rent comps 34 comps
| Address | Beds | Baths | Sqft | Rent | $/sqft | DOM | Units | Dist |
|---|---|---|---|---|---|---|---|---|
| 212 S Loudon Ave Baltimore, MD | 3.0 | 1.5 | 1310 | $1,550 | $1.18 | 44d | 1 | 0.29mi |
| 117 Collins Ave Baltimore, MD | 3.0 | 3.0 | 1617 | $2,350 | $1.45 | 44d | 1 | 0.39mi |
| 500 Lucia Ave Baltimore, MD | 3.0 | 2.0 | 1472 | $2,100 | $1.43 | 16d | 1 | 0.57mi |
| 3336 W Caton Ave Baltimore, MD | 3.0 | 2.0 | 1236 | $1,625 | $1.31 | 24d | 1 | 0.68mi |
| 19 S Tremont Rd Baltimore, MD | 3.0 | 1.0 | 1350 | $1,850 | $1.37 | 44d | 1 | 0.73mi |
| 2 S Tremont Rd Baltimore, MD | 3.0 | 2.0 | 1450 | $1,800 | $1.24 | 24d | 1 | 0.77mi |
| 2 S Tremont Rd Baltimore, MD | 3.0 | 2.0 | 1450 | $1,800 | $1.24 | 11d | 1 | 0.77mi |
| 202 N Edgewood St Baltimore, MD | 3.0 | 2.0 | 1710 | $2,250 | $1.32 | 24d | 1 | 0.85mi |
| 409 Normandy Ave Baltimore, MD | 4.0 | 1.0 | 1640 | $1,500 | $0.91 | 24d | 1 | 0.90mi |
| 405 N Edgewood St Baltimore, MD | 4.0 | 2.0 | 1408 | $2,950 | $2.10 | 4d | 1 | 0.97mi |
| 670 Queensgate Rd Baltimore, MD | 3.0 | 2.0 | 1600 | $2,100 | $1.31 | 4d | 1 | 0.99mi |
| 3619 Edmondson Ave Baltimore, MD | 4.0 | 3.5 | 1962 | $2,800 | $1.43 | 44d | 1 | 1.04mi |
| 3507 Edmondson Ave Baltimore, MD | 4.0 | 2.0 | 1428 | $2,300 | $1.61 | 44d | 1 | 1.07mi |
| 623 N Grantley St Baltimore, MD | 4.0 | 2.0 | 1250 | $2,000 | $1.60 | 24d | 1 | 1.14mi |
| 3324 Edmondson Ave Baltimore, MD | 3.0 | 2.5 | 2300 | $1,995 | $0.87 | 22d | 1 | 1.15mi |
| 4020 Gelston Dr Baltimore, MD | 3.0 | 2.0 | 1270 | $1,875 | $1.48 | 44d | 1 | 1.16mi |
| 3712 Gelston Dr Baltimore, MD | 3.0 | 2.0 | 1250 | $2,500 | $2.00 | 24d | 1 | 1.17mi |
| 2737 Wilkens Ave Baltimore, MD | 3.0 | 1.5 | 1232 | $1,650 | $1.34 | 4d | 1 | 1.20mi |
| 730 Linnard St Unit 1 Baltimore, MD | 4.0 | 1.0 | 1360 | $1,750 | $1.29 | 24d | 1 | 1.22mi |
| 3700 Woodridge Rd Baltimore, MD | 3.0 | 1.5 | 1955 | $1,950 | $1.00 | 44d | 1 | 1.28mi |
| 941 Brunswick St Baltimore, MD | 3.0 | 1.5 | 1516 | $1,650 | $1.09 | 18d | 1 | 1.31mi |
| 941 Brunswick St Baltimore, MD | 3.0 | 1.5 | 1558 | $1,600 | $1.03 | 44d | 1 | 1.31mi |
| 798 N Grantley St Baltimore, MD | 3.0 | 2.0 | 1360 | $2,295 | $1.69 | 24d | 1 | 1.33mi |
| 4610 College Ave Baltimore, MD | 4.0 | 2.0 | 1440 | $2,200 | $1.53 | 18d | 1 | 1.34mi |
| 4630 Warren Tree Way Baltimore, MD | 3.0 | 1.5 | 1736 | $2,500 | $1.44 | 5d | 1 | 1.38mi |
| 2922 Edmondson Ave Baltimore, MD | 3.0 | 2.0 | 1620 | $1,900 | $1.17 | 44d | 1 | 1.39mi |
| 715 N Rosedale St Baltimore, MD | 5.0 | 3.0 | 1542 | $2,550 | $1.65 | 44d | 1 | 1.41mi |
| 21 Holland Hill Ct Catonsville, MD | 4.0 | 1.5 | 1320 | $2,200 | $1.67 | 44d | 1 | 1.42mi |
| 2509 Christian St Baltimore, MD | 4.0 | 2.0 | 1248 | $1,699 | $1.36 | 4d | 1 | 1.44mi |
| 2514 Wilkens Ave Baltimore, MD | 4.0 | 1.0 | 1344 | $1,800 | $1.34 | 11d | 1 | 1.46mi |
| 2514 Wilkens Ave Baltimore, MD | 4.0 | 1.0 | 1344 | $1,800 | $1.34 | 44d | 1 | 1.46mi |
| 24 Laurence Brooke Rd Catonsville, MD | 4.0 | 3.5 | 1980 | $2,800 | $1.41 | 3d | 1 | 1.47mi |
| 24 Laurence Brooke Rd Catonsville, MD | 4.0 | 3.0 | 1440 | $2,800 | $1.94 | 13d | 1 | 1.47mi |
| 4113 Mountwood Rd Baltimore, MD | 3.0 | 1.0 | 1520 | $1,795 | $1.18 | 44d | 1 | 1.50mi |
Listing history 7 events
-
2026-06-19statusdays on market $146,000 Active 1 DOM
-
2026-06-18days on market $146,000 Coming Soon 10 DOM
-
2026-06-17days on market $146,000 Coming Soon 9 DOM
-
2026-06-16days on market $146,000 Coming Soon 8 DOM
-
2026-06-15days on market $146,000 Coming Soon 7 DOM
-
2026-06-13pricedays on market $146,000 Coming Soon 5 DOM
-
2026-06-09$165,000 Coming Soon 1 DOM
ⓘ Source: listings_history table (triggers on properties + properties_extension) + one-shot
backfill from property_details.listing_events for pre-trigger history.
Tax reassessment forecast MD · Partial reset (capped growth)
- Current annual tax
- $2,835 · $236/mo
- Projected year-2 tax
- $2,835 · $236/mo
- Expected delta
- $0/yr ($0/mo · 0.0%)
ⓘ Screening estimate from a state-policy table — verify with the county assessor before closing.
Climate risk First Street
- Flood 1/10 Low FEMA zone X (unshaded) · 0% chance over 30 yrs
- Wildfire 1/10 Low
- Heat 7/10 Severe 7 d/yr ≥103°F today · 15 d/yr by 30 yrs out
- Wind 5/10 Major 24% chance of damaging wind over 30 yrs
- Air quality 3/10 Moderate 3 unhealthy d/yr today · 4 by 30 yrs out
Nearby sold comps map
Loading sold comps map…
Walkable amenities ~0.75 mi
Loading nearby amenities…
Taxation est. · year 1
- Rental income
- $25,299
- − Mortgage interest
- −$8,178
- − Property taxes
- −$2,835
- − Insurance
- −$730
- − Repairs & maintenance
- −$2,024
- − Management
- −$2,024
- − Depreciation
- −$4,247
- Taxable income
- $5,261
- Est. tax owed @ 24.0%
- −$1,263
- After-tax cash flow
- $5,971/yr
For passive investors: Depreciation is non-cash, so a rental often shows a tax loss while cash-flowing — sheltering income. Rental losses are passive: they offset passive income freely, and up to $25,000/yr can offset ordinary (W-2) income if you actively participate and your MAGI is under $100k (phasing out to $0 by $150k); unused losses carry forward. On sale, claimed depreciation is recaptured at up to 25%, and gains may owe capital-gains tax (a 1031 exchange can defer both). Figures are a year-1 estimate at your 24.0% rate — not tax advice; consult a CPA.
Schools (NCES district)
- District
- Baltimore City Public Schools
- NCES district ID
- 2400090
- Math proficiency
- 7% ▼ -9.00%
- Reading proficiency
- 16% ▼ -5.00%
- Median HH income
- $42,108
- Composite
- 10.08/100
- National rank
- #9805
- State rank
- #24 of 24 in MD
Livability — Baltimore
- Score
- 76/100
- State rank
- #90
- US rank
- #3396
Category grades
Schools grade is shown separately in the Schools card above.
Census & demographics
- Census place
- Baltimore, MD
- County
- Baltimore City · 558,601 people
- City population
- 588,727
- Metro
- Baltimore-Columbia-Towson, MD
- Population (ZIP)
- 46,679
- Household income
- $60,047
- Rent vs Own
- Severe rent burden
- 2776.0
Population outlook (Baltimore County) Hauer SSP2
- Today (2025)
- 624,249 people
- By 2030
- 621,541 · -0.4%
- By 2040
- 609,756 · -2.3%
- By 2050
- 597,249 · -4.3%
- By 2075
- 552,236 · -11.5%
- By 2100
- 513,934 · -17.7%
Race, ethnicity, and origin ACS 2023
- Neighborhood character
- Predominantly Black (73%)
- Race & ethnicity
- Black 73% White 15% Hispanic / Latino 6% Two or more races 4% Asian 3%
- Hispanic origin (detail)
- Common ancestry
- Lithuanian 1% Romanian 1% Serbian 1%
- Foreign-born
- 5% · Canada, Philippines
- Languages at home
- 91% English-only · Spanish 4% Other Indo-European 2% Other Asian/Pacific 1%
Political lean MEDSL · Baltimore
- 2024 margin
- Solid D (+73.0) · D 85.2% · R 12.2% · Other 2.6%
- 2008→2024 swing
- -2.5pp toward R · 2008: 75.5pp · 2024: 73.0pp
- All cycles
- 2024: D+73.0 2020: D+76.6 2016: D+74.6 2012: D+76.4 2008: D+75.5
Not yet ingested
- Civics
- —
Market trends
- HPI YoY
- ▼ -259.07%
- Current HPI
- 226.896
- Rent YoY
- ▲ 5.38%
- Metro
- Baltimore-Columbia-Towson, MD
- State GDP YoY
- ▲ 2.97%
- F500 in state
- 12
Industry mix (Fortune 500 HQ in MD)
| Industry | F500 HQs | Revenue |
|---|---|---|
| Aerospace / Defense | 1 | $71B |
|
||
| Utilities | 1 | $25B |
|
||
| Hotels | 1 | $24B |
|
||
| Consumer Goods | 1 | $7B |
|
||
| Real Estate | 1 | $6B |
|
||
| Chemicals | 1 | $2B |
|
||
Price history
+725.0% since first listed14 events — show timeline
- 2026-06-09 Coming Soon $165,000 BRIGHT MLS
- 2025-01-03 Sold (MLS) $180,000 BRIGHT MLS
- 2024-11-06 Contingent — BRIGHT MLS
- 2024-10-15 Price Changed $180,000 BRIGHT MLS
- 2024-10-15 Relisted — BRIGHT MLS
- 2024-10-02 Listing Removed — BRIGHT MLS
- 2024-08-30 Price Changed $189,900 BRIGHT MLS
- 2024-07-09 Price Changed $192,500 BRIGHT MLS
- 2024-06-18 Listed $198,500 BRIGHT MLS
- 2019-11-21 Sold (Public Records) $70,000 Public Records
- 2019-09-11 Listing Removed — BRIGHT MLS
- 2019-08-27 Sold (MLS) $59,000 BRIGHT MLS
- 2019-03-13 Pending — BRIGHT MLS
- 2019-01-23 Listed $20,000 BRIGHT MLS
Property tax history
+2.7%/yrLatest (2025): $2,835 · +11.4% YoY. Source: county tax records.
Cash-flow waterfall
monthlySold comps — $/sqft
last 12 mo · ≤1 miLoading sold comps…