 Duplex
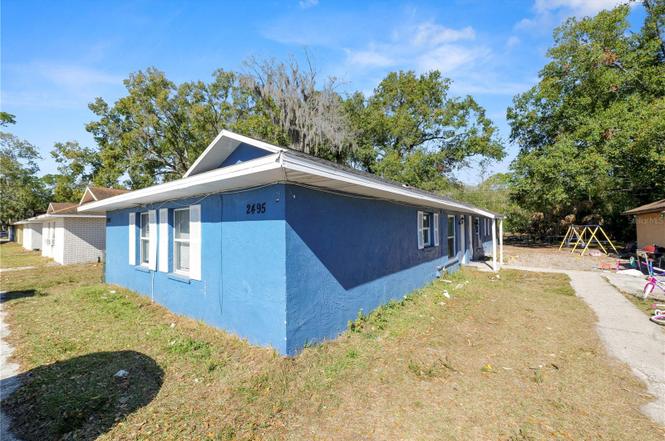
2493 Chestnut Woods Dr #2495 · Lakeland, FL
Flood risk 3/10 · Minor
- FEMA flood zone
- X (unshaded)
- Chance of flooding over 30 yrs
- 0.1%
- Est. flood insurance / yr
- $507 – $1,088
Fire risk 4/10 · Minor
- Est. fire insurance / yr
- $947 – $1,759
Heat risk 9/10 · Severe
- Hot days now (above 108°F)
- 7 days/yr
- Hot days in 30 yrs
- 25 days/yr
Wind risk 9/10 · Severe
- Chance of severe wind over 30 yrs
- 99.0%
Air-quality risk 2/10 · Minimal
- Unhealthy air days now
- 1 days/yr
- Unhealthy air days in 30 yrs
- 2 days/yr
Risk factors via First Street. Map © Google.
Why this score? — see what drove the C grade
The composite is a weighted blend of 9 inputs, each scored 0–100. Each bar is that input's sub-score; the figure is the points it added to the 100-point composite (weight × sub-score).
- Cash flow +17.0/30.0
- Appreciation +10.0/10.0
- ARV discount +7.5/15.0
- DSCR +5.3/10.0
- 1% rule +4.6/10.0
- Rent growth +4.0/5.0
- Livability +3.9/5.0
- Schools +3.5/10.0
- Condition / age +2.5/5.0
$299,000
🖨 Deal sheet (PDF) 📄 Offer letter ✓ Due diligence
Multi-family units
County records classify this as Multi-Family (2-4 Unit). Listing-text estimate: 2 units. confirmed
Listing remarks
Under contract-accepting backup offers. This 2-unit duplex, each offering 2 bedrooms and 1 bathroom, presents a solid opportunity for both investors and owner-occupants. One unit is tenant occupied on a month-to-month lease at $1,075 per month, while the second unit is currently vacant, allowing flexibility for a new tenant placement or an owner to occupy one unit while generating rental income from the other. Both units have been recently updated with granite countertops, wood cabinetry, updated bathroom tile flooring, modern vanities, lighting, and fresh interior paint. The roof was replaced in 2021 by previous owner. Each unit is separately metered for water & electric. Do not
Key facts
- Modern vanities
- Granite countertops
- Wood cabinetry
Tags
Neighborhood map
What this means for you Summary
Snapshot
- This is a 2 × 2-bed/1.0-bath units multifamily listed at $299k.
Deal economics
- At list price, monthly cash flow is $201 ($2k/yr) — positive. Per door: $100/mo.
- The deal already cash-flows at list — no discount required.
- To meet the 1% rule (rent ≥ 1% of price), the offer needs to be $287k (4.0% below list).
- Recommended offer: $281k (6.0% below list) — sets the bar for market timing.
Location & tenants
- Location reads 77/100 on livability (#206 in FL, #3,179 nationally) — a middle-class / working-renter tenant base. Strengths: cost of living A+, housing A+, health & safety A+; Watch: employment D+, amenities F, commute F.
- Polk (suburban): math 39% / reading 43% proficiency, ranked #62 of 73 in FL (top 85%) — families likely to look elsewhere, expect single-tenant / working-renter base with shorter leases.
- Zoned schools: R. Bruce Wagner Elementary School (math 54% / reading 42%, grade D, #1,171 of 2,144 statewide, top 55%, 946 students, 46% FRL); Sleepy Hill Middle School (math 29% / reading 34%, grade F, #453 of 571 statewide, top 81%, 1,090 students, 66% FRL); Kathleen Senior High School (math 19% / reading 31%, grade F, #501 of 667 statewide, top 75%, 2,051 students, 59% FRL) — zoned schools at 57% FRL track the district average.
- Market conditions: Rents rising fast (+6.1%/yr); 74 active listings in the ZIP; 7 comparable units currently listed for rent nearby; rentals at typical pace (median 17d on market — plan ~3-4 weeks tenant-placement turnaround); lower-income renter base — watch delinquency; 10,384 units permitted in Polk County in 2024 (1,716 in 5+ unit buildings).
- At $2,870/mo this rent would consume 92% of the median local household income ($37k/yr) (locally 700% of renters already pay >50% of income on rent) — very limited rent-growth headroom before tenants either downsize or default.
Forward outlook
- In year one you build about $32k of equity ($2k loan paydown + $30k appreciation (10.0% local appreciation)).
- Polk County population projected at +33% by 2050 — long-run rental-demand tailwind backs the buy-and-hold thesis.
- At projected returns (10.0% appreciation + 6.1% rent growth), your $84k cash investment doubles in ~3 years — after that, you're playing with house money.
- By year 2, paydown + projected appreciation supports a ~$51k cash-out refi (75% LTV) — recoverable capital for the next deal without selling this one.
Negotiation context
- It's been on market 90 days — a 6% lower offer ($281k) is reasonable based on typical stale-listing flexibility.
Risks & watch-outs
- Climate carrying-cost: severe wind risk, 99% chance of damaging wind over 30y; extreme-heat days projected 7→25/yr by 2055 (HVAC capex compounding) — expect insurance premiums to compound above CPI over the hold.
Questions for the listing agent
- It's been on market 90 days. Have you received any prior offers? Is the seller open to a 6% concession, seller financing, or rate buy-down credit?
- Can we see the unit-by-unit rent roll, current vacancy, and any below-market leases? What's the average tenancy length?
- What capital expenditures (roof, boiler, parking lot, exteriors) have been made in the last 5 years, and what's planned in the next 2?
- Why hasn't it sold? Are there any deal-killer items the seller is aware of (foundation, flood, title, zoning, code violations)?
- Is there a deadline driving the sale (1031 exchange, divorce, estate, relocation)? That informs how much negotiation room exists.
- What's the average days-on-market for RENTAL listings here right now (not sales)? A rising rental-DOM trend means longer vacancies and softer asking-rent achievability than the comps imply.
- What's the recent tenant-quality profile in this submarket — average credit score on applications, eviction rate, late-payment / NSF rate, and stable-employment percentage? A property-management company in the area should have these aggregated.
- How much new apartment / multifamily construction is in the pipeline within 1–3 miles? Heavy new supply (>2% of stock underway) typically softens rents 12–24 months out; light construction supports rent growth.
Investment metrics
- 1% rule
- 0.96% ✗
- Cap rate
- 7.10%
- Cash-on-cash
- 2.88%
- DSCR
- 1.13
- GRM
- 8.7
CMA / ARV
No comps found within radius.
Projected returns pro-forma
10.0% appreciation · 6.14% rent growth · sell at horizon
- IRR
- 27.5%
- Equity multiple
- 3.21×
- Total profit
- $185,039
- Equity at exit
- $269,363
- IRR
- 24.9%
- Equity multiple
- 7.65×
- Total profit
- $556,469
- Equity at exit
- $580,891
Cash invested: $83,720 (down + closing). Projections, not guarantees.
Landlord ↔ Tenant lean methodology
- Overall (STATE)
- 87 Strongly Landlord-Friendly
- State Florida
- 87 Strongly Landlord-Friendly · R+3
- County
- — inherits STATE
- City
- — inherits STATE
ZIP-level market 33815
- Home prices YoY
- 12.6%
- Rents YoY
- 6.1%
- Active inventory
- 74
- Price-to-rent
- 17.4×
Monthly cashflow live
- Estimated rent
- $2,870 high interval (Pro) →
- Mortgage (P&I)
- −$1,568
- Tax est. 1.5%
- −$374 /mo · $4,485/yr
- Insurance
- −$125
- HOA
- −$0
- Vacancy / Maint / Mgmt
- −$603
- Net cashflow
- $201
Break-even live
Sensitivity live
| Price | -10% $408 | -5% $304 | +0% $201 | +5% $98 | +10% $-6 |
|---|---|---|---|---|---|
| Rent | -10% $-26 | -5% $88 | +0% $201 | +5% $314 | +10% $428 |
| Rate | -1.0pp $352 | -0.5pp $277 | base $201 | +0.5pp $123 | +1.0pp $45 |
2-unit breakdown (identical units grouped — click to expand)
| Units | Beds | Baths | Est. rent |
|---|---|---|---|
| 2× units | 2 | 1 | $2,870 |
| #1 | 2 | 1 | $1,435 |
| #2 | 2 | 1 | $1,435 |
| Total (2 units) | $2,870 | ||
UW: 25.0% down · 7.5% · 30yr · 1.5% tax · 5.0% vac · 8.0% maint · 8.0% mgmt
Financing live
Cash to close
- Down payment
- $74,750
- Closing costs
- $8,970
- Reserves months
- —
- Total cash needed
- —
Loan-product check · same deal, 3 products live
Conventional
25% down · 7.5% · 30yr
- Down + closing
- —
- Monthly P&I
- —
- Monthly cashflow
- —
- DSCR
- —
- Eligible?
- —
Personal DTI + credit; lowest rate.
DSCR
20% down · 8.5% · 30yr
- Down + closing
- —
- Monthly P&I
- —
- Monthly cashflow
- —
- DSCR
- —
- Eligible?
- —
No personal income docs; deal must DSCR.
Hard money
10% down · 12.0% · 12mo
- Down + closing
- —
- Monthly P&I
- —
- Monthly cashflow
- —
- DSCR
- —
- Eligible?
- —
Short-term bridge; refi at stabilization.
Rent comps 7 comps
| Address | Beds | Baths | Sqft | Rent | $/sqft | DOM | Units | Dist |
|---|---|---|---|---|---|---|---|---|
| 2480 Chestnut Woods Dr Lakeland, FL | 3.0 | 2.0 | 2440 | $1,300 | $0.53 | 25d | 1 | 0.05mi |
| 1806 Dorothy St Lakeland, FL | 3.0 | 2.0 | 2046 | $1,695 | $0.83 | 5d | 1 | 1.08mi |
| 738 N Lorri Ave Lakeland, FL | 4.0 | 2.5 | 1500 | $2,600 | $1.73 | 16d | 1 | 1.11mi |
| 2340 Shasta St Lakeland, FL | 3.0–5.0 | 2.0–3.0 | 2098 | $2,404 | $1.15 | 5d | 3 | 1.15mi |
| 1335 W Walnut St Lakeland, FL | 3.0 | 2.0 | 1626 | $1,800 | $1.11 | 5d | 1 | 1.27mi |
| 1128 Neville Ave Lakeland, FL | 3.0 | 2.0 | 1245 | $1,900 | $1.53 | 16d | 1 | 1.44mi |
| 3327 Old Tampa Hwy Unit N/A Lakeland, FL | 3.0 | 2.0 | 1409 | $2,290 | $1.63 | 16d | 1 | 1.44mi |
Listing history 3 events
-
2026-04-21status Pending
-
2026-03-24price $299,000
-
2026-01-21$309,000 Active
ⓘ Source: listings_history table (triggers on properties + properties_extension) + one-shot
backfill from property_details.listing_events for pre-trigger history.
Climate risk First Street
- Flood 3/10 Moderate FEMA zone X (unshaded) · 10% chance over 30 yrs
- Wildfire 4/10 Moderate
- Heat 9/10 Extreme 7 d/yr ≥108°F today · 25 d/yr by 30 yrs out
- Wind 9/10 Extreme 99% chance of damaging wind over 30 yrs
- Air quality 2/10 Low 1 unhealthy d/yr today · 2 by 30 yrs out
Nearby sold comps map
Loading sold comps map…
Walkable amenities ~0.75 mi
Loading nearby amenities…
Taxation est. · year 1
- Rental income
- $34,440
- − Mortgage interest
- −$16,749
- − Property taxes
- −$4,485
- − Insurance
- −$1,495
- − Repairs & maintenance
- −$2,755
- − Management
- −$2,755
- − Depreciation
- −$8,698
- Taxable loss
- −$2,497
- Est. tax savings @ 24.0%
- +$599
- After-tax cash flow
- $3,011/yr
For passive investors: Depreciation is non-cash, so a rental often shows a tax loss while cash-flowing — sheltering income. Rental losses are passive: they offset passive income freely, and up to $25,000/yr can offset ordinary (W-2) income if you actively participate and your MAGI is under $100k (phasing out to $0 by $150k); unused losses carry forward. On sale, claimed depreciation is recaptured at up to 25%, and gains may owe capital-gains tax (a 1031 exchange can defer both). Figures are a year-1 estimate at your 24.0% rate — not tax advice; consult a CPA.
Schools (NCES district)
- District
- Polk
- NCES district ID
- 1201590
- Math proficiency
- 39% ▼ -11.00%
- Reading proficiency
- 43% ▼ -4.00%
- Median HH income
- $43,979
- Composite
- 34.74/100
- National rank
- #5132
- State rank
- #62 of 73 in FL
Livability — Lakeland
- Score
- 77/100
- State rank
- #206
- US rank
- #3179
Category grades
Schools grade is shown separately in the Schools card above.
Census & demographics
- Census place
- Lakeland, FL
- County
- Polk County · 740,051 people
- City population
- 277,690
- Metro
- Lakeland-Winter Haven, FL
- Population (ZIP)
- 13,975
- Household income
- $37,487
- Rent vs Own
- Severe rent burden
- 700.0
Population outlook (Polk County) Hauer SSP2
- Today (2025)
- 752,975 people
- By 2030
- 804,621 · +6.9%
- By 2040
- 906,117 · +20.3%
- By 2050
- 1,000,476 · +32.9%
- By 2075
- 1,197,520 · +59.0%
- By 2100
- 1,271,518 · +68.9%
Race, ethnicity, and origin ACS 2023
- Neighborhood character
- Diverse neighborhood (Simpson 0.67)
- Race & ethnicity
- White 43% Black 27% Hispanic / Latino 26% Two or more races 10% Asian 1%
- Hispanic origin (detail)
- Mexican 12% Puerto Rican 10%
- Common ancestry
- Romanian 1% German 1% Lithuanian 1%
- Foreign-born
- 11% · Canada, Jamaica, China
- Languages at home
- 75% English-only · Spanish 23% German/W. Germanic 1%
Political lean MEDSL · Polk
- 2024 margin
- Strong R (+20.7) · D 39.2% · R 59.9%
- 2008→2024 swing
- -14.6pp toward R · 2008: -6.1pp · 2024: -20.7pp
- All cycles
- 2024: R+20.7 2020: R+14.4 2016: R+14.1 2012: R+6.8 2008: R+6.1
Not yet ingested
- Civics
- —
Market trends
- HPI YoY
- ▲ 47.45%
- Current HPI
- 424.0956
- Rent YoY
- ▲ 6.14%
- Metro
- Lakeland-Winter Haven, FL
- State GDP YoY
- ▲ 3.28%
- F500 in state
- 36
Industry mix (Fortune 500 HQ in FL)
| Industry | F500 HQs | Revenue |
|---|---|---|
| Industrial Technology | 2 | $29B |
|
||
| Insurance | 2 | $17B |
|
||
| Retail | 1 | $60B |
|
||
| Technology Distribution | 1 | $58B |
|
||
| Homebuilding | 1 | $35B |
|
||
| Technology Manufacturing | 1 | $35B |
|
||
Price history
-3.2% since first listed3 events — show timeline
- 2026-04-21 Pending — Stellar MLS as Distributed by MLS Grid
- 2026-03-24 Price Changed $299,000 Stellar MLS as Distributed by MLS Grid
- 2026-01-21 Listed $309,000 Stellar MLS as Distributed by MLS Grid
Cash-flow waterfall
monthlySold comps — $/sqft
last 12 mo · ≤1 miLoading sold comps…