2050 W. St. Rt. 89A , #20 Plan · Clarkdale, AZ
Flood risk No data
- FEMA flood zone
- —
- Chance of flooding over 30 yrs
- —
- Est. flood insurance / yr
- —
Fire risk No data
- Est. fire insurance / yr
- —
Heat risk No data
- Hot days now (above threshold)
- —
- Hot days in 30 yrs
- —
Wind risk No data
- Chance of severe wind over 30 yrs
- —
Air-quality risk No data
- Unhealthy air days now
- —
- Unhealthy air days in 30 yrs
- —
Risk factors via First Street. Map © Google.
Why this score? — see what drove the B+ grade
The composite is a weighted blend of 9 inputs, each scored 0–100. Each bar is that input's sub-score; the figure is the points it added to the 100-point composite (weight × sub-score).
- Cash flow +30.0/30.0
- ARV discount +15.0/15.0
- DSCR +10.0/10.0
- 1% rule +9.6/10.0
- Schools +3.6/10.0
- Livability +2.9/5.0
- Condition / age +2.5/5.0
- Rent growth +2.4/5.0
- Appreciation +0.0/10.0
$160,000
🖨 Deal sheet 📄 Offer letter ✓ Due diligence
Listing remarks
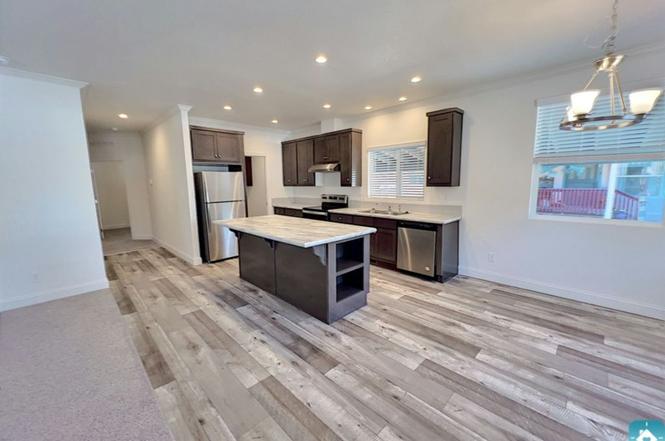
Discover the perfect blend of style and comfort in this soon-to-be-completed 3-bedroom, 2-bath home. Featuring contemporary finishes, open-concept living spaces, and a thoughtful layout, this home is ideal for modern living. Reserve your spot with a deposit today and be the first to call this exceptional property your own. Act now-this opportunity won't last long! Experience unmatched comfort in Cottonwood! Contact Brianna
Key facts
- Listed 496 days
Property features AI
Finance
- Other:
- Financial info: List price $160,000
- HOA & community:
Exterior
- Parking:
- Security:
- Utilities:
- Home design: Plan property; Unit/plan listed as "2050 W. St. Rt. 89A , #20"
- Construction: Living area approximately 1568;
- Exterior features: Located on W State Route 89A
Interior
- Kitchen:
- Bedrooms: 3 bedrooms
- Flooring:
- Bathrooms: 2 bathrooms (full)
- Heating & cooling:
- Interior features: Plan-built interior
- Laundry & utility:
Neighborhood map
What this means for you Summary
Snapshot
- This is a 3-bed/2.0-bath manufactured listed at $160k.
Deal economics
- At list price, monthly cash flow is $735 ($9k/yr) — positive.
- The deal already cash-flows at list — no discount required.
- Meets the 1% rule at list price ($2k rent vs $160k).
- Recommended offer: $141k (12.0% below list) — sets the bar for market timing.
- Cap rate 11.8% vs local median 3.0% in Clarkdale — top-decile yield for the area; either an underpriced asset or a hidden risk that comps aren't pricing in. Stress-test before assuming the spread holds.
Location & tenants
- Location reads 58/100 on livability (#203 in AZ) — a working-class tenant base; expect higher turnover. Strengths: crime A+; Watch: amenities F, commute F, employment F.
- Mingus Union High School District (4488) (town): math 45% / reading 35% proficiency, ranked #198 of 501 in AZ (top 40%) — families likely to look elsewhere, expect single-tenant / working-renter base with shorter leases.
- Market conditions: Rents soft (-0.2%/yr); 266 active listings in the ZIP; 6 comparable units currently listed for rent nearby; rentals leasing fast (median 14d on market — plan ~1-2 weeks tenant-placement turnaround); 2,062 units permitted in Yavapai County in 2024 (98 in 5+ unit buildings).
- At $2,330/mo this rent would consume 49% of the median local household income ($57k/yr) (locally 894% of renters already pay >50% of income on rent) — very limited rent-growth headroom before tenants either downsize or default.
Forward outlook
- Local home prices are declining (-3.0%/yr); year-one equity from $1k of loan paydown is wiped out by about $5k of value loss. Plan a longer hold.
- Yavapai County population projected at +10% by 2050 — modest demand growth; plan on rents tracking national, not racing it.
- At projected returns (-3.0% appreciation + 0.0% rent growth), your $45k cash investment doubles in ~8 years — after that, you're playing with house money.
Negotiation context
- It's been on market 496 days — a 12% lower offer ($141k) is reasonable based on typical stale-listing flexibility.
Questions for the listing agent
- It's been on market 496 days. Have you received any prior offers? Is the seller open to a 12% concession, seller financing, or rate buy-down credit?
- Why hasn't it sold? Are there any deal-killer items the seller is aware of (foundation, flood, title, zoning, code violations)?
- Is there a deadline driving the sale (1031 exchange, divorce, estate, relocation)? That informs how much negotiation room exists.
- What's the average days-on-market for RENTAL listings here right now (not sales)? A rising rental-DOM trend means longer vacancies and softer asking-rent achievability than the comps imply.
- What's the recent tenant-quality profile in this submarket — average credit score on applications, eviction rate, late-payment / NSF rate, and stable-employment percentage? A property-management company in the area should have these aggregated.
- How much new for-sale + rental construction is in the pipeline within 1–3 miles? Heavy new supply typically softens prices + rents 12–24 months out; constrained supply supports both.
Investment metrics
- 1% rule
- 1.46% ✓
- Cap rate
- 11.80%
- Cash-on-cash
- 19.68%
- DSCR
- 1.88
- GRM
- 5.7
CMA / ARV
- ARV (on-the-fly)
- $203,840
- Comps found
- 12
Show comp detail 12 sales within ~0.75 mi
| Address | Dist | Beds/Ba | Sqft | Sold | Price | $/sf | Match |
|---|---|---|---|---|---|---|---|
| 2050 W SR 89-a -- #96 | 0.18mi | 3/2.0 | 1,568 (0%) | 1mo | $155,000 | $99 | 91 |
| 2050 W State Route 89-a -- #344 | 0.18mi | 3/2.0 | 1,680 (+7%) | 2mo | $200,000 | $119 | 78 |
| 1024 Rankin Ave | 0.56mi | 3/2.0 | 1,605 (+2%) | 2mo | $199,900 | $125 | 68 |
| 2050 W State Route 89a -- #152 | 0.09mi | 2/2.0 (-1) | 1,344 (-14%) | 0mo | $205,000 | $153 | 67 |
| 2050 W State Route 89a -- #86 | 0.18mi | 3/2.0 | 1,344 (-14%) | 2mo | $35,000 | $26 | 66 |
| 1216 Hogan Dr | 0.55mi | 2/2.0 (-1) | 1,600 (+2%) | 1mo | $248,000 | $155 | 65 |
| 2050 W SR 89a -- #104 | 0.44mi | 2/2.0 (-1) | 1,456 (-7%) | 1mo | $118,000 | $81 | 62 |
| 880 W On The Greens Blvd | 0.69mi | 3/2.0 | 1,620 (+3%) | 2mo | $249,900 | $154 | 61 |
| 1040 Calle Tomallo -- | 0.41mi | 3/3.0 | 1,716 (+9%) | 0mo | $324,000 | $189 | 61 |
| 992 Trevino Dr | 0.53mi | 3/2.0 | 1,431 (-9%) | 3mo | $195,000 | $136 | 58 |
| 972 Trevino Dr | 0.55mi | 3/2.0 | 1,382 (-12%) | 2mo | $179,900 | $130 | 53 |
| 1077 W Highway 89a -- #209 | 0.59mi | 3/2.0 | 1,369 (-13%) | 2mo | $110,000 | $80 | 50 |
Match score weights: distance 35% · size 25% · config 20% · recency 20%. Top-matched comps best support the ARV.
Projected returns pro-forma
-3.0% appreciation · 0.0% rent growth · sell at horizon
- IRR
- 8.3%
- Equity multiple
- 1.31×
- Total profit
- $14,079
- Equity at exit
- $23,857
- IRR
- 14.8%
- Equity multiple
- 2.03×
- Total profit
- $46,277
- Equity at exit
- $13,834
Cash invested: $44,800 (down + closing). Projections, not guarantees.
Landlord ↔ Tenant lean methodology
- Overall (STATE)
- 87 Strongly Landlord-Friendly
- State Arizona
- 87 Strongly Landlord-Friendly · R+3
- County
- — inherits STATE
- City
- — inherits STATE
ZIP-level market 86326
- Home prices YoY
- -32.2%
- Rents YoY
- -0.2%
- Active inventory
- 266
- Price-to-rent
- 5.7×
Monthly cashflow live
- Estimated rent
- $2,330 high interval (Pro) →
- Mortgage (P&I)
- −$839
- Tax est. 1.5%
- −$200 /mo · $2,400/yr
- Insurance
- −$67
- HOA
- −$0
- Vacancy / Maint / Mgmt
- −$489
- Net cashflow
- $735
Break-even live
UW: 25.0% down · 7.5% · 30yr · 1.5% tax · 5.0% vac · 8.0% maint · 8.0% mgmt
Financing live
Cash to close
- Down payment
- $40,000
- Closing costs
- $4,800
- Reserves months
- —
- Total cash needed
- —
Loan-product check · same deal, 3 products live
Conventional
25% down · 7.5% · 30yr
- Down + closing
- —
- Monthly P&I
- —
- Monthly cashflow
- —
- DSCR
- —
- Eligible?
- —
Personal DTI + credit; lowest rate.
DSCR
20% down · 8.5% · 30yr
- Down + closing
- —
- Monthly P&I
- —
- Monthly cashflow
- —
- DSCR
- —
- Eligible?
- —
No personal income docs; deal must DSCR.
Hard money
10% down · 12.0% · 12mo
- Down + closing
- —
- Monthly P&I
- —
- Monthly cashflow
- —
- DSCR
- —
- Eligible?
- —
Short-term bridge; refi at stabilization.
Rent comps 6 comps
| Address | Beds | Baths | Sqft | Rent | $/sqft | DOM | Units | Dist |
|---|---|---|---|---|---|---|---|---|
| 992 Sterling Ln Cottonwood, AZ | 3.0 | 2.0 | 1652 | $2,395 | $1.45 | 21d | 1 | 0.61mi |
| 1121 Old Jerome Hwy Clarkdale, AZ | 2.0 | 2.0 | 1981 | $2,185 | $1.10 | 21d | 1 | 0.89mi |
| 844 Tiablanca Rd Clarkdale, AZ | 2.0 | 2.0 | 1333 | $1,995 | $1.50 | 13d | 1 | 0.96mi |
| 1910 W Trail Blazer Dr Cottonwood, AZ | 2.0 | 2.0 | 1278 | $2,900 | $2.27 | 13d | 1 | 1.13mi |
| 832 Eugene Rd Clarkdale, AZ | 3.0 | 2.0 | 1709 | $2,700 | $1.58 | 13d | 1 | 1.14mi |
| 255 S Cottonwood Ranch Rd Cottonwood, AZ | 3.0 | 2.0 | 1695 | $2,195 | $1.29 | 13d | 1 | 1.21mi |
Listing history 16 events
-
2026-06-18days on market $160,000 Active 496 DOM
-
2026-06-17days on market $160,000 Active 495 DOM
-
2026-06-16days on market $160,000 Active 494 DOM
-
2026-06-15days on market $160,000 Active 493 DOM
-
2026-06-14days on market $160,000 Active 491 DOM
-
2026-06-13days on market $160,000 Active 490 DOM
-
2026-06-10days on market $160,000 Active 488 DOM
-
2026-06-09days on market $160,000 Active 487 DOM
-
2026-06-08days on market $160,000 Active 486 DOM
-
2026-06-07days on market $160,000 Active 485 DOM
-
2026-06-05days on market $160,000 Active 482 DOM
-
2026-06-03days on market $160,000 Active 481 DOM
-
2026-06-02days on market $160,000 Active 480 DOM
-
2026-06-01days on market $160,000 Active 479 DOM
-
2026-05-31days on market $160,000 Active 478 DOM
-
2026-05-30days on market $160,000 Active 477 DOM
ⓘ Source: listings_history table (triggers on properties + properties_extension) + one-shot
backfill from property_details.listing_events for pre-trigger history.
Nearby sold comps map
Loading sold comps map…
Walkable amenities ~0.75 mi
Loading nearby amenities…
Taxation est. · year 1
- Rental income
- $27,957
- − Mortgage interest
- −$8,962
- − Property taxes
- −$2,400
- − Insurance
- −$800
- − Repairs & maintenance
- −$2,237
- − Management
- −$2,237
- − Depreciation
- −$4,655
- Taxable income
- $6,667
- Est. tax owed @ 24.0%
- −$1,600
- After-tax cash flow
- $7,217/yr
For passive investors: Depreciation is non-cash, so a rental often shows a tax loss while cash-flowing — sheltering income. Rental losses are passive: they offset passive income freely, and up to $25,000/yr can offset ordinary (W-2) income if you actively participate and your MAGI is under $100k (phasing out to $0 by $150k); unused losses carry forward. On sale, claimed depreciation is recaptured at up to 25%, and gains may owe capital-gains tax (a 1031 exchange can defer both). Figures are a year-1 estimate at your 24.0% rate — not tax advice; consult a CPA.
Schools (NCES district)
- District
- Mingus Union High School District (4488)
- NCES district ID
- 0405070
- Math proficiency
- 45% ▲ 5.00%
- Reading proficiency
- 35% ▲ 5.00%
- Median HH income
- $41,715
- Composite
- 36.15/100
- National rank
- #9465
- State rank
- #198 of 501 in AZ
Livability — Clarkdale
- Score
- 58/100
- State rank
- #203
- US rank
- #20648
Category grades
Schools grade is shown separately in the Schools card above.
Census & demographics
- Census place
- Clarkdale, AZ
- County
- Yavapai County · 190,406 people
- Metro
- Prescott Valley-Prescott, AZ
- Population (ZIP)
- 24,852
- Household income
- $57,378
- Rent vs Own
- Severe rent burden
- 894.0
Population outlook (Yavapai County) Hauer SSP2
- Today (2025)
- 241,389 people
- By 2030
- 249,523 · +3.4%
- By 2040
- 259,966 · +7.7%
- By 2050
- 264,736 · +9.7%
- By 2075
- 269,334 · +11.6%
- By 2100
- 256,505 · +6.3%
Race, ethnicity, and origin ACS 2023
- Neighborhood character
- Predominantly White (73%)
- Race & ethnicity
- White 73% Hispanic / Latino 20% Two or more races 14% Native American 1%
- Hispanic origin (detail)
- Mexican 17%
- Common ancestry
- Italian 3% Romanian 3% Lithuanian 2%
- Foreign-born
- 12% · Canada
- Languages at home
- 84% English-only · Spanish 14% German/W. Germanic 1%
Political lean MEDSL · Yavapai
- 2024 margin
- Solid R (+33.9) · D 32.6% · R 66.5%
- 2008→2024 swing
- -9.5pp toward R · 2008: -24.4pp · 2024: -33.9pp
- All cycles
- 2024: R+33.9 2020: R+29.3 2016: R+31.4 2012: R+30.7 2008: R+24.4
Not yet ingested
- Civics
- —
Market trends
- HPI YoY
- ▼ -165.27%
- Current HPI
- 347.5058
- Rent YoY
- ▼ -0.22%
- Metro
- Prescott Valley-Prescott, AZ
- State GDP YoY
- ▲ 4.54%
- F500 in state
- 20
Industry mix (Fortune 500 HQ in AZ)
| Industry | F500 HQs | Revenue |
|---|---|---|
| Technology | 2 | $13B |
|
||
| Mining / Metals | 1 | $23B |
|
||
| Environmental Services | 1 | $16B |
|
||
| Metals / Steel | 1 | $14B |
|
||
| Technology Distribution | 1 | $9B |
|
||
| Homebuilding | 1 | $8B |
|
||
Cash-flow waterfall
monthlySold comps — $/sqft
last 12 mo · ≤1 miLoading sold comps…