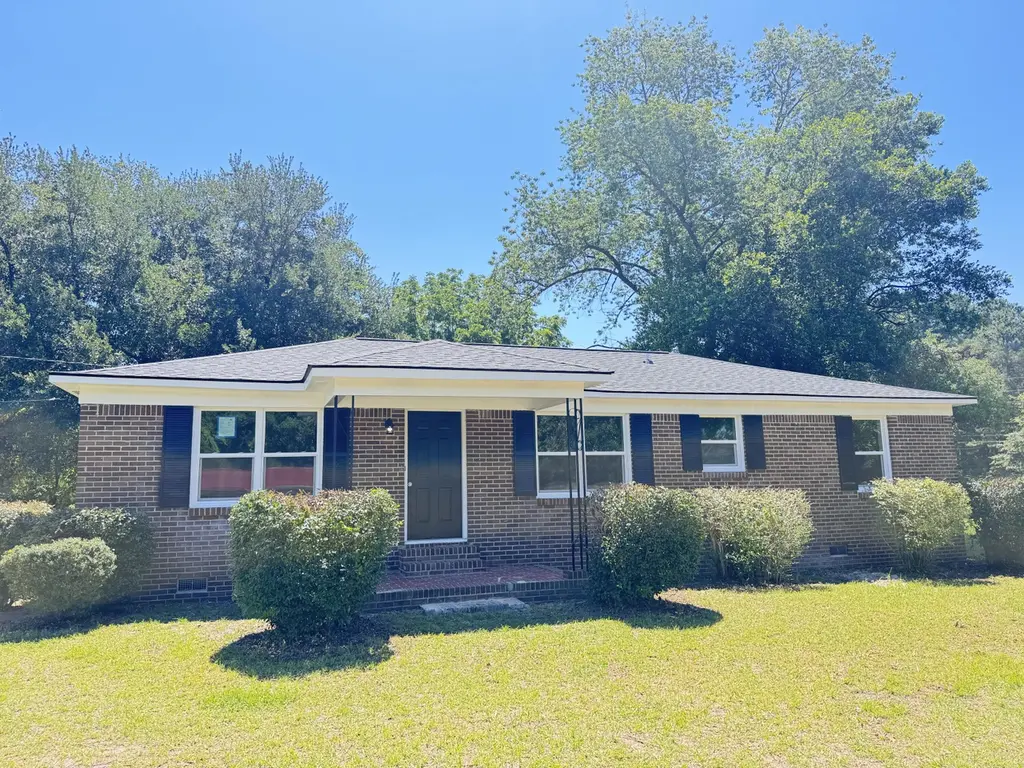
505 Lakeshore · Walterboro, SC
Flood risk 1/10 · Minimal
- FEMA flood zone
- X (unshaded)
- Chance of flooding over 30 yrs
- 0.0%
- Est. flood insurance / yr
- $507 – $1,088
Fire risk 7/10 · Major
- Est. fire insurance / yr
- $783 – $1,453
Heat risk 8/10 · Major
- Hot days now (above 108°F)
- 7 days/yr
- Hot days in 30 yrs
- 18 days/yr
Wind risk 8/10 · Major
- Chance of severe wind over 30 yrs
- 80.0%
Air-quality risk 3/10 · Minor
- Unhealthy air days now
- 3 days/yr
- Unhealthy air days in 30 yrs
- 3 days/yr
Risk factors via First Street. Map © Google.
Why this score? — see what drove the D grade
The composite is a weighted blend of 9 inputs, each scored 0–100. Each bar is that input's sub-score; the figure is the points it added to the 100-point composite (weight × sub-score).
- Cash flow +17.0/30.0
- ARV discount +7.5/15.0
- DSCR +5.3/10.0
- 1% rule +3.7/10.0
- Livability +2.9/5.0
- Rent growth +2.5/5.0
- Condition / age +2.5/5.0
- Schools +1.7/10.0
- Appreciation +0.0/10.0
$269,000
🖨 Deal sheet (PDF) 📄 Offer letter ✓ Due diligence
Listing remarks
Unbelievable Transformation!This beautifully renovated brick ranch offers 1,377 square feet of comfortable single-story living, combining timeless appeal with modern updates throughout. Known for its durable masonry construction, low-profile design, and functional floor plan, this home delivers both style and convenience. Extensive renovations provide peace of mind and move-in-ready living, including a new roof, new HVAC system, new appliances, fresh interior and exterior paint, new flooring, updated countertops, modern lighting fixtures, and new hardware throughout. Featuring 3 bedrooms and 2 bathrooms, this versatile home is situated on a desirable corner lot and offers easy accessibility
Key facts
- New appliances
- Fresh interior paint
- Fresh exterior paint
Tags
Property features AI
Finance
- HOA & community: Trash service
Exterior
- Parking: Attached parking; Off-street parking
- Utilities: Public sewer; City of Walterboro utilities available; Dominion Energy service
- Home design: Single-family detached residential; One story; Ground-level entry
- Construction: Architectural roof; Fee simple ownership
- Exterior features: Stoop; Partial fencing; High lot; Lot size under 0.5 acre
Interior
- Kitchen: Electric range; Range hood; Refrigerator; ENERGY STAR qualified appliances; Tankless water heater
- Bedrooms: 3 bedrooms; Primary bedroom on lower level with ceiling fan(s) and walk-in closet(s)
- Flooring: Laminate flooring; Vinyl flooring
- Bathrooms: 2 bathrooms
- Heating & cooling: Central heat (electric heat pump); Central air conditioning
- Interior features: Blown and smooth ceilings; Ceiling fans; Eat-in kitchen; Family room; Walk-in closet(s)
- Laundry & utility: Laundry room with washer and electric dryer hookups
Neighborhood map
What this means for you Summary
Snapshot
- This is a 3-bed/2.0-bath single-family listed at $269k.
Deal economics
- At list price, monthly cash flow is $180 ($2k/yr) — positive.
- The deal already cash-flows at list — no discount required.
- To meet the 1% rule (rent ≥ 1% of price), the offer needs to be $233k (13.5% below list).
- Recommended offer: $233k (13.5% below list) — sets the bar for 1% rule.
Location & tenants
- Location reads 57/100 on livability (#269 in SC) — a working-class tenant base; expect higher turnover. Strengths: cost of living A+, health & safety A+, housing A-; Watch: crime F, amenities F, commute F.
- Colleton 01 (rural): math 13% / reading 28% proficiency, ranked #69 of 80 in SC (top 86%) — low school quality limits family demand, transient renter base, plan for 1-2y turnover; 69% free/reduced lunch — lower-income household profile, screen leases tightly.
- Zoned schools: Northside Elementary (math 14% / reading 22%, grade F, #508 of 597 statewide, top 86%, 452 students, 100% FRL); Colleton County Middle (math 8% / reading 18%, grade F, #210 of 229 statewide, top 93%, 1,121 students, 100% FRL); Colleton County High (math 28% / reading 80%, grade C-, #137 of 196 statewide, top 70%, 1,497 students, 100% FRL) — zoned schools average 100% FRL vs 69% district-wide (31 pts higher); higher-poverty schools than district average — tighter screening recommended.
- Market conditions: 223 active listings in the ZIP; 50 units permitted in Colleton County in 2024 (0 in 5+ unit buildings).
Forward outlook
- Local home prices are declining (-3.0%/yr); year-one equity from $2k of loan paydown is wiped out by about $8k of value loss. Plan a longer hold.
- Colleton County population projected at -28% by 2050 — secular population decline; favor cash flow + early exit over multi-decade hold.
Negotiation context
- It's been on market 16 days — a 2% lower offer ($265k) is reasonable based on typical stale-listing flexibility.
- Current owner paid $85k; list at $269k implies a 216% gain — meaningful room to come down on a strong offer.
Risks & watch-outs
- Climate carrying-cost: severe wind risk, 80% chance of damaging wind over 30y; major wildfire risk; extreme-heat days projected 7→18/yr by 2055 (HVAC capex compounding) — expect insurance premiums to compound above CPI over the hold.
Questions for the listing agent
- Built in 1978 — when were the roof, HVAC, electrical panel, plumbing, and water heater last replaced?
- Is there a deadline driving the sale (1031 exchange, divorce, estate, relocation)? That informs how much negotiation room exists.
- Schools are F-rated, which usually means shorter tenancies and higher turnover. Who's the typical renter profile here, and what's been the actual vacancy rate?
- Crime grade is F in this area — have there been break-ins, vandalism, or insurance claims at this property in the last 3 years? What carrier currently insures it and at what premium?
- The area grade is low — what's the realistic commute time and amenity access for the typical tenant pool here? Any planned neighborhood developments (good or bad) we should know about?
- What's the average days-on-market for RENTAL listings here right now (not sales)? A rising rental-DOM trend means longer vacancies and softer asking-rent achievability than the comps imply.
- What's the recent tenant-quality profile in this submarket — average credit score on applications, eviction rate, late-payment / NSF rate, and stable-employment percentage? A property-management company in the area should have these aggregated.
- How much new for-sale + rental construction is in the pipeline within 1–3 miles? Heavy new supply typically softens prices + rents 12–24 months out; constrained supply supports both.
Investment metrics
- 1% rule
- 0.87% ✗
- Cap rate
- 7.10%
- Cash-on-cash
- 2.87%
- DSCR
- 1.13
- GRM
- 9.6
CMA / ARV
No comps found within radius.
Projected returns pro-forma
-3.0% appreciation · 3.0% rent growth · sell at horizon
- IRR
- -11.8%
- Equity multiple
- 0.57×
- Total profit
- $-32,211
- Equity at exit
- $40,109
- IRR
- -2.7%
- Equity multiple
- 0.82×
- Total profit
- $-13,641
- Equity at exit
- $23,258
Cash invested: $75,320 (down + closing). Projections, not guarantees.
Landlord ↔ Tenant lean methodology
- Overall (STATE)
- 90 Strongly Landlord-Friendly
- State South Carolina
- 90 Strongly Landlord-Friendly · R+6
- County
- — inherits STATE
- City
- — inherits STATE
ZIP-level market 29488
- Home prices YoY
- -33.6%
- Active inventory
- 223
- Price-to-rent
- 9.6×
Monthly cashflow live
- Estimated rent
- $2,327 medium interval (Pro) →
- Mortgage (P&I)
- −$1,411
- Tax from tax record
- −$135 /mo · $1,626/yr
- Insurance
- −$112
- HOA
- −$0
- Vacancy / Maint / Mgmt
- −$489
- Net cashflow
- $180
Break-even live
Sensitivity live
| Price | -10% $332 | -5% $256 | +0% $180 | +5% $104 | +10% $28 |
|---|---|---|---|---|---|
| Rent | -10% $-4 | -5% $88 | +0% $180 | +5% $272 | +10% $364 |
| Rate | -1.0pp $316 | -0.5pp $248 | base $180 | +0.5pp $110 | +1.0pp $39 |
UW: 25.0% down · 7.5% · 30yr · 1.5% tax · 5.0% vac · 8.0% maint · 8.0% mgmt
Financing live
Cash to close
- Down payment
- $67,250
- Closing costs
- $8,070
- Reserves months
- —
- Total cash needed
- —
Loan-product check · same deal, 3 products live
Conventional
25% down · 7.5% · 30yr
- Down + closing
- —
- Monthly P&I
- —
- Monthly cashflow
- —
- DSCR
- —
- Eligible?
- —
Personal DTI + credit; lowest rate.
DSCR
20% down · 8.5% · 30yr
- Down + closing
- —
- Monthly P&I
- —
- Monthly cashflow
- —
- DSCR
- —
- Eligible?
- —
No personal income docs; deal must DSCR.
Hard money
10% down · 12.0% · 12mo
- Down + closing
- —
- Monthly P&I
- —
- Monthly cashflow
- —
- DSCR
- —
- Eligible?
- —
Short-term bridge; refi at stabilization.
Listing history 12 events
-
2026-06-21days on market $269,000 Active 16 DOM
-
2026-06-21days on market $269,000 Active 15 DOM
-
2026-06-18days on market $269,000 Active 13 DOM
-
2026-06-17days on market $269,000 Active 12 DOM
-
2026-06-16days on market $269,000 Active 11 DOM
-
2026-06-15days on market $269,000 Active 10 DOM
-
2026-06-13days on market $269,000 Active 8 DOM
-
2026-06-12days on market $269,000 Active 7 DOM
-
2026-06-09days on market $269,000 Active 4 DOM
-
2026-06-08days on market $269,000 Active 3 DOM
-
2026-06-08remarks 699-char remark
-
2026-06-08$269,000 Active 2 DOM
ⓘ Source: listings_history table (triggers on properties + properties_extension) + one-shot
backfill from property_details.listing_events for pre-trigger history.
Tax reassessment forecast SC · Resets to sale price
- Current annual tax
- $1,626 · $135/mo
- Projected year-2 tax
- $1,626 · $135/mo
- Expected delta
- $0/yr ($0/mo · 0.0%)
ⓘ Screening estimate from a state-policy table — verify with the county assessor before closing.
Climate risk First Street
- Flood 1/10 Low FEMA zone X (unshaded) · 0% chance over 30 yrs
- Wildfire 7/10 Severe
- Heat 8/10 Severe 7 d/yr ≥108°F today · 18 d/yr by 30 yrs out
- Wind 8/10 Severe 80% chance of damaging wind over 30 yrs
- Air quality 3/10 Moderate 3 unhealthy d/yr today · 3 by 30 yrs out
Nearby sold comps map
Loading sold comps map…
Walkable amenities ~0.75 mi
Loading nearby amenities…
Taxation est. · year 1
- Rental income
- $27,923
- − Mortgage interest
- −$15,068
- − Property taxes
- −$1,626
- − Insurance
- −$1,345
- − Repairs & maintenance
- −$2,234
- − Management
- −$2,234
- − Depreciation
- −$7,825
- Taxable loss
- −$2,409
- Est. tax savings @ 24.0%
- +$578
- After-tax cash flow
- $2,739/yr
For passive investors: Depreciation is non-cash, so a rental often shows a tax loss while cash-flowing — sheltering income. Rental losses are passive: they offset passive income freely, and up to $25,000/yr can offset ordinary (W-2) income if you actively participate and your MAGI is under $100k (phasing out to $0 by $150k); unused losses carry forward. On sale, claimed depreciation is recaptured at up to 25%, and gains may owe capital-gains tax (a 1031 exchange can defer both). Figures are a year-1 estimate at your 24.0% rate — not tax advice; consult a CPA.
Schools (NCES district)
- District
- Colleton 01
- NCES district ID
- 4501830
- Math proficiency
- 13% ▼ -10.00%
- Reading proficiency
- 28% ▬ 0.00%
- Median HH income
- $33,128
- Composite
- 16.66/100
- National rank
- #9171
- State rank
- #69 of 80 in SC
Livability — Walterboro
- Score
- 57/100
- State rank
- #269
- US rank
- #21618
Category grades
Schools grade is shown separately in the Schools card above.
Census & demographics
- City population
- 22,367
- Population (ZIP)
- 22,367
Population outlook (Colleton County) Hauer SSP2
- Today (2025)
- 34,932 people
- By 2030
- 33,078 · -5.3%
- By 2040
- 29,017 · -16.9%
- By 2050
- 25,029 · -28.3%
- By 2075
- 16,894 · -51.6%
- By 2100
- 10,518 · -69.9%
Race, ethnicity, and origin ACS 2023
- Neighborhood character
- Diverse neighborhood (Simpson 0.56)
- Race & ethnicity
- White 54% Black 38% Hispanic / Latino 4% Two or more races 4%
- Common ancestry
- Italian 2% Lithuanian 1% Slovak 1%
- Foreign-born
- 2% · Canada
- Languages at home
- 97% English-only · Spanish 2%
Political lean MEDSL · Colleton
- 2024 margin
- R (+18.2) · D 40.4% · R 58.5% · Other 1.1%
- 2008→2024 swing
- -18.7pp toward R · 2008: 0.5pp · 2024: -18.2pp
- All cycles
- 2024: R+18.2 2020: R+9.5 2016: R+8.5 2012: D+0.2 2008: D+0.5
Not yet ingested
- Civics
- —
Market trends
- HPI YoY
- ▼ -119.20%
- Current HPI
- 235.1237
- Rent YoY
- —
- Metro
- —
- State GDP YoY
- ▲ 4.51%
- F500 in state
- 2
Industry mix (Fortune 500 HQ in SC)
| Industry | F500 HQs | Revenue |
|---|---|---|
| Packaging | 1 | $7B |
|
||
Price history
+216.5% since first listed2 events — show timeline
- 2026-06-05 Listed $269,000 Charleston Trident MLS
- 2026-04-02 Sold (Public Records) $85,000 Public Records
Property tax history
+3.7%/yrLatest (2025): $1,626 · +4.5% YoY. Source: county tax records.
Cash-flow waterfall
monthlySold comps — $/sqft
last 12 mo · ≤1 miLoading sold comps…