 Triplex
9004 S San Pedro St · Los Angeles, CA
Flood risk 1/10 · Minimal
- FEMA flood zone
- X (unshaded)
- Chance of flooding over 30 yrs
- 0.0%
- Est. flood insurance / yr
- $507 – $1,088
Fire risk 1/10 · Minimal
- Est. fire insurance / yr
- $659 – $1,223
Heat risk 5/10 · Moderate
- Hot days now (above 88°F)
- 7 days/yr
- Hot days in 30 yrs
- 21 days/yr
Wind risk 1/10 · Minimal
- Chance of severe wind over 30 yrs
- —
Air-quality risk 5/10 · Moderate
- Unhealthy air days now
- 7 days/yr
- Unhealthy air days in 30 yrs
- 7 days/yr
Risk factors via First Street. Map © Google.
Why this score? — see what drove the D grade
The composite is a weighted blend of 9 inputs, each scored 0–100. Each bar is that input's sub-score; the figure is the points it added to the 100-point composite (weight × sub-score).
- Cash flow +17.9/30.0
- DSCR +5.6/10.0
- ARV discount +5.2/15.0
- 1% rule +4.1/10.0
- Schools +3.6/10.0
- Livability +3.4/5.0
- Rent growth +2.5/5.0
- Condition / age +2.5/5.0
- Appreciation +0.0/10.0
$990,000
🖨 Deal sheet 📄 Offer letter ✓ Due diligence
Multi-family units
County records classify this as Multi-Family (2-4 Unit). Listing-text estimate: 3 units. confirmed
Listing remarks
Back on the market with a second chance at a rare find! A phenomenal triplex with high-income producing potential. Also an ideal layout for multi-generational living. This property consist of two massive 4-bedroom, 2.5 bathroom units and one spacious 3-bedroom, 2-bathroom unit. The upper units are tenant occupied, providing immediate rental income from day one. Designed for maximum convenience and low overhead, every unit features its own dedicated laundry room and private 2-car garage. Inside each unit are a spacious Living room and Dining area, with great kitchens that have abundant cabinetry and countertop space, plus spacious bathrooms equipped with accessible grab bars. Layout includes
Key facts
- Private 2-car garage
- Triplex
- 5,748 sq ft lot
Tags
Property features AI
Finance
- Other: Property zoned LAR4; Possession: Tenant rights; Disclosures: As Is; Trust/Conservatorship
- Financial info: Actual annual gross rent: $62,844; Gross operating income: $130,800; Net operating income: $54,417; Total annual expenses: $8,427; Gross rent multiplier: 6.5; Vacancy allowance: 5% ($6,540); Owner pays: Electric, gardener, water, other; Tenant pays: Gas, electric; Unit rents (projected): Unit 1 $3,900; Unit 2 $3,750; Unit 3 $3,250; Unit actual rents: Unit 2 $2,602; Unit 3 $2,635
- HOA & community: 3 units in complex
Exterior
- Parking: Attached garage and driveway; 6 garage spaces; 10 total parking spaces; 4 open parking spaces
- Security: Window bars; Smoke detector; Carbon monoxide detector
- Utilities: Public/District water; Sewer in street
- Home design: Residential income property; Triplex; Two total floors; One level listed as 'One Level'; Faces north
- Construction: Concrete slab foundation
- Exterior features: Walk street view; No other structures
Interior
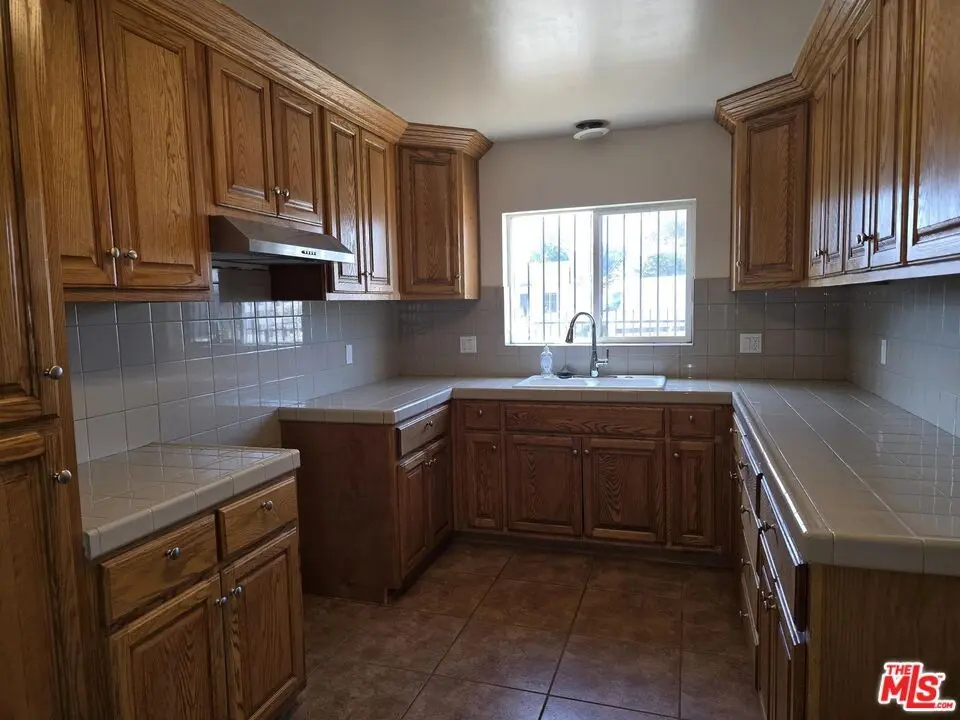
- Kitchen: Ceramic counters; Hood fan
- Bedrooms: Unit 1: 4 bedrooms; Unit 2: 4 bedrooms; Unit 3: 3 bedrooms
- Flooring: Carpeted floors; Tile floors
- Bathrooms: Shower stall; Shower over tub; Unit 1: 2.5 baths; Unit 2: 2.5 baths; Unit 3: 2.0 baths
- Heating & cooling: Natural gas heat; No cooling
- Interior features: Center hall; Living room; Walk-in closet; Ceiling fan; Hood fan; Grab bars in bathroom(s); Carbon monoxide detector; Smoke detector
- Laundry & utility: Laundry room inside; Gas dryer hookup
Neighborhood map
What this means for you Summary
Snapshot
- This is a 3 × 2-bed/?-bath units multifamily listed at $990k.
Deal economics
- At list price, monthly cash flow is $836 ($10k/yr) — positive. Per door: $279/mo.
- The deal already cash-flows at list — no discount required.
- To meet the 1% rule (rent ≥ 1% of price), the offer needs to be $897k (9.4% below list).
- Recommended offer: $897k (9.4% below list) — sets the bar for 1% rule.
- Cap rate 7.3% vs local median 2.1% in Los Angeles — top-decile yield for the area; either an underpriced asset or a hidden risk that comps aren't pricing in. Stress-test before assuming the spread holds.
Location & tenants
- Location reads 68/100 on livability (#273 in CA) — a middle-class / working-renter tenant base. Strengths: amenities A+, commute A+, employment B; Watch: health & safety C-, schools D+, crime F.
- Los Angeles Unified (urban): math 29% / reading 54% proficiency, ranked #223 of 517 in CA (top 43%) — families likely to look elsewhere, expect single-tenant / working-renter base with shorter leases; 67% free/reduced lunch — lower-income household profile, screen leases tightly.
- Market conditions: Rents flat; 161 active listings in the ZIP; 19,697 units permitted in Los Angeles County in 2024 (9,426 in 5+ unit buildings).
- At $8,972/mo this rent would consume 192% of the median local household income ($56k/yr) (locally 4550% of renters already pay >50% of income on rent) — very limited rent-growth headroom before tenants either downsize or default.
Forward outlook
- Local home prices are declining (-3.0%/yr); year-one equity from $7k of loan paydown is wiped out by about $30k of value loss. Plan a longer hold.
- Los Angeles County population projected at +9% by 2050 — modest demand growth; plan on rents tracking national, not racing it.
Negotiation context
- Only 14 days on market — expect competitive offers; lowballing is unlikely to land.
- 5 sale attempts since 3y ago with the ask held roughly flat each time — persistent listings suggest the price (not the market) is what's stuck; bring a comps-based counter.
Risks & watch-outs
- Climate carrying-cost: extreme-heat days projected 7→21/yr by 2055 (HVAC capex compounding) — expect insurance premiums to compound above CPI over the hold.
Questions for the listing agent
- Can we see the unit-by-unit rent roll, current vacancy, and any below-market leases? What's the average tenancy length?
- What capital expenditures (roof, boiler, parking lot, exteriors) have been made in the last 5 years, and what's planned in the next 2?
- Is there a deadline driving the sale (1031 exchange, divorce, estate, relocation)? That informs how much negotiation room exists.
- Schools are D-rated, which usually means shorter tenancies and higher turnover. Who's the typical renter profile here, and what's been the actual vacancy rate?
- Crime grade is F in this area — have there been break-ins, vandalism, or insurance claims at this property in the last 3 years? What carrier currently insures it and at what premium?
- The area grade is low — what's the realistic commute time and amenity access for the typical tenant pool here? Any planned neighborhood developments (good or bad) we should know about?
- What's the average days-on-market for RENTAL listings here right now (not sales)? A rising rental-DOM trend means longer vacancies and softer asking-rent achievability than the comps imply.
- What's the recent tenant-quality profile in this submarket — average credit score on applications, eviction rate, late-payment / NSF rate, and stable-employment percentage? A property-management company in the area should have these aggregated.
- How much new apartment / multifamily construction is in the pipeline within 1–3 miles? Heavy new supply (>2% of stock underway) typically softens rents 12–24 months out; light construction supports rent growth.
Investment metrics
- 1% rule
- 0.91% ✗
- Cap rate
- 7.31%
- Cash-on-cash
- 3.62%
- DSCR
- 1.16
- GRM
- 9.2
CMA / ARV
- ARV (on-the-fly)
- $941,460
- Comps found
- 1
Show comp detail 1 sale within ~0.75 mi
| Address | Dist | Beds/Ba | Sqft | Sold | Price | $/sf | Match |
|---|---|---|---|---|---|---|---|
| 212 W 84th | 0.72mi | 8/7.0 (+1) | 3,952 (-7%) | 5mo | $875,000 | $221 | 33 |
Match score weights: distance 35% · size 25% · config 20% · recency 20%. Top-matched comps best support the ARV.
Projected returns pro-forma
-3.0% appreciation · 0.11% rent growth · sell at horizon
- IRR
- -13.7%
- Equity multiple
- 0.52×
- Total profit
- $-132,739
- Equity at exit
- $147,612
- IRR
- -9.8%
- Equity multiple
- 0.47×
- Total profit
- $-146,126
- Equity at exit
- $85,597
Cash invested: $277,200 (down + closing). Projections, not guarantees.
Landlord ↔ Tenant lean methodology
- Overall (CITY)
- 0 Strongly Tenant-Friendly
- State California
- 18 Strongly Tenant-Friendly · D+13
- County
- — inherits STATE
- City Los Angeles
- 0 Strongly Tenant-Friendly · D+22
ZIP-level market 90003
- Rents YoY
- 0.1%
- Active inventory
- 161
- Price-to-rent
- 27.6×
Monthly cashflow live
- Estimated rent
- $8,972 high interval (Pro) →
- Mortgage (P&I)
- −$5,192
- Tax from tax record
- −$647 /mo · $7,768/yr
- Insurance
- −$412
- HOA
- −$0
- Vacancy / Maint / Mgmt
- −$1,884
- Net cashflow
- $836
Break-even live
3-unit breakdown (identical units grouped — click to expand)
| Units | Beds | Baths | Est. rent |
|---|---|---|---|
| 3× units | 2 | — | $8,973 |
| #1 | 2 | — | $2,991 |
| #2 | 2 | — | $2,991 |
| #3 | 2 | — | $2,991 |
| Total (3 units) | $8,972 | ||
UW: 25.0% down · 7.5% · 30yr · 1.5% tax · 5.0% vac · 8.0% maint · 8.0% mgmt
Financing live
Cash to close
- Down payment
- $247,500
- Closing costs
- $29,700
- Reserves months
- —
- Total cash needed
- —
Loan-product check · same deal, 3 products live
Conventional
25% down · 7.5% · 30yr
- Down + closing
- —
- Monthly P&I
- —
- Monthly cashflow
- —
- DSCR
- —
- Eligible?
- —
Personal DTI + credit; lowest rate.
DSCR
20% down · 8.5% · 30yr
- Down + closing
- —
- Monthly P&I
- —
- Monthly cashflow
- —
- DSCR
- —
- Eligible?
- —
No personal income docs; deal must DSCR.
Hard money
10% down · 12.0% · 12mo
- Down + closing
- —
- Monthly P&I
- —
- Monthly cashflow
- —
- DSCR
- —
- Eligible?
- —
Short-term bridge; refi at stabilization.
Listing history 9 events
-
2026-06-18days on market $990,000 Active 14 DOM
-
2026-06-17days on market $990,000 Active 13 DOM
-
2026-06-16days on market $990,000 Active 12 DOM
-
2026-06-15days on market $990,000 Active 11 DOM
-
2026-06-13days on market $990,000 Active 9 DOM
-
2026-06-09days on market $990,000 Active 5 DOM
-
2026-06-08days on market $990,000 Active 4 DOM
-
2026-06-07remarks 699-char remark
-
2026-06-07$990,000 Active 3 DOM
ⓘ Source: listings_history table (triggers on properties + properties_extension) + one-shot
backfill from property_details.listing_events for pre-trigger history.
Tax reassessment forecast CA · Resets to sale price
- Current annual tax
- $7,768 · $647/mo
- Projected year-2 tax
- $7,768 · $647/mo
- Expected delta
- $0/yr ($0/mo · 0.0%)
ⓘ Screening estimate from a state-policy table — verify with the county assessor before closing.
Climate risk First Street
- Flood 1/10 Low FEMA zone X (unshaded) · 0% chance over 30 yrs
- Wildfire 1/10 Low
- Heat 5/10 Major 7 d/yr ≥88°F today · 21 d/yr by 30 yrs out
- Wind 1/10 Low
- Air quality 5/10 Major 7 unhealthy d/yr today · 7 by 30 yrs out
Nearby sold comps map
Loading sold comps map…
Walkable amenities ~0.75 mi
Loading nearby amenities…
Taxation est. · year 1
- Rental income
- $107,664
- − Mortgage interest
- −$55,455
- − Property taxes
- −$7,768
- − Insurance
- −$4,950
- − Repairs & maintenance
- −$8,613
- − Management
- −$8,613
- − Depreciation
- −$28,800
- Taxable loss
- −$6,536
- Est. tax savings @ 24.0%
- +$1,569
- After-tax cash flow
- $11,605/yr
For passive investors: Depreciation is non-cash, so a rental often shows a tax loss while cash-flowing — sheltering income. Rental losses are passive: they offset passive income freely, and up to $25,000/yr can offset ordinary (W-2) income if you actively participate and your MAGI is under $100k (phasing out to $0 by $150k); unused losses carry forward. On sale, claimed depreciation is recaptured at up to 25%, and gains may owe capital-gains tax (a 1031 exchange can defer both). Figures are a year-1 estimate at your 24.0% rate — not tax advice; consult a CPA.
Schools (NCES district)
- District
- Los Angeles Unified
- NCES district ID
- 0622710
- Math proficiency
- 29% ▼ -4.00%
- Reading proficiency
- 54% ▲ 10.00%
- Median HH income
- $50,403
- Composite
- 35.67/100
- National rank
- #4875
- State rank
- #223 of 517 in CA
Livability — Los Angeles
- Score
- 68/100
- State rank
- #273
- US rank
- #9237
Category grades
Schools grade is shown separately in the Schools card above.
Census & demographics
- Census place
- Los Angeles, CA
- County
- Los Angeles County · 9,444,647 people
- City population
- 3,838,149
- Metro
- Los Angeles-Long Beach-Anaheim, CA
- Population (ZIP)
- 70,065
- Household income
- $56,030
- Rent vs Own
- Severe rent burden
- 4550.0
Population outlook (Los Angeles County) Hauer SSP2
- Today (2025)
- 10,940,515 people
- By 2030
- 11,256,481 · +2.9%
- By 2040
- 11,729,929 · +7.2%
- By 2050
- 11,948,407 · +9.2%
- By 2075
- 11,818,114 · +8.0%
- By 2100
- 10,842,928 · -0.9%
Race, ethnicity, and origin ACS 2023
- Neighborhood character
- Predominantly Hispanic (81%)
- Race & ethnicity
- Hispanic / Latino 81% Two or more races 20% Black 16% Native American 1%
- Hispanic origin (detail)
- Mexican 51%
- Common ancestry
- British 1%
- Foreign-born
- 40% · Canada
- Languages at home
- 24% English-only · Spanish 75%
Political lean MEDSL · Los Angeles
- 2024 margin
- Solid D (+32.9) · D 64.8% · R 31.9% · Other 3.3%
- 2008→2024 swing
- -7.4pp toward R · 2008: 40.4pp · 2024: 32.9pp
- All cycles
- 2024: D+32.9 2020: D+44.2 2016: D+48.0 2012: D+40.0 2008: D+40.4
Not yet ingested
- Civics
- —
Market trends
- HPI YoY
- ▼ -785.95%
- Current HPI
- 512.5667
- Rent YoY
- ▲ 0.11%
- Metro
- Los Angeles-Long Beach-Anaheim, CA
- State GDP YoY
- ▲ 3.21%
- F500 in state
- 116
Industry mix (Fortune 500 HQ in CA)
| Industry | F500 HQs | Revenue |
|---|---|---|
| Technology | 27 | $1,492B |
|
||
| Financial Services | 3 | $174B |
|
||
| Retail | 3 | $44B |
|
||
| Insurance | 3 | $26B |
|
||
| Media / Entertainment | 2 | $115B |
|
||
| Pharmaceuticals / Biotech | 2 | $62B |
|
||
Price history
-38.1% since first listed15 events — show timeline
- 2026-06-03 Listed $990,000 TheMLS
- 2025-11-06 Relisted — TheMLS
- 2025-07-18 Price Changed — TheMLS
- 2025-04-21 Listed — TheMLS
- 2024-05-06 Price Changed $1,279,000 CRMLS
- 2024-04-19 Price Changed $1,290,000 CRMLS
- 2024-03-22 Price Changed $1,295,000 CRMLS
- 2024-03-01 Relisted — CRMLS
- 2024-03-01 Price Changed $1,300,000 CRMLS
- 2024-02-29 Listing Removed — CRMLS
- 2024-02-06 Price Changed $1,300,050 CRMLS
- 2023-11-22 Price Changed $1,300,000 CRMLS
- 2023-11-08 Price Changed $1,350,000 CRMLS
- 2023-10-18 Price Changed $1,399,000 CRMLS
- 2023-10-18 Listed $1,600,000 CRMLS
Property tax history
+30.4%/yrLatest (2025): $7,768 · +1.9% YoY. Source: county tax records.
Cash-flow waterfall
monthlySold comps — $/sqft
last 12 mo · ≤1 miLoading sold comps…