 Duplex
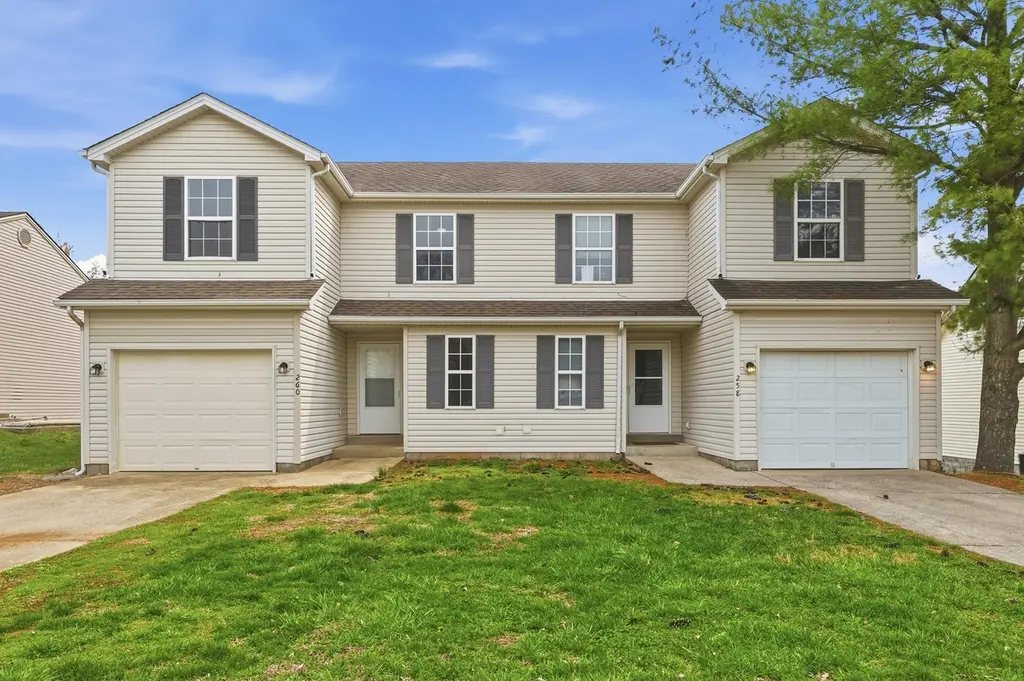
258-260 Elkhorn Meadows Dr · Georgetown, KY
Flood risk 4/10 · Minor
- FEMA flood zone
- X (unshaded)
- Chance of flooding over 30 yrs
- 0.22%
- Est. flood insurance / yr
- $507 – $1,088
Fire risk 3/10 · Minor
- Est. fire insurance / yr
- $839 – $1,559
Heat risk 4/10 · Minor
- Hot days now (above 102°F)
- 7 days/yr
- Hot days in 30 yrs
- 19 days/yr
Wind risk 2/10 · Minimal
- Chance of severe wind over 30 yrs
- 2.0%
Air-quality risk 2/10 · Minimal
- Unhealthy air days now
- 0 days/yr
- Unhealthy air days in 30 yrs
- 1 days/yr
Risk factors via First Street. Map © Google.
Why this score? — see what drove the D- grade
The composite is a weighted blend of 9 inputs, each scored 0–100. Each bar is that input's sub-score; the figure is the points it added to the 100-point composite (weight × sub-score).
- Cash flow +13.5/30.0
- ARV discount +5.8/15.0
- DSCR +4.1/10.0
- Livability +3.9/5.0
- Schools +3.4/10.0
- Rent growth +3.2/5.0
- 1% rule +2.8/10.0
- Condition / age +2.5/5.0
- Appreciation +0.0/10.0
$449,900
🖨 Deal sheet (PDF) 📄 Offer letter ✓ Due diligence
Multi-family units
County records classify this as Multi-Family (2-4 Unit). Listing-text estimate: 2 units. confirmed
Listing remarks
STOP SCROLLING — This Duplex is a GAME CHANGER! Looking for income, flexibility, AND style? This fully renovated duplex checks every box! Live in one side & let the other help pay your mortgage Or add a turnkey investment to your portfolio 3 Bedrooms | 2.5 Baths EACH side 1-Car Garage ALL NEW: Cabinets, countertops, flooring, paint & trim Stainless steel appliances Water heaters (both sides) HVAC approx. 5 years Replacement windows Gutter guards + insulated crawl space Move-in ready. Income ready. Stress-free. Opportunities like this don't last — message me before it's gone!
Key facts
- Gutter guards
- Replacement windows
- 8,712 sq ft lot
Tags
Neighborhood map
What this means for you Summary
Snapshot
- This is a 2 × 3.0-bed/2.5-bath units multifamily listed at $450k.
Deal economics
- At list price, monthly cash flow is $14 ($170/yr) — positive. Per door: $7/mo.
- The deal already cash-flows at list — no discount required.
- To meet the 1% rule (rent ≥ 1% of price), the offer needs to be $349k (22.4% below list).
- Recommended offer: $349k (22.4% below list) — sets the bar for 1% rule.
- Cap rate 6.3% vs local median 3.5% in Georgetown — top-decile yield for the area; either an underpriced asset or a hidden risk that comps aren't pricing in. Stress-test before assuming the spread holds.
Location & tenants
- Location reads 78/100 on livability (#75 in KY, #2,338 nationally) — a middle-class / working-renter tenant base. Strengths: cost of living A+, housing A+, health & safety A+; Watch: amenities D, commute F.
- Scott County (town): math 32% / reading 44% proficiency, ranked #31 of 165 in KY (top 19%) — families likely to look elsewhere, expect single-tenant / working-renter base with shorter leases.
- Zoned schools: Eastern Elementary School (math 39% / reading 37%, grade F, #242 of 676 statewide, top 37%, 459 students, 34% FRL); Royal Spring Middle School (math 34% / reading 54%, grade D, #40 of 217 statewide, top 19%, 726 students, 44% FRL); Great Crossing High School (math 36% / reading 40%, grade F, #55 of 254 statewide, top 22%, 1,790 students, 43% FRL) — zoned schools at 40% FRL track the district average.
- Market conditions: Rents rising (+3.0%/yr); 437 active listings in the ZIP; solid renter incomes; 546 units permitted in Scott County in 2024 (98 in 5+ unit buildings).
- At $3,489/mo this rent would consume 49% of the median local household income ($85k/yr) (locally 993% of renters already pay >50% of income on rent) — very limited rent-growth headroom before tenants either downsize or default.
Forward outlook
- Local home prices are declining (-3.0%/yr); year-one equity from $3k of loan paydown is wiped out by about $13k of value loss. Plan a longer hold.
- Scott County population projected at +45% by 2050 — long-run rental-demand tailwind backs the buy-and-hold thesis.
Negotiation context
- It's been on market 31 days — a 3% lower offer ($436k) is reasonable based on typical stale-listing flexibility.
- 5 sale attempts since 17y ago; this cycle's ask has dropped $50k (10%) from the opening price — seller is motivated, your offer sets the floor, not the list.
Questions for the listing agent
- It's been on market 31 days. Have you received any prior offers? Is the seller open to a 22% concession, seller financing, or rate buy-down credit?
- Can we see the unit-by-unit rent roll, current vacancy, and any below-market leases? What's the average tenancy length?
- What capital expenditures (roof, boiler, parking lot, exteriors) have been made in the last 5 years, and what's planned in the next 2?
- Is there a deadline driving the sale (1031 exchange, divorce, estate, relocation)? That informs how much negotiation room exists.
- Schools are D-rated, which usually means shorter tenancies and higher turnover. Who's the typical renter profile here, and what's been the actual vacancy rate?
- The area grade is low — what's the realistic commute time and amenity access for the typical tenant pool here? Any planned neighborhood developments (good or bad) we should know about?
- What's the average days-on-market for RENTAL listings here right now (not sales)? A rising rental-DOM trend means longer vacancies and softer asking-rent achievability than the comps imply.
- What's the recent tenant-quality profile in this submarket — average credit score on applications, eviction rate, late-payment / NSF rate, and stable-employment percentage? A property-management company in the area should have these aggregated.
- How much new apartment / multifamily construction is in the pipeline within 1–3 miles? Heavy new supply (>2% of stock underway) typically softens rents 12–24 months out; light construction supports rent growth.
Investment metrics
- 1% rule
- 0.78% ✗
- Cap rate
- 6.33%
- Cash-on-cash
- 0.13%
- DSCR
- 1.01
- GRM
- 10.7
CMA / ARV
- ARV (on-the-fly)
- $433,836
- Comps found
- 1
Show comp detail 1 sale within ~0.75 mi
| Address | Dist | Beds/Ba | Sqft | Sold | Price | $/sf | Match |
|---|---|---|---|---|---|---|---|
| 258-260 Elkhorn Meadows Dr | 0.00mi | 6/5.0 | 2,751 (-1%) | 1mo | $430,000 | $156 | 98 |
Match score weights: distance 35% · size 25% · config 20% · recency 20%. Top-matched comps best support the ARV.
Projected returns pro-forma
-3.0% appreciation · 3.0% rent growth · sell at horizon
- IRR
- -16.1%
- Equity multiple
- 0.43×
- Total profit
- $-72,175
- Equity at exit
- $67,082
- IRR
- -7.9%
- Equity multiple
- 0.50×
- Total profit
- $-62,391
- Equity at exit
- $38,899
Cash invested: $125,972 (down + closing). Projections, not guarantees.
Landlord ↔ Tenant lean methodology
- Overall (STATE)
- 83 Strongly Landlord-Friendly
- State Kentucky
- 83 Strongly Landlord-Friendly · R+16
- County
- — inherits STATE
- City
- — inherits STATE
ZIP-level market 40324
- Rents YoY
- 3.0%
- Active inventory
- 437
- Price-to-rent
- 21.5×
Monthly cashflow live
- Estimated rent
- $3,489 high interval (Pro) →
- Mortgage (P&I)
- −$2,359
- Tax from tax record
- −$195 /mo · $2,345/yr
- Insurance
- −$187
- HOA
- −$0
- Vacancy / Maint / Mgmt
- −$733
- Net cashflow
- $14
Break-even live
Sensitivity live
| Price | -10% $269 | -5% $141 | +0% $14 | +5% $-113 | +10% $-241 |
|---|---|---|---|---|---|
| Rent | -10% $-261 | -5% $-124 | +0% $14 | +5% $152 | +10% $290 |
| Rate | -1.0pp $241 | -0.5pp $129 | base $14 | +0.5pp $-102 | +1.0pp $-221 |
2-unit breakdown (identical units grouped — click to expand)
| Units | Beds | Baths | Est. rent |
|---|---|---|---|
| 2× units | 3.0 | 2.5 | $3,490 |
| #1 | 3.0 | 2.5 | $1,745 |
| #2 | 3.0 | 2.5 | $1,745 |
| Total (2 units) | $3,489 | ||
UW: 25.0% down · 7.5% · 30yr · 1.5% tax · 5.0% vac · 8.0% maint · 8.0% mgmt
Financing live
Cash to close
- Down payment
- $112,475
- Closing costs
- $13,497
- Reserves months
- —
- Total cash needed
- —
Loan-product check · same deal, 3 products live
Conventional
25% down · 7.5% · 30yr
- Down + closing
- —
- Monthly P&I
- —
- Monthly cashflow
- —
- DSCR
- —
- Eligible?
- —
Personal DTI + credit; lowest rate.
DSCR
20% down · 8.5% · 30yr
- Down + closing
- —
- Monthly P&I
- —
- Monthly cashflow
- —
- DSCR
- —
- Eligible?
- —
No personal income docs; deal must DSCR.
Hard money
10% down · 12.0% · 12mo
- Down + closing
- —
- Monthly P&I
- —
- Monthly cashflow
- —
- DSCR
- —
- Eligible?
- —
Short-term bridge; refi at stabilization.
Listing history 14 events
-
2026-04-22status Pending
-
2026-03-24price $449,900
-
2026-03-21$499,900 Active
-
2025-07-14historical
-
2025-06-02$394,900 Active
-
2019-02-04soldstatus $502,500
-
2018-08-09soldstatus $525,000
-
2017-01-12historical
-
2016-04-19$92,000 Active
-
2015-09-11historical
-
2015-08-26$92,000 Active
-
2009-04-27soldstatus $135,000
-
2009-03-30historical
-
2009-01-14$139,900
ⓘ Source: listings_history table (triggers on properties + properties_extension) + one-shot
backfill from property_details.listing_events for pre-trigger history.
Tax reassessment forecast KY · Resets to sale price
- Current annual tax
- $2,345 · $195/mo
- Projected year-2 tax
- $3,869 · $322/mo
- Expected delta
- +$1,525/yr (+$127/mo · 65.0%)
ⓘ Screening estimate from a state-policy table — verify with the county assessor before closing.
Climate risk First Street
- Flood 4/10 Moderate FEMA zone X (unshaded) · 22% chance over 30 yrs
- Wildfire 3/10 Moderate
- Heat 4/10 Moderate 7 d/yr ≥102°F today · 19 d/yr by 30 yrs out
- Wind 2/10 Low 2% chance of damaging wind over 30 yrs
- Air quality 2/10 Low 0 unhealthy d/yr today · 1 by 30 yrs out
Nearby sold comps map
Loading sold comps map…
Walkable amenities ~0.75 mi
Loading nearby amenities…
Taxation est. · year 1
- Rental income
- $41,868
- − Mortgage interest
- −$25,201
- − Property taxes
- −$2,345
- − Insurance
- −$2,250
- − Repairs & maintenance
- −$3,349
- − Management
- −$3,349
- − Depreciation
- −$13,088
- Taxable loss
- −$7,714
- Est. tax savings @ 24.0%
- +$1,851
- After-tax cash flow
- $2,021/yr
For passive investors: Depreciation is non-cash, so a rental often shows a tax loss while cash-flowing — sheltering income. Rental losses are passive: they offset passive income freely, and up to $25,000/yr can offset ordinary (W-2) income if you actively participate and your MAGI is under $100k (phasing out to $0 by $150k); unused losses carry forward. On sale, claimed depreciation is recaptured at up to 25%, and gains may owe capital-gains tax (a 1031 exchange can defer both). Figures are a year-1 estimate at your 24.0% rate — not tax advice; consult a CPA.
Schools (NCES district)
- District
- Scott County
- NCES district ID
- 2105260
- Math proficiency
- 32% ▼ -14.00%
- Reading proficiency
- 44% ▼ -16.00%
- Median HH income
- $61,324
- Composite
- 33.87/100
- National rank
- #5348
- State rank
- #31 of 165 in KY
Livability — Georgetown
- Score
- 78/100
- State rank
- #75
- US rank
- #2338
Category grades
Schools grade is shown separately in the Schools card above.
Census & demographics
- Census place
- Georgetown, KY
- County
- Scott County · 53,406 people
- City population
- 53,406
- Metro
- Lexington-Fayette, KY
- Population (ZIP)
- 53,406
- Household income
- $85,110
- Rent vs Own
- Severe rent burden
- 993.0
Population outlook (Scott County) Hauer SSP2
- Today (2025)
- 63,814 people
- By 2030
- 69,637 · +9.1%
- By 2040
- 81,315 · +27.4%
- By 2050
- 92,677 · +45.2%
- By 2075
- 118,956 · +86.4%
- By 2100
- 136,792 · +114.4%
Race, ethnicity, and origin ACS 2023
- Neighborhood character
- Predominantly White (83%)
- Race & ethnicity
- White 83% Hispanic / Latino 6% Two or more races 6% Black 5%
- Hispanic origin (detail)
- Mexican 4%
- Common ancestry
- Italian 2% Serbian 2% Slovak 2%
- Foreign-born
- 3% · Canada
- Languages at home
- 94% English-only · Spanish 4%
Political lean MEDSL · Scott
- 2024 margin
- Strong R (+27.7) · D 35.3% · R 63.0% · Other 1.7%
- 2008→2024 swing
- -7.1pp toward R · 2008: -20.6pp · 2024: -27.7pp
- All cycles
- 2024: R+27.7 2020: R+24.9 2016: R+30.4 2012: R+25.0 2008: R+20.6
Not yet ingested
- Civics
- —
Market trends
- HPI YoY
- ▼ -105.49%
- Current HPI
- 187.89
- Rent YoY
- ▲ 3.00%
- Metro
- Lexington-Fayette, KY
- State GDP YoY
- ▲ 1.81%
- F500 in state
- 4
Industry mix (Fortune 500 HQ in KY)
| Industry | F500 HQs | Revenue |
|---|---|---|
| Healthcare | 1 | $118B |
|
||
| Food / Beverage | 1 | $7B |
|
||
Price history
+221.6% since first listed14 events — show timeline
- 2026-04-22 Pending — ImagineMLS
- 2026-03-24 Price Changed $449,900 ImagineMLS
- 2026-03-21 Listed $499,900 ImagineMLS
- 2025-07-14 Listing Removed — ImagineMLS
- 2025-06-02 Listed $394,900 ImagineMLS
- 2019-02-04 Sold (Public Records) $502,500 Public Records
- 2018-08-09 Sold (Public Records) $525,000 Public Records
- 2017-01-12 Listing Removed — ImagineMLS
- 2016-04-19 Listed $92,000 ImagineMLS
- 2015-09-11 Listing Removed — ImagineMLS
- 2015-08-26 Listed $92,000 ImagineMLS
- 2009-04-27 Sold (MLS) $135,000 ImagineMLS
- 2009-03-30 Listing Removed — ImagineMLS
- 2009-01-14 Listed $139,900 ImagineMLS
Property tax history
+5.4%/yrLatest (2025): $2,345 · +10.3% YoY. Source: county tax records.
Cash-flow waterfall
monthlySold comps — $/sqft
last 12 mo · ≤1 miLoading sold comps…