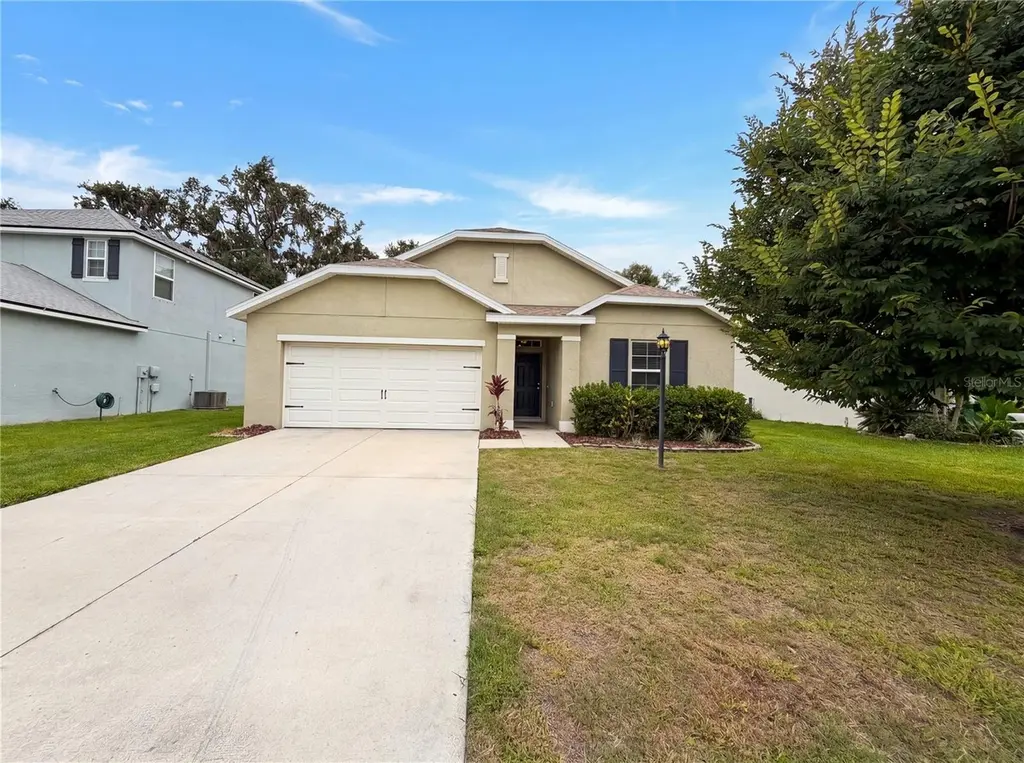
5805 71st St E · Ellenton, FL
Flood risk 1/10 · Minimal
- FEMA flood zone
- X (unshaded)
- Chance of flooding over 30 yrs
- 0.0%
- Est. flood insurance / yr
- $507 – $1,088
Fire risk 3/10 · Minor
- Est. fire insurance / yr
- $947 – $1,759
Heat risk 10/10 · Severe
- Hot days now (above 107°F)
- 7 days/yr
- Hot days in 30 yrs
- 30 days/yr
Wind risk 10/10 · Severe
- Chance of severe wind over 30 yrs
- 99.0%
Air-quality risk 3/10 · Minor
- Unhealthy air days now
- 3 days/yr
- Unhealthy air days in 30 yrs
- 3 days/yr
Risk factors via First Street. Map © Google.
Why this score? — see what drove the D grade
The composite is a weighted blend of 9 inputs, each scored 0–100. Each bar is that input's sub-score; the figure is the points it added to the 100-point composite (weight × sub-score).
- Cash flow +12.7/30.0
- ARV discount +12.7/15.0
- Schools +4.4/10.0
- DSCR +3.8/10.0
- Livability +3.8/5.0
- 1% rule +3.1/10.0
- Condition / age +2.5/5.0
- Rent growth +1.8/5.0
- Appreciation +0.0/10.0
$325,000
🖨 Deal sheet 📄 Offer letter ✓ Due diligence
Listing remarks MLS
Short Sale. Great value in this newer home with 4 bedroom, 2 bath, 2 car garage located in desirable Crystal Lakes II subdivision. Solid block construction and over 1750 square feet of living area. Large fenced rear yard with partial water view. Conveniently located and a short drive to the beaches, outlet mall, St. Pete, Tampa & Sarasota. Schedule a showing today!
Key facts
- Walk-in closet
- Functional island
- Exterior patio
Tags
Property features AI
Finance
- Other: Property type: Residential — Single Family Residence; Zoning: PDR; Lot with paved road access; Total living area approximately 1748 square feet
- Financial info: Lease restrictions apply
- HOA & community: HOA with a monthly fee of $87 (Association: Network Transaction Solutions); Association approval required; Association fee includes: Other; Pets allowed
Exterior
- Parking: Driveway; Attached 2-car garage
- Security: Owned security system
- Utilities: Public water; Public sewer; Electricity available; Natural gas available
- Home design: Single-family residence; One story; North-facing
- Construction: Block and stucco construction; Shingle roof; Slab foundation; Built on a 0.15-acre lot
- Exterior features: Other exterior features; Other fencing
Interior
- Kitchen: Dishwasher; Microwave; Other kitchen features
- Bedrooms: 4 bedrooms
- Flooring: Tile
- Bathrooms: 2 full bathrooms
- Heating & cooling: Central heating (electric); Central air conditioning
- Interior features: Ceiling fans; Living/dining layout
- Laundry & utility: Dedicated laundry room; Other laundry features
Neighborhood map
What this means for you Summary
Snapshot
- This is a 4-bed/2.0-bath single-family listed at $325k.
Deal economics
- At list price, monthly cash flow is $-38 ($-458/yr) — negative.
- To cash-flow at today's rent, offer at most $318k (2.1% below list).
- To meet the 1% rule (rent ≥ 1% of price), the offer needs to be $264k (18.8% below list).
- Recommended offer: $264k (18.8% below list) — sets the bar for 1% rule.
- Cap rate 6.2% vs local median 4.5% in Ellenton — top-decile yield for the area; either an underpriced asset or a hidden risk that comps aren't pricing in. Stress-test before assuming the spread holds.
Location & tenants
- Location reads 76/100 on livability (#232 in FL, #3,666 nationally) — a middle-class / working-renter tenant base. Strengths: cost of living A+, housing A+, health & safety A+; Watch: schools D+, amenities F, commute F.
- Manatee (suburban): math 54% / reading 50% proficiency, ranked #26 of 73 in FL (top 36%) — acceptable for families but not a draw, mixed tenant base, ~2y average lease.
- Market conditions: Rents soft (-3.0%/yr); 1160 active listings in the ZIP; 14 comparable units currently listed for rent nearby; rentals at typical pace (median 21d on market — plan ~3-4 weeks tenant-placement turnaround); solid renter incomes; 7,472 units permitted in Manatee County in 2024 (1,782 in 5+ unit buildings).
- This rent runs 41% of the median local income ($78k/yr) — at the standard rent-burdened threshold; future hikes will face affordability resistance.
Forward outlook
- Local home prices are declining (-3.0%/yr); year-one equity from $2k of loan paydown is wiped out by about $10k of value loss. Plan a longer hold.
- Manatee County population projected at +43% by 2050 — long-run rental-demand tailwind backs the buy-and-hold thesis.
Negotiation context
- Only 10 days on market — expect competitive offers; lowballing is unlikely to land.
- 3 sale attempts since 11y ago with the ask held roughly flat each time — persistent listings suggest the price (not the market) is what's stuck; bring a comps-based counter.
- Current owner paid $220k; 47% above their basis — modest negotiation headroom, anchor on the comps not their cost.
Risks & watch-outs
- Climate carrying-cost: severe wind risk, 99% chance of damaging wind over 30y; extreme-heat days projected 7→30/yr by 2055 (HVAC capex compounding) — expect insurance premiums to compound above CPI over the hold.
Questions for the listing agent
- What do current leases actually rent for vs. the listed asking? Can we see a recent rent roll and the last 12 months of T-12 income?
- What does the HOA fee cover, when was the last increase, and are there any pending special assessments or reserve-fund shortfalls?
- Is there a deadline driving the sale (1031 exchange, divorce, estate, relocation)? That informs how much negotiation room exists.
- Schools are D-rated, which usually means shorter tenancies and higher turnover. Who's the typical renter profile here, and what's been the actual vacancy rate?
- The area grade is low — what's the realistic commute time and amenity access for the typical tenant pool here? Any planned neighborhood developments (good or bad) we should know about?
- What's the average days-on-market for RENTAL listings here right now (not sales)? A rising rental-DOM trend means longer vacancies and softer asking-rent achievability than the comps imply.
- What's the recent tenant-quality profile in this submarket — average credit score on applications, eviction rate, late-payment / NSF rate, and stable-employment percentage? A property-management company in the area should have these aggregated.
- How much new for-sale + rental construction is in the pipeline within 1–3 miles? Heavy new supply typically softens prices + rents 12–24 months out; constrained supply supports both.
Investment metrics
- 1% rule
- 0.81% ✗
- Cap rate
- 6.15%
- Cash-on-cash
- -0.50%
- DSCR
- 0.98
- GRM
- 10.3
CMA / ARV
- ARV (on-the-fly)
- $367,080
- Comps found
- 12
Show comp detail 12 sales within ~0.75 mi
| Address | Dist | Beds/Ba | Sqft | Sold | Price | $/sf | Match |
|---|---|---|---|---|---|---|---|
| 5014 72nd St E | 0.50mi | 3/2.0 (-1) | 1,717 (-2%) | 1mo | $308,000 | $179 | 68 |
| 7170 50th Avenue Cir E | 0.47mi | 3/2.0 (-1) | 1,717 (-2%) | 3mo | $360,000 | $210 | 67 |
| 7181 50th Avenue Cir E | 0.54mi | 3/2.0 (-1) | 1,713 (-2%) | 0mo | $365,000 | $213 | 66 |
| 5220 Lakehurst Ct | 0.68mi | 3/2.0 (-1) | 1,713 (-2%) | 1mo | $360,000 | $210 | 59 |
| 6201 63rd Ave E | 0.56mi | 4/2.0 | 1,602 (-8%) | 3mo | $360,000 | $225 | 58 |
| 6412 Kenava Loop | 0.50mi | 4/2.5 | 1,866 (+7%) | 8mo | $390,000 | $209 | 57 |
| 6215 65th Pl E | 0.63mi | 3/2.0 (-1) | 1,638 (-6%) | 3mo | $327,500 | $200 | 53 |
| 5320 Lakehurst Ct | 0.71mi | 3/2.0 (-1) | 1,713 (-2%) | 7mo | $398,000 | $232 | 53 |
| 6211 65th Pl E | 0.64mi | 3/2.0 (-1) | 1,585 (-9%) | 4mo | $365,000 | $230 | 46 |
| 5217 Levana St | 0.67mi | 3/2.0 (-1) | 1,554 (-11%) | 4mo | $306,000 | $197 | 42 |
| 6814 67th Street Cir E | 0.72mi | 3/2.0 (-1) | 1,506 (-14%) | 5mo | $375,000 | $249 | 34 |
| 6837 67th Street Cir E | 0.72mi | 3/2.0 (-1) | 1,498 (-14%) | 8mo | $312,000 | $208 | 31 |
Match score weights: distance 35% · size 25% · config 20% · recency 20%. Top-matched comps best support the ARV.
Projected returns pro-forma
-3.0% appreciation · 0.0% rent growth · sell at horizon
- IRR
- -20.4%
- Equity multiple
- 0.31×
- Total profit
- $-62,864
- Equity at exit
- $48,459
- IRR
- -21.5%
- Equity multiple
- 0.03×
- Total profit
- $-87,902
- Equity at exit
- $28,100
Cash invested: $91,000 (down + closing). Projections, not guarantees.
Landlord ↔ Tenant lean methodology
- Overall (STATE)
- 87 Strongly Landlord-Friendly
- State Florida
- 87 Strongly Landlord-Friendly · R+3
- County
- — inherits STATE
- City
- — inherits STATE
ZIP-level market 34221
- Rents YoY
- -3.0%
- Active inventory
- 1160
- Price-to-rent
- 10.3×
Monthly cashflow live
- Estimated rent
- $2,639 high interval (Pro) →
- Mortgage (P&I)
- −$1,704
- Tax from tax record
- −$196 /mo · $2,351/yr
- Insurance
- −$135
- HOA
- −$87
- Vacancy / Maint / Mgmt
- −$554
- Net cashflow
- $-38
Break-even live
UW: 25.0% down · 7.5% · 30yr · 1.5% tax · 5.0% vac · 8.0% maint · 8.0% mgmt
Financing live
Cash to close
- Down payment
- $81,250
- Closing costs
- $9,750
- Reserves months
- —
- Total cash needed
- —
Loan-product check · same deal, 3 products live
Conventional
25% down · 7.5% · 30yr
- Down + closing
- —
- Monthly P&I
- —
- Monthly cashflow
- —
- DSCR
- —
- Eligible?
- —
Personal DTI + credit; lowest rate.
DSCR
20% down · 8.5% · 30yr
- Down + closing
- —
- Monthly P&I
- —
- Monthly cashflow
- —
- DSCR
- —
- Eligible?
- —
No personal income docs; deal must DSCR.
Hard money
10% down · 12.0% · 12mo
- Down + closing
- —
- Monthly P&I
- —
- Monthly cashflow
- —
- DSCR
- —
- Eligible?
- —
Short-term bridge; refi at stabilization.
Rent comps 14 comps
| Address | Beds | Baths | Sqft | Rent | $/sqft | DOM | Units | Dist |
|---|---|---|---|---|---|---|---|---|
| 6109 63rd Ave E Palmetto, FL | 3.0 | 2.0 | 1295 | $1,960 | $1.51 | 2d | 1 | 0.65mi |
| 6117 Tremeza Pl Palmetto, FL | 4.0 | 2.0 | 1936 | $2,321 | $1.20 | 3d | 1 | 0.78mi |
| 7127 48th Ave E Palmetto, FL | 4.0 | 2.5 | 2113 | $1,800 | $0.85 | 23d | 1 | 0.90mi |
| 8132 Tea Olive Ter Palmetto, FL | 4.0 | 3.0 | 1698 | $2,500 | $1.47 | 23d | 1 | 0.96mi |
| 5410 Badini Way Palmetto, FL | 4.0 | 2.0 | 1740 | $2,500 | $1.44 | 3d | 1 | 0.99mi |
| 5413 Badini Way Palmetto, FL | 3.0 | 2.0 | 1420 | $2,550 | $1.80 | 3d | 1 | 1.01mi |
| 8960 52nd Ave E Palmetto, FL | 4.0 | 2.0 | 1984 | $2,650 | $1.34 | 23d | 1 | 1.29mi |
| 5029 Rocky Coast Pl Palmetto, FL | 3.0 | 2.0 | 1482 | $2,400 | $1.62 | 10d | 1 | 1.31mi |
| 7122 87th Ln E Palmetto, FL | 4.0 | 2.0 | 1593 | $2,750 | $1.73 | 23d | 1 | 1.33mi |
| 5605 78th Ave E Palmetto, FL | 3.0 | 2.0 | 1415 | $2,800 | $1.98 | 21d | 1 | 1.37mi |
| 4117 84th Ct E Palmetto, FL | 3.0 | 2.0 | 1448 | $2,466 | $1.70 | 21d | 1 | 1.37mi |
| 5520 Flagstone Trl Palmetto, FL | 4.0 | 2.5 | 2248 | $3,200 | $1.42 | 23d | 1 | 1.38mi |
| 4014 84th Ct E Palmetto, FL | 3.0 | 2.0 | 1555 | $2,516 | $1.62 | 21d | 1 | 1.42mi |
| 5514 Night Owl Ter Palmetto, FL | 4.0 | 2.0 | 1752 | $2,650 | $1.51 | 16d | 1 | 1.45mi |
HOA detail
- Monthly dues
- $87 · $1,044/yr
- Likely covers
- water
Listing history 9 events
-
2026-06-18days on market $325,000 Active 10 DOM
-
2026-06-17days on market $325,000 Active 9 DOM
-
2026-06-16days on market $325,000 Active 8 DOM
-
2026-06-15days on market $325,000 Active 7 DOM
-
2026-06-13days on market $325,000 Active 5 DOM
-
2026-06-13days on market $325,000 Active 4 DOM
-
2026-06-10days on market $325,000 Active 2 DOM
-
2026-06-08remarks 480-char remark
-
2026-06-08$325,000 Active 1 DOM
ⓘ Source: listings_history table (triggers on properties + properties_extension) + one-shot
backfill from property_details.listing_events for pre-trigger history.
Tax reassessment forecast FL · Resets to sale price
- Current annual tax
- $2,351 · $196/mo
- Projected year-2 tax
- $2,698 · $225/mo
- Expected delta
- +$347/yr (+$29/mo · 14.8%)
ⓘ Screening estimate from a state-policy table — verify with the county assessor before closing.
Climate risk First Street
- Flood 1/10 Low FEMA zone X (unshaded) · 0% chance over 30 yrs
- Wildfire 3/10 Moderate
- Heat 10/10 Extreme 7 d/yr ≥107°F today · 30 d/yr by 30 yrs out
- Wind 10/10 Extreme 99% chance of damaging wind over 30 yrs
- Air quality 3/10 Moderate 3 unhealthy d/yr today · 3 by 30 yrs out
Nearby sold comps map
Loading sold comps map…
Walkable amenities ~0.75 mi
Loading nearby amenities…
Taxation est. · year 1
- Rental income
- $31,663
- − Mortgage interest
- −$18,205
- − Property taxes
- −$2,351
- − Insurance
- −$1,625
- − Repairs & maintenance
- −$2,533
- − Management
- −$2,533
- − HOA
- −$1,044
- − Depreciation
- −$9,455
- Taxable loss
- −$6,083
- Est. tax savings @ 24.0%
- +$1,460
- After-tax cash flow
- $1,002/yr
For passive investors: Depreciation is non-cash, so a rental often shows a tax loss while cash-flowing — sheltering income. Rental losses are passive: they offset passive income freely, and up to $25,000/yr can offset ordinary (W-2) income if you actively participate and your MAGI is under $100k (phasing out to $0 by $150k); unused losses carry forward. On sale, claimed depreciation is recaptured at up to 25%, and gains may owe capital-gains tax (a 1031 exchange can defer both). Figures are a year-1 estimate at your 24.0% rate — not tax advice; consult a CPA.
Schools (NCES district)
- District
- Manatee
- NCES district ID
- 1201230
- Math proficiency
- 54% ▼ -6.00%
- Reading proficiency
- 50% ▼ -2.00%
- Median HH income
- $49,607
- Composite
- 44.43/100
- National rank
- #2806
- State rank
- #26 of 73 in FL
Livability — Ellenton
- Score
- 76/100
- State rank
- #232
- US rank
- #3666
Category grades
Schools grade is shown separately in the Schools card above.
Census & demographics
- County
- Manatee County · 416,364 people
- City population
- 14,819
- Metro
- North Port-Sarasota-Bradenton, FL
- Population (ZIP)
- 56,208
- Household income
- $77,712
- Rent vs Own
- Severe rent burden
- 1193.0
Population outlook (Manatee County) Hauer SSP2
- Today (2025)
- 447,342 people
- By 2030
- 488,911 · +9.3%
- By 2040
- 567,934 · +27.0%
- By 2050
- 637,995 · +42.6%
- By 2075
- 781,970 · +74.8%
- By 2100
- 848,272 · +89.6%
Race, ethnicity, and origin ACS 2023
- Neighborhood character
- Diverse neighborhood (Simpson 0.58)
- Race & ethnicity
- White 59% Hispanic / Latino 22% Black 14% Two or more races 11%
- Hispanic origin (detail)
- Mexican 14% Puerto Rican 3%
- Common ancestry
- Romanian 2% Lithuanian 2% Italian 2%
- Foreign-born
- 10% · Canada, Dominican Republic, Jamaica
- Languages at home
- 81% English-only · Spanish 16% Other Indo-European 1%
Political lean MEDSL · Manatee
- 2024 margin
- Strong R (+23.5) · D 37.9% · R 61.4%
- 2008→2024 swing
- -16.5pp toward R · 2008: -7.0pp · 2024: -23.5pp
- All cycles
- 2024: R+23.5 2020: R+16.1 2016: R+17.1 2012: R+12.5 2008: R+7.0
Not yet ingested
- Civics
- —
Market trends
- HPI YoY
- ▼ -383.53%
- Current HPI
- 302.1458
- Rent YoY
- ▼ -2.98%
- Metro
- North Port-Sarasota-Bradenton, FL
- State GDP YoY
- ▲ 3.28%
- F500 in state
- 36
Industry mix (Fortune 500 HQ in FL)
| Industry | F500 HQs | Revenue |
|---|---|---|
| Industrial Technology | 2 | $29B |
|
||
| Insurance | 2 | $17B |
|
||
| Retail | 1 | $60B |
|
||
| Technology Distribution | 1 | $58B |
|
||
| Homebuilding | 1 | $35B |
|
||
| Technology Manufacturing | 1 | $35B |
|
||
Price history
-48.8% since first listed11 events — show timeline
- 2026-06-08 Listed $325,000 Stellar MLS as Distributed by MLS Grid
- 2020-04-30 Sold (Public Records) $220,500 Public Records
- 2020-04-29 Sold (MLS) $220,500 Stellar MLS as Distributed by MLS Grid
- 2020-01-05 Pending — Stellar MLS as Distributed by MLS Grid
- 2019-12-28 Listed $235,000 Stellar MLS as Distributed by MLS Grid
- 2016-03-03 Listing Removed — Stellar MLS as Distributed by MLS Grid
- 2016-02-25 Sold (MLS) $211,990 Stellar MLS as Distributed by MLS Grid
- 2016-01-13 Pending — Stellar MLS as Distributed by MLS Grid
- 2016-01-04 Price Changed $211,990 Stellar MLS as Distributed by MLS Grid
- 2015-12-02 Listed $209,990 Stellar MLS as Distributed by MLS Grid
- 2015-10-16 Sold (Public Records) $635,195 Public Records
Property tax history
+24.3%/yrLatest (2025): $2,351 · +6.6% YoY. Source: county tax records.
Cash-flow waterfall
monthlySold comps — $/sqft
last 12 mo · ≤1 miLoading sold comps…