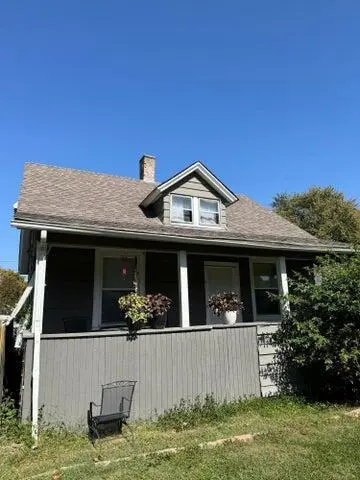
2312 1/2 W 1st St · Davenport, IA
Flood risk 5/10 · Moderate
- FEMA flood zone
- X (unshaded)
- Chance of flooding over 30 yrs
- 0.66%
- Est. flood insurance / yr
- $473 – $860
Fire risk 3/10 · Minor
- Est. fire insurance / yr
- $902 – $1,676
Heat risk 3/10 · Minor
- Hot days now (above 104°F)
- 7 days/yr
- Hot days in 30 yrs
- 16 days/yr
Wind risk 2/10 · Minimal
- Chance of severe wind over 30 yrs
- —
Air-quality risk 3/10 · Minor
- Unhealthy air days now
- 2 days/yr
- Unhealthy air days in 30 yrs
- 3 days/yr
Risk factors via First Street. Map © Google.
Why this score? — see what drove the C grade
The composite is a weighted blend of 9 inputs, each scored 0–100. Each bar is that input's sub-score; the figure is the points it added to the 100-point composite (weight × sub-score).
- Cash flow +19.7/30.0
- ARV discount +12.1/15.0
- DSCR +6.2/10.0
- 1% rule +5.2/10.0
- Livability +4.0/5.0
- Schools +3.9/10.0
- Rent growth +2.5/5.0
- Condition / age +2.5/5.0
- Appreciation +0.0/10.0
$115,000
🖨 Deal sheet 📄 Offer letter ✓ Due diligence
Listing remarks MLS
Renovated 3 bed/1bath with large front porch and 1 car garage. New flooring in the living/dining room with ceiling fan, master bedroom on the main level. Updated kitchen includes new lighting, cabinets, countertops, backsplash, sink, and faucet. Bathroom has been updated with new vanity, flooring, lights, and tile surround shower with glass block for privacy with natural light. Two more bedrooms upstairs with an additional sitting area. Full basement is ready to be finished which includes a built in bar for entertaining. Per seller; Roof '17, Furnace '17 and Plumbing/Electrical '15.
Key facts
- Open porch
- Detached garage
- 3,485 sq ft lot
Tags
Property features AI
Exterior
- Parking: Detached 1-car garage
- Utilities: Public water; Public sewer
- Home design: One and one-half story single-family residence; Residential property
- Construction: Aluminum siding construction
- Exterior features: Aluminum siding; Zoned residential; Located between N. Elmwood Ave and N Lincoln Ave; accessed off the alley between W 1st St and W 2nd St; Subdivision: WEST PARK ADD
Interior
- Kitchen: Refrigerator
- Bedrooms: One bedroom on the main level
- Bathrooms: One bathroom on the main level
- Heating & cooling: Central air
- Interior features: Full basement
- Laundry & utility: Washer; Dryer
Neighborhood map
What this means for you Summary
Snapshot
- This is a 3-bed/1.0-bath single-family listed at $115k.
Deal economics
- At list price, monthly cash flow is $134 ($2k/yr) — positive.
- The deal already cash-flows at list — no discount required.
- Meets the 1% rule at list price ($1k rent vs $115k).
- Cap rate 7.7% vs local median 4.4% in Davenport — top-decile yield for the area; either an underpriced asset or a hidden risk that comps aren't pricing in. Stress-test before assuming the spread holds.
Location & tenants
- Location reads 79/100 on livability (#126 in IA, #2,312 nationally) — a middle-class / working-renter tenant base. Strengths: cost of living A+, housing A+, health & safety A+; Watch: employment C-, crime F.
- Davenport Community School District (urban): math 43% / reading 50% proficiency, ranked #288 of 289 in IA (top 100%) — families likely to look elsewhere, expect single-tenant / working-renter base with shorter leases.
- Market conditions: 68 active listings in the ZIP; 11 comparable units currently listed for rent nearby; rentals lingering (median 44d on market — plan ~5-8 weeks vacancy on turnover, expect pricing pressure); 55% of comp listings sitting > 30 days — soft ceiling on asking rent; 805 units permitted in Scott County in 2024 (479 in 5+ unit buildings).
Forward outlook
- Local home prices are declining (-3.0%/yr); year-one equity from $795 of loan paydown is wiped out by about $3k of value loss. Plan a longer hold.
- Scott County population projected at +19% by 2050 — long-run rental-demand tailwind backs the buy-and-hold thesis.
Negotiation context
- Only 1 days on market — expect competitive offers; lowballing is unlikely to land.
- 5 sale attempts since 17y ago with the ask held roughly flat each time — persistent listings suggest the price (not the market) is what's stuck; bring a comps-based counter.
- Current owner paid $65k; list at $115k implies a 77% gain — meaningful room to come down on a strong offer.
Risks & watch-outs
- Watch-outs: built in 1915 — expect roof / HVAC / electrical / plumbing capex.
- Climate carrying-cost: moderate flood risk — expect insurance premiums to compound above CPI over the hold.
Questions for the listing agent
- Built in 1915 — when were the roof, HVAC, electrical panel, plumbing, and water heater last replaced?
- Is there a deadline driving the sale (1031 exchange, divorce, estate, relocation)? That informs how much negotiation room exists.
- Crime grade is F in this area — have there been break-ins, vandalism, or insurance claims at this property in the last 3 years? What carrier currently insures it and at what premium?
- What's the average days-on-market for RENTAL listings here right now (not sales)? A rising rental-DOM trend means longer vacancies and softer asking-rent achievability than the comps imply.
- What's the recent tenant-quality profile in this submarket — average credit score on applications, eviction rate, late-payment / NSF rate, and stable-employment percentage? A property-management company in the area should have these aggregated.
- How much new for-sale + rental construction is in the pipeline within 1–3 miles? Heavy new supply typically softens prices + rents 12–24 months out; constrained supply supports both.
Investment metrics
- 1% rule
- 1.02% ✓
- Cap rate
- 7.70%
- Cash-on-cash
- 5.01%
- DSCR
- 1.22
- GRM
- 8.1
CMA / ARV
- ARV (on-the-fly)
- $127,968
- Comps found
- 12
Show comp detail 12 sales within ~0.75 mi
| Address | Dist | Beds/Ba | Sqft | Sold | Price | $/sf | Match |
|---|---|---|---|---|---|---|---|
| 209 S Thornwood Ave | 0.20mi | 3/1.0 | 1,056 (+2%) | 1mo | $36,000 | $34 | 86 |
| 2025 W 3rd St | 0.27mi | 3/1.0 | 1,020 (-1%) | 2mo | $125,000 | $123 | 83 |
| 2537 Boies Ave | 0.47mi | 3/1.0 | 1,013 (-2%) | 1mo | $74,900 | $74 | 74 |
| 114 S Elmwood Ave | 0.14mi | 3/2.0 | 1,116 (+8%) | 3mo | $140,000 | $125 | 74 |
| 306 S Elmwood Ave | 0.22mi | 2/1.0 (-1) | 960 (-7%) | 1mo | $140,000 | $146 | 73 |
| 612 Waverly Rd | 0.42mi | 4/1.5 (+1) | 1,040 (+1%) | 2mo | $175,000 | $168 | 70 |
| 809 Cimarron Dr | 0.49mi | 3/1.0 | 1,092 (+6%) | 3mo | $164,000 | $150 | 65 |
| 2008 Dixwell St | 0.34mi | 3/1.0 | 1,140 (+10%) | 4mo | $118,000 | $104 | 64 |
| 3003 Telegraph Rd | 0.60mi | 3/1.0 | 1,008 (-2%) | 8mo | $125,000 | $124 | 62 |
| 636 Cedar St | 0.50mi | 2/1.0 (-1) | 944 (-8%) | 3mo | $68,000 | $72 | 55 |
| 3139 W 1st St | 0.72mi | 3/1.0 | 1,080 (+5%) | 5mo | $121,500 | $113 | 55 |
| 1107 N Thornwood Ave | 0.75mi | 3/1.0 | 912 (-12%) | 6mo | $168,000 | $184 | 41 |
Match score weights: distance 35% · size 25% · config 20% · recency 20%. Top-matched comps best support the ARV.
Projected returns pro-forma
-3.0% appreciation · 3.0% rent growth · sell at horizon
- IRR
- -8.5%
- Equity multiple
- 0.69×
- Total profit
- $-10,057
- Equity at exit
- $17,147
- IRR
- 1.0%
- Equity multiple
- 1.07×
- Total profit
- $2,336
- Equity at exit
- $9,943
Cash invested: $32,200 (down + closing). Projections, not guarantees.
Landlord ↔ Tenant lean methodology
- Overall (STATE)
- 83 Strongly Landlord-Friendly
- State Iowa
- 83 Strongly Landlord-Friendly · R+6
- County
- — inherits STATE
- City
- — inherits STATE
ZIP-level market 52802
- Home prices YoY
- -28.3%
- Active inventory
- 68
- Price-to-rent
- 8.1×
Monthly cashflow live
- Estimated rent
- $1,176 high interval (Pro) →
- Mortgage (P&I)
- −$603
- Tax est. 1.5%
- −$144 /mo · $1,725/yr
- Insurance
- −$48
- HOA
- −$0
- Vacancy / Maint / Mgmt
- −$247
- Net cashflow
- $134
Break-even live
UW: 25.0% down · 7.5% · 30yr · 1.5% tax · 5.0% vac · 8.0% maint · 8.0% mgmt
Financing live
Cash to close
- Down payment
- $28,750
- Closing costs
- $3,450
- Reserves months
- —
- Total cash needed
- —
Loan-product check · same deal, 3 products live
Conventional
25% down · 7.5% · 30yr
- Down + closing
- —
- Monthly P&I
- —
- Monthly cashflow
- —
- DSCR
- —
- Eligible?
- —
Personal DTI + credit; lowest rate.
DSCR
20% down · 8.5% · 30yr
- Down + closing
- —
- Monthly P&I
- —
- Monthly cashflow
- —
- DSCR
- —
- Eligible?
- —
No personal income docs; deal must DSCR.
Hard money
10% down · 12.0% · 12mo
- Down + closing
- —
- Monthly P&I
- —
- Monthly cashflow
- —
- DSCR
- —
- Eligible?
- —
Short-term bridge; refi at stabilization.
Rent comps 11 comps
| Address | Beds | Baths | Sqft | Rent | $/sqft | DOM | Units | Dist |
|---|---|---|---|---|---|---|---|---|
| 301 S Thornwood Ave Davenport, IA | 3.0 | 1.0 | 1242 | $1,395 | $1.12 | 13d | 1 | 0.26mi |
| 445 Waverly Rd Davenport, IA | 2.0 | 1.0 | 980 | $1,200 | $1.22 | 43d | 1 | 0.26mi |
| 510 S Lincoln Ave Davenport, IA | 2.0 | 1.0 | 1184 | $1,195 | $1.01 | 21d | 1 | 0.36mi |
| 1912 Dixwell St Davenport, IA | 4.0 | 2.0 | 1116 | $1,300 | $1.16 | 43d | 1 | 0.40mi |
| 627 N Division St Davenport, IA | 2.0 | 1.0 | 800 | $800 | $1.00 | 43d | 1 | 0.74mi |
| 1716 W 7th St Davenport, IA | 4.0 | 1.0 | 1278 | $1,712 | $1.34 | 13d | 1 | 0.77mi |
| 1529 W 6th St Davenport, IA | 2.0 | 1.0 | 794 | $850 | $1.07 | 13d | 1 | 0.83mi |
| 1607 W 12th St Davenport, IA | 1.0–2.0 | 1.0 | 800 | $740 | $0.93 | 43d | 3 | 0.99mi |
| 1341 W 4th St Davenport, IA | 3.0 | 1.5 | 979 | $1,394 | $1.42 | 43d | 1 | 1.01mi |
| 1455 W 12th St Davenport, IA | 3.0 | 1.0 | 942 | $1,095 | $1.16 | 13d | 1 | 1.14mi |
| 1445 W 16th St Unit 3 Davenport, IA | 2.0 | 1.0 | 765 | $915 | $1.20 | 43d | 1 | 1.36mi |
Listing history 2 events
-
2026-06-18remarks 432-char remark
-
2026-06-18$115,000 Active 1 DOM
ⓘ Source: listings_history table (triggers on properties + properties_extension) + one-shot
backfill from property_details.listing_events for pre-trigger history.
Climate risk First Street
- Flood 5/10 Major FEMA zone X (unshaded) · 66% chance over 30 yrs
- Wildfire 3/10 Moderate
- Heat 3/10 Moderate 7 d/yr ≥104°F today · 16 d/yr by 30 yrs out
- Wind 2/10 Low
- Air quality 3/10 Moderate 2 unhealthy d/yr today · 3 by 30 yrs out
Nearby sold comps map
Loading sold comps map…
Walkable amenities ~0.75 mi
Loading nearby amenities…
Taxation est. · year 1
- Rental income
- $14,113
- − Mortgage interest
- −$6,442
- − Property taxes
- −$1,725
- − Insurance
- −$575
- − Repairs & maintenance
- −$1,129
- − Management
- −$1,129
- − Depreciation
- −$3,345
- Taxable loss
- −$232
- Est. tax savings @ 24.0%
- +$56
- After-tax cash flow
- $1,668/yr
For passive investors: Depreciation is non-cash, so a rental often shows a tax loss while cash-flowing — sheltering income. Rental losses are passive: they offset passive income freely, and up to $25,000/yr can offset ordinary (W-2) income if you actively participate and your MAGI is under $100k (phasing out to $0 by $150k); unused losses carry forward. On sale, claimed depreciation is recaptured at up to 25%, and gains may owe capital-gains tax (a 1031 exchange can defer both). Figures are a year-1 estimate at your 24.0% rate — not tax advice; consult a CPA.
Schools (NCES district)
- District
- Davenport Community School District
- NCES district ID
- 1908580
- Math proficiency
- 43% ▼ -11.00%
- Reading proficiency
- 50% ▼ -3.00%
- Median HH income
- $46,157
- Composite
- 39.49/100
- National rank
- #3951
- State rank
- #288 of 289 in IA
Livability — Davenport
- Score
- 79/100
- State rank
- #126
- US rank
- #2312
Category grades
Schools grade is shown separately in the Schools card above.
Census & demographics
- Census place
- Davenport, IA
- County
- Scott County · 144,583 people
- City population
- 103,319
- Metro
- Davenport-Moline-Rock Island, IA-IL
- Population (ZIP)
- 9,466
- Household income
- $54,380
- Rent vs Own
- Severe rent burden
- 244.0
Population outlook (Scott County) Hauer SSP2
- Today (2025)
- 188,878 people
- By 2030
- 196,648 · +4.1%
- By 2040
- 210,860 · +11.6%
- By 2050
- 224,359 · +18.8%
- By 2075
- 258,884 · +37.1%
- By 2100
- 286,447 · +51.7%
Race, ethnicity, and origin ACS 2023
- Neighborhood character
- Predominantly White (71%)
- Race & ethnicity
- White 71% Hispanic / Latino 14% Two or more races 10% Black 5% Asian 1%
- Hispanic origin (detail)
- Mexican 13%
- Common ancestry
- Romanian 2% Lithuanian 1% Italian 1%
- Foreign-born
- 4% · Canada, Vietnam
- Languages at home
- 92% English-only · Spanish 7%
Political lean MEDSL · Scott
- 2024 margin
- Toss-up / Even · D 47.3% · R 51.2% · Other 1.4%
- 2008→2024 swing
- -18.4pp toward R · 2008: 14.6pp · 2024: -3.9pp
- All cycles
- 2024: R+3.9 2020: D+3.5 2016: D+1.4 2012: D+13.8 2008: D+14.6
Not yet ingested
- Civics
- —
Market trends
- HPI YoY
- ▼ -59.59%
- Current HPI
- 151.2076
- Rent YoY
- —
- Metro
- Davenport-Moline-Rock Island, IA-IL
- State GDP YoY
- ▲ 2.48%
- F500 in state
- 4
Industry mix (Fortune 500 HQ in IA)
| Industry | F500 HQs | Revenue |
|---|---|---|
| Financial Services | 1 | $16B |
|
||
| Retail / Convenience | 1 | $15B |
|
||
Price history
+253.8% since first listed9 events — show timeline
- 2026-06-18 Listed $115,000 Muscatine BOR
- 2020-03-25 Sold (MLS) $65,000 MRED as Distributed by MLS Grid
- 2020-01-14 Listed $74,900 MRED as Distributed by MLS Grid
- 2019-11-27 Sold (MLS) $35,000 MRED as Distributed by MLS Grid
- 2019-09-24 Listed $45,000 MRED as Distributed by MLS Grid
- 2012-07-17 Sold (MLS) $30,500 MRED as Distributed by MLS Grid
- 2012-05-07 Listed $32,000 MRED as Distributed by MLS Grid
- 2009-07-14 Sold (MLS) $26,000 MRED as Distributed by MLS Grid
- 2009-04-08 Listed $32,500 MRED as Distributed by MLS Grid
Cash-flow waterfall
monthlySold comps — $/sqft
last 12 mo · ≤1 miLoading sold comps…