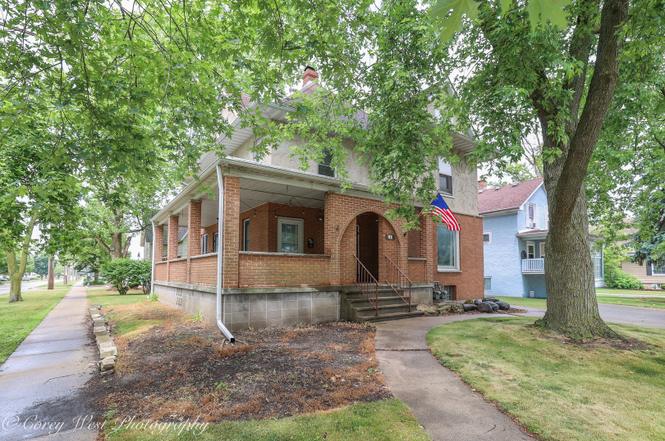
131 S 7th St · DeKalb, IL
Flood risk 1/10 · Minimal
- FEMA flood zone
- X (unshaded)
- Chance of flooding over 30 yrs
- 0.0%
- Est. flood insurance / yr
- $473 – $860
Fire risk 1/10 · Minimal
- Est. fire insurance / yr
- $804 – $1,492
Heat risk 2/10 · Minimal
- Hot days now (above 101°F)
- 7 days/yr
- Hot days in 30 yrs
- 15 days/yr
Wind risk 2/10 · Minimal
- Chance of severe wind over 30 yrs
- —
Air-quality risk 3/10 · Minor
- Unhealthy air days now
- 1 days/yr
- Unhealthy air days in 30 yrs
- 3 days/yr
Risk factors via First Street. Map © Google.
Why this score? — see what drove the F grade
The composite is a weighted blend of 9 inputs, each scored 0–100. Each bar is that input's sub-score; the figure is the points it added to the 100-point composite (weight × sub-score).
- ARV discount +7.5/15.0
- Cash flow +5.3/30.0
- Rent growth +4.3/5.0
- Livability +3.9/5.0
- Condition / age +2.5/5.0
- 1% rule +1.4/10.0
- Schools +1.2/10.0
- DSCR +0.0/10.0
- Appreciation +0.0/10.0
$325,000
🖨 Deal sheet (PDF) 📄 Offer letter ✓ Due diligence
Listing remarks
INVESTMENT OPPORTUNITY-SOLID TWO-UNIT MASONRY BUILDING. Well Maintained solid masonry two-story, two unit property offering strong rental income potential in a desirable location. The first floor unit features a spacious one-bedroom layout with a large living room, separate parlor, kitchen and full bath. Additional amenities include basement with washer / dryer, an attached one-car garage and a fenced backyard. This unit rents for $1,400 per month. The second-floor unit offers two generous bedrooms, a large living room, an oversized eat-in kitchen, a full bath and the convenience of an in-unit washer and dryer, and rents for $1,100 per month. Utilities are separate and tenants pay for gas a
Key facts
- 6,240 sq ft lot
- Garage
- Built 1905
Property features AI
Finance
- Other: Property zoned SINGL; Parcel number 0823334010
- Financial info: Gross income reported at $30,000; Water/sewer expense estimated at $900 (owner projection); Insurance expense estimated at $2,800
- HOA & community: Community features include curbs, sidewalks, street lights, paved streets
Exterior
- Parking: Attached garage with garage door opener (1 garage space total); Garage/space assigned to units
- Utilities: Public water; Public sewer; Electric and gas paid by tenants (both units)
- Home design: Two- to four-unit building (converted); Fee simple ownership; Over 100 years old
- Construction: Brick construction; Block foundation; Built before 1978
- Exterior features: Corner lot; Fenced yard; Curbs, sidewalks, street lights, paved streets; Lot dimensions approximately 65 x 96
Interior
- Kitchen: Stove; Refrigerator; Dishwasher; Microwave
- Bedrooms: 3 bedrooms total (unit breakdown: one 1-bedroom on first floor; one 2-bedroom on second floor)
- Bathrooms: 2 full bathrooms total
- Heating & cooling: Natural gas heating; Central air conditioning (unit 1); Window air conditioner (unit 2)
- Interior features: 8 total rooms; Unfinished full basement with bath rough-in/stub
- Laundry & utility: Laundry hook-up (unit 1); Washer and Dryer (unit 2)
Neighborhood map
What this means for you Summary
Snapshot
- This is a 6-bed/4.0-bath other listed at $325k.
Deal economics
- At list price, monthly cash flow is $-718 ($-9k/yr) — negative.
- To cash-flow at today's rent, offer at most $198k (39.0% below list).
- To meet the 1% rule (rent ≥ 1% of price), the offer needs to be $208k (36.1% below list).
- Recommended offer: $198k (39.0% below list) — sets the bar for cash-flow.
Location & tenants
- Location reads 77/100 on livability (#154 in IL, #2,835 nationally) — a middle-class / working-renter tenant base. Strengths: commute A+, cost of living A+, housing A+; Watch: amenities D+, crime D-, employment F.
- Dekalb CUSD 428 (suburban): math 11% / reading 16% proficiency, ranked #541 of 620 in IL (top 87%) — low school quality limits family demand, transient renter base, plan for 1-2y turnover.
- Zoned schools: Founders Elementary School (math 8% / reading 8%, grade F, #1,627 of 2,056 statewide, top 81%, 556 students, 0% FRL); Huntley Middle School (math 12% / reading 16%, grade F, #529 of 665 statewide, top 80%, 934 students, 0% FRL); Dekalb High School (math 18% / reading 28%, grade F, #312 of 693 statewide, top 46%, 2,083 students, 0% FRL) — zoned schools average 0% FRL vs 48% district-wide (48 pts lower); this property's tenant base skews higher-income than the district average.
- Market conditions: Rents rising fast (+7.3%/yr); 85 active listings in the ZIP; 1 comparable units currently listed for rent nearby; 260 units permitted in DeKalb County in 2024 (73 in 5+ unit buildings).
- At $2,077/mo this rent would consume 53% of the median local household income ($47k/yr) (locally 3794% of renters already pay >50% of income on rent) — very limited rent-growth headroom before tenants either downsize or default.
Forward outlook
- Local home prices are declining (-3.0%/yr); year-one equity from $2k of loan paydown is wiped out by about $10k of value loss. Plan a longer hold.
- DeKalb County population projected to shrink 5% by 2050 — rents likely to lag national; underwrite the cash flow, not the appreciation.
Negotiation context
- Only 8 days on market — expect competitive offers; lowballing is unlikely to land.
- 2 sale attempts with the ask held roughly flat each time — persistent listings suggest the price (not the market) is what's stuck; bring a comps-based counter.
- Current owner paid $135k; list at $325k implies a 141% gain — meaningful room to come down on a strong offer.
Risks & watch-outs
- Watch-outs: built in 1905 — expect roof / HVAC / electrical / plumbing capex.
Questions for the listing agent
- What do current leases actually rent for vs. the listed asking? Can we see a recent rent roll and the last 12 months of T-12 income?
- Built in 1905 — when were the roof, HVAC, electrical panel, plumbing, and water heater last replaced?
- Is there a deadline driving the sale (1031 exchange, divorce, estate, relocation)? That informs how much negotiation room exists.
- Schools are D-rated, which usually means shorter tenancies and higher turnover. Who's the typical renter profile here, and what's been the actual vacancy rate?
- Crime grade is D in this area — have there been break-ins, vandalism, or insurance claims at this property in the last 3 years? What carrier currently insures it and at what premium?
- The area grade is low — what's the realistic commute time and amenity access for the typical tenant pool here? Any planned neighborhood developments (good or bad) we should know about?
- What's the average days-on-market for RENTAL listings here right now (not sales)? A rising rental-DOM trend means longer vacancies and softer asking-rent achievability than the comps imply.
- What's the recent tenant-quality profile in this submarket — average credit score on applications, eviction rate, late-payment / NSF rate, and stable-employment percentage? A property-management company in the area should have these aggregated.
- How much new for-sale + rental construction is in the pipeline within 1–3 miles? Heavy new supply typically softens prices + rents 12–24 months out; constrained supply supports both.
Investment metrics
- 1% rule
- 0.64% ✗
- Cap rate
- 3.64%
- Cash-on-cash
- -9.47%
- DSCR
- 0.58
- GRM
- 13.0
CMA / ARV
No comps found within radius.
Projected returns pro-forma
-3.0% appreciation · 7.33% rent growth · sell at horizon
- IRR
- -28.2%
- Equity multiple
- 0.02×
- Total profit
- $-88,874
- Equity at exit
- $48,459
- IRR
- -15.3%
- Equity multiple
- -0.03×
- Total profit
- $-93,526
- Equity at exit
- $28,100
Cash invested: $91,000 (down + closing). Projections, not guarantees.
Landlord ↔ Tenant lean methodology
- Overall (STATE)
- 43 Moderately Tenant-Leaning
- State Illinois
- 43 Moderately Tenant-Leaning · D+7
- County
- — inherits STATE
- City
- — inherits STATE
ZIP-level market 60115
- Home prices YoY
- -31.9%
- Rents YoY
- 7.3%
- Active inventory
- 85
- Price-to-rent
- 13.0×
Monthly cashflow live
- Estimated rent
- $2,077 medium interval (Pro) →
- Mortgage (P&I)
- −$1,704
- Tax from tax record
- −$519 /mo · $6,229/yr
- Insurance
- −$135
- HOA
- −$0
- Vacancy / Maint / Mgmt
- −$436
- Net cashflow
- $-718
Break-even live
Sensitivity live
| Price | -10% $-534 | -5% $-626 | +0% $-718 | +5% $-810 | +10% $-902 |
|---|---|---|---|---|---|
| Rent | -10% $-882 | -5% $-800 | +0% $-718 | +5% $-636 | +10% $-554 |
| Rate | -1.0pp $-555 | -0.5pp $-636 | base $-718 | +0.5pp $-803 | +1.0pp $-888 |
UW: 25.0% down · 7.5% · 30yr · 1.5% tax · 5.0% vac · 8.0% maint · 8.0% mgmt
Financing live
Cash to close
- Down payment
- $81,250
- Closing costs
- $9,750
- Reserves months
- —
- Total cash needed
- —
Loan-product check · same deal, 3 products live
Conventional
25% down · 7.5% · 30yr
- Down + closing
- —
- Monthly P&I
- —
- Monthly cashflow
- —
- DSCR
- —
- Eligible?
- —
Personal DTI + credit; lowest rate.
DSCR
20% down · 8.5% · 30yr
- Down + closing
- —
- Monthly P&I
- —
- Monthly cashflow
- —
- DSCR
- —
- Eligible?
- —
No personal income docs; deal must DSCR.
Hard money
10% down · 12.0% · 12mo
- Down + closing
- —
- Monthly P&I
- —
- Monthly cashflow
- —
- DSCR
- —
- Eligible?
- —
Short-term bridge; refi at stabilization.
Rent comps 1 comps
| Address | Beds | Baths | Sqft | Rent | $/sqft | DOM | Units | Dist |
|---|---|---|---|---|---|---|---|---|
| 801 Lucinda Ave DeKalb, IL | 2.0–8.0 | 1.0–2.5 | — | $1,767 | — | 0d | 37 | 1.23mi |
Listing history 7 events
-
2026-06-21days on market $325,000 Active 8 DOM
-
2026-06-18days on market $325,000 Active 5 DOM
-
2026-06-17days on market $325,000 Active 4 DOM
-
2026-06-16days on market $325,000 Active 3 DOM
-
2026-06-15days on market $325,000 Active 2 DOM
-
2026-06-13remarks 699-char remark
-
2026-06-13$325,000 Active 1 DOM
ⓘ Source: listings_history table (triggers on properties + properties_extension) + one-shot
backfill from property_details.listing_events for pre-trigger history.
Tax reassessment forecast IL · Partial reset (capped growth)
- Current annual tax
- $6,229 · $519/mo
- Projected year-2 tax
- $6,803 · $567/mo
- Expected delta
- +$574/yr (+$48/mo · 9.2%)
ⓘ Screening estimate from a state-policy table — verify with the county assessor before closing.
Climate risk First Street
- Flood 1/10 Low FEMA zone X (unshaded) · 0% chance over 30 yrs
- Wildfire 1/10 Low
- Heat 2/10 Low 7 d/yr ≥101°F today · 15 d/yr by 30 yrs out
- Wind 2/10 Low
- Air quality 3/10 Moderate 1 unhealthy d/yr today · 3 by 30 yrs out
Nearby sold comps map
Loading sold comps map…
Walkable amenities ~0.75 mi
Loading nearby amenities…
Taxation est. · year 1
- Rental income
- $24,919
- − Mortgage interest
- −$18,205
- − Property taxes
- −$6,229
- − Insurance
- −$1,625
- − Repairs & maintenance
- −$1,994
- − Management
- −$1,994
- − Depreciation
- −$9,455
- Taxable loss
- −$14,582
- Est. tax savings @ 24.0%
- +$3,500
- After-tax cash flow
- $-5,121/yr
For passive investors: Depreciation is non-cash, so a rental often shows a tax loss while cash-flowing — sheltering income. Rental losses are passive: they offset passive income freely, and up to $25,000/yr can offset ordinary (W-2) income if you actively participate and your MAGI is under $100k (phasing out to $0 by $150k); unused losses carry forward. On sale, claimed depreciation is recaptured at up to 25%, and gains may owe capital-gains tax (a 1031 exchange can defer both). Figures are a year-1 estimate at your 24.0% rate — not tax advice; consult a CPA.
Schools (NCES district)
- District
- Dekalb CUSD 428
- NCES district ID
- 1712000
- Math proficiency
- 11% ▼ -9.00%
- Reading proficiency
- 16% ▼ -6.00%
- Median HH income
- $42,007
- Composite
- 11.74/100
- National rank
- #9685
- State rank
- #541 of 620 in IL
Livability — DeKalb
- Score
- 77/100
- State rank
- #154
- US rank
- #2835
Category grades
Schools grade is shown separately in the Schools card above.
Census & demographics
- Census place
- DeKalb, IL
- County
- DeKalb County · 64,760 people
- City population
- 42,536
- Metro
- Chicago-Naperville-Elgin, IL-IN-WI
- Population (ZIP)
- 42,536
- Household income
- $47,043
- Rent vs Own
- Severe rent burden
- 3794.0
Population outlook (DeKalb County) Hauer SSP2
- Today (2025)
- 104,983 people
- By 2030
- 104,428 · -0.5%
- By 2040
- 102,199 · -2.7%
- By 2050
- 99,303 · -5.4%
- By 2075
- 93,978 · -10.5%
- By 2100
- 88,527 · -15.7%
Race, ethnicity, and origin ACS 2023
- Neighborhood character
- Diverse neighborhood (Simpson 0.61)
- Race & ethnicity
- White 58% Hispanic / Latino 18% Black 15% Two or more races 12% Asian 4%
- Hispanic origin (detail)
- Mexican 14% Puerto Rican 2%
- Common ancestry
- Romanian 5% Portuguese 3% Lithuanian 2%
- Foreign-born
- 9% · Canada, China
- Languages at home
- 82% English-only · Spanish 10% Arabic 2% Other Indo-European 2%
Political lean MEDSL · DeKalb
- 2024 margin
- Toss-up / Even · D 50.1% · R 48.1% · Other 1.7%
- 2008→2024 swing
- -14.8pp toward R · 2008: 16.8pp · 2024: 2.0pp
- All cycles
- 2024: D+2.0 2020: D+5.7 2016: D+3.0 2012: D+5.5 2008: D+16.8
Not yet ingested
- Civics
- —
Market trends
- HPI YoY
- ▼ -89.56%
- Current HPI
- 191.1189
- Rent YoY
- ▲ 7.33%
- Metro
- Chicago-Naperville-Elgin, IL-IN-WI
- State GDP YoY
- ▲ 1.59%
- F500 in state
- 60
Industry mix (Fortune 500 HQ in IL)
| Industry | F500 HQs | Revenue |
|---|---|---|
| Insurance | 4 | $201B |
|
||
| Consumer Goods | 4 | $87B |
|
||
| Industrial Machinery | 3 | $64B |
|
||
| Healthcare | 2 | $55B |
|
||
| Retail / Pharmacy | 1 | $148B |
|
||
| Agriculture / Food | 1 | $86B |
|
||
Price history
+140.7% since first listed5 events — show timeline
- 2026-06-13 Listed $325,000 MRED as Distributed by MLS Grid
- 2025-07-12 Rental Removed $1,100 MRED
- 2025-07-11 Listed for Rent $1,100 MRED
- 2023-07-07 Rental Removed — MRED
- 2012-01-12 Sold (Public Records) $135,000 Public Records
Property tax history
+2.0%/yrLatest (2025): $6,229 · +8.6% YoY. Source: county tax records.
Cash-flow waterfall
monthlySold comps — $/sqft
last 12 mo · ≤1 miLoading sold comps…