19701 SW 114th Ave #364 · South Miami Heights, FL
Flood risk 5/10 · Moderate
- FEMA flood zone
- AH
- Chance of flooding over 30 yrs
- 0.24%
- Est. flood insurance / yr
- $1,142 – $2,507
Fire risk 1/10 · Minimal
- Est. fire insurance / yr
- $947 – $1,759
Heat risk 10/10 · Severe
- Hot days now (above 105°F)
- 7 days/yr
- Hot days in 30 yrs
- 29 days/yr
Wind risk 10/10 · Severe
- Chance of severe wind over 30 yrs
- 99.0%
Air-quality risk 2/10 · Minimal
- Unhealthy air days now
- 1 days/yr
- Unhealthy air days in 30 yrs
- 1 days/yr
Risk factors via First Street. Map © Google.
Why this score? — see what drove the C- grade
The composite is a weighted blend of 9 inputs, each scored 0–100. Each bar is that input's sub-score; the figure is the points it added to the 100-point composite (weight × sub-score).
- Cash flow +16.2/30.0
- 1% rule +8.4/10.0
- ARV discount +7.5/15.0
- DSCR +5.0/10.0
- Schools +4.2/10.0
- Livability +3.9/5.0
- Condition / age +2.5/5.0
- Rent growth +2.3/5.0
- Appreciation +0.0/10.0
$149,990
🖨 Deal sheet (PDF) 📄 Offer letter ✓ Due diligence
Listing remarks
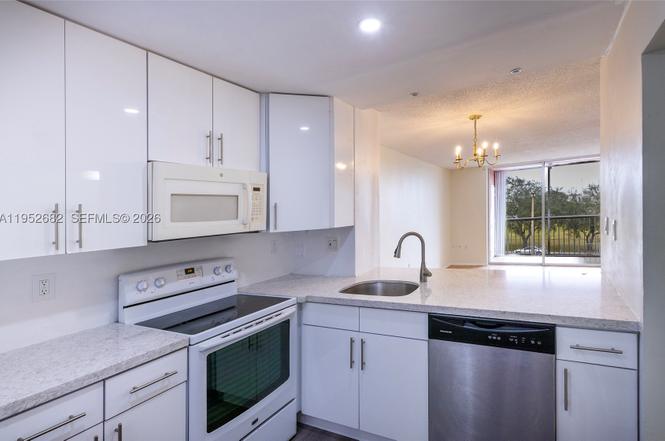
A great investment opportunity is here. Turnkey 2/2 condo ready to be lived or rented immediately. Top floor unit with plenty of space. Enjoy its proximity to great schools, highway access, restaurants, and more. Located a couple of blocks away from the new South Land Mall development which is poised to completely re-energize the entire neighborhood. Please don't miss out!
Key facts
- Highway access
- Top floor unit
- Restaurants
Tags
Property features AI
Finance
- Financial info: Pets allowed (no restrictions)
- HOA & community: Monthly association fee; Association fee covers roof and water; Association amenities include pool
Exterior
- Parking: One parking space
- Security: Complex fenced; Secured elevator
- Utilities: Water included in association fee
- Home design: Attached property; 3 stories; Entry on third floor; Effective year built
- Construction: Block construction
- Exterior features: Courtyard; Fenced property; Association pool
Interior
- Kitchen: Electric range; Microwave; Refrigerator
- Flooring: Ceramic tile; Laminate
- Bathrooms: 2 full bathrooms
- Heating & cooling: Central heating; Central air conditioning; Ceiling fans
- Interior features: Third-floor entry; Ceramic tile flooring; Laminate flooring
Neighborhood map
What this means for you Summary
Snapshot
- This is a 2-bed/2.0-bath condo listed at $150k.
Deal economics
- At list price, monthly cash flow is $-73 ($-872/yr) — negative.
- To cash-flow at today's rent, offer at most $137k (8.6% below list).
- Meets the 1% rule at list price ($2k rent vs $150k).
- Recommended offer: $132k (12.0% below list) — sets the bar for market timing.
- Cap rate 6.9% vs local median 3.5% in South Miami Heights — top-decile yield for the area; either an underpriced asset or a hidden risk that comps aren't pricing in. Stress-test before assuming the spread holds.
Location & tenants
- Location reads 78/100 on livability (#169 in FL, #2,539 nationally) — a middle-class / working-renter tenant base. Strengths: housing A+, health & safety A+, commute B+; Watch: employment D+, amenities F.
- Miami-Dade (suburban): math 45% / reading 54% proficiency, ranked #40 of 73 in FL (top 55%) — families likely to look elsewhere, expect single-tenant / working-renter base with shorter leases; 64% free/reduced lunch — lower-income household profile, screen leases tightly.
- Zoned schools: Bel-Aire Elementary School (math 32% / reading 37%, grade F, #1,709 of 2,144 statewide, top 81%, 319 students, 76% FRL); Cutler Bay Middle (math 30% / reading 36%, grade F, #437 of 571 statewide, top 77%, 1,031 students, 72% FRL); Miami Southridge Senior High (math 23% / reading 30%, grade F, #489 of 667 statewide, top 74%, 2,085 students, 70% FRL).
- Zoned-school proficiency averages 31% at this address vs 50% district-wide (-18 pts) — the specific schools serving this property underperform the Miami-Dade average; the district grade overstates school quality for this exact location.
- Market conditions: Rents soft (-0.8%/yr); 380 active listings in the ZIP; 40 comparable units currently listed for rent nearby; rentals at typical pace (median 23d on market — plan ~3-4 weeks tenant-placement turnaround); solid renter incomes; 10,051 units permitted in Miami-Dade County in 2024 (7,758 in 5+ unit buildings).
Forward outlook
- Local home prices are declining (-3.0%/yr); year-one equity from $1k of loan paydown is wiped out by about $4k of value loss. Plan a longer hold.
- Miami-Dade County population projected at +28% by 2050 — long-run rental-demand tailwind backs the buy-and-hold thesis.
Negotiation context
- It's been on market 146 days — a 12% lower offer ($132k) is reasonable based on typical stale-listing flexibility.
- Current owner paid $24k; list at $150k implies a 525% gain — meaningful room to come down on a strong offer.
Risks & watch-outs
- Watch-outs: flood insurance adds $152/mo; HOA is 24% of rent.
- Climate carrying-cost: in FEMA flood zone AH (mandatory federal flood insurance); severe wind risk, 99% chance of damaging wind over 30y; extreme-heat days projected 7→29/yr by 2055 (HVAC capex compounding) — expect insurance premiums to compound above CPI over the hold.
Questions for the listing agent
- What do current leases actually rent for vs. the listed asking? Can we see a recent rent roll and the last 12 months of T-12 income?
- It's been on market 146 days. Have you received any prior offers? Is the seller open to a 12% concession, seller financing, or rate buy-down credit?
- Built in 1974 — when were the roof, HVAC, electrical panel, plumbing, and water heater last replaced?
- What's the actual annual flood-insurance premium (NFIP or private), and is the property in a SFHA with mandatory coverage?
- What does the HOA fee cover, when was the last increase, and are there any pending special assessments or reserve-fund shortfalls?
- Any open or pending special assessments — roof, HVAC, plumbing, elevator, façade? What's the per-unit balance and payoff schedule, and is the seller paying it off at close or rolling it to the buyer?
- Why hasn't it sold? Are there any deal-killer items the seller is aware of (foundation, flood, title, zoning, code violations)?
- Is there a deadline driving the sale (1031 exchange, divorce, estate, relocation)? That informs how much negotiation room exists.
- Schools are A-rated — typically a magnet for longer-tenancy family renters. What's the average tenant stay here, and is there a school-zone premium baked into asking?
- What's the average days-on-market for RENTAL listings here right now (not sales)? A rising rental-DOM trend means longer vacancies and softer asking-rent achievability than the comps imply.
- What's the recent tenant-quality profile in this submarket — average credit score on applications, eviction rate, late-payment / NSF rate, and stable-employment percentage? A property-management company in the area should have these aggregated.
- How much new apartment / multifamily construction is in the pipeline within 1–3 miles? Heavy new supply (>2% of stock underway) typically softens rents 12–24 months out; light construction supports rent growth.
Investment metrics
- 1% rule
- 1.34% ✓
- Cap rate
- 6.93%
- Cash-on-cash
- 2.27%
- DSCR
- 1.10
- GRM
- 6.2
CMA / ARV
No comps found within radius.
Projected returns pro-forma
-3.0% appreciation · 0.0% rent growth · sell at horizon
- IRR
- -25.1%
- Equity multiple
- 0.18×
- Total profit
- $-34,423
- Equity at exit
- $22,364
- IRR
- -50.7%
- Equity multiple
- -0.36×
- Total profit
- $-57,072
- Equity at exit
- $12,968
Cash invested: $41,997 (down + closing). Projections, not guarantees.
Landlord ↔ Tenant lean methodology
- Overall (STATE)
- 87 Strongly Landlord-Friendly
- State Florida
- 87 Strongly Landlord-Friendly · R+3
- County
- — inherits STATE
- City
- — inherits STATE
ZIP-level market 33157
- Rents YoY
- -0.8%
- Active inventory
- 380
- Price-to-rent
- 6.2×
Monthly cashflow live
- Estimated rent
- $2,016 high interval (Pro) →
- Mortgage (P&I)
- −$787
- Tax from tax record
- −$181 /mo · $2,174/yr
- Insurance
- −$62
- Flood insurance flood zone
- −$152 /mo · $1,824/yr
- HOA
- −$483
- Vacancy / Maint / Mgmt
- −$423
- Net cashflow
- $-73
Break-even live
Sensitivity live
| Price | -10% $12 | -5% $-30 | +0% $-73 | +5% $-115 | +10% $-158 |
|---|---|---|---|---|---|
| Rent | -10% $-232 | -5% $-152 | +0% $-73 | +5% $7 | +10% $87 |
| Rate | -1.0pp $3 | -0.5pp $-35 | base $-73 | +0.5pp $-112 | +1.0pp $-151 |
UW: 25.0% down · 7.5% · 30yr · 1.5% tax · 5.0% vac · 8.0% maint · 8.0% mgmt
Financing live
Cash to close
- Down payment
- $37,498
- Closing costs
- $4,500
- Reserves months
- —
- Total cash needed
- —
Loan-product check · same deal, 3 products live
Conventional
25% down · 7.5% · 30yr
- Down + closing
- —
- Monthly P&I
- —
- Monthly cashflow
- —
- DSCR
- —
- Eligible?
- —
Personal DTI + credit; lowest rate.
DSCR
20% down · 8.5% · 30yr
- Down + closing
- —
- Monthly P&I
- —
- Monthly cashflow
- —
- DSCR
- —
- Eligible?
- —
No personal income docs; deal must DSCR.
Hard money
10% down · 12.0% · 12mo
- Down + closing
- —
- Monthly P&I
- —
- Monthly cashflow
- —
- DSCR
- —
- Eligible?
- —
Short-term bridge; refi at stabilization.
Rent comps 40 comps
| Address | Beds | Baths | Sqft | Rent | $/sqft | DOM | Units | Dist |
|---|---|---|---|---|---|---|---|---|
| 19729 SW 114th Ave #150 Miami, FL | 2.0 | 2.0 | 800 | $1,980 | $2.48 | 23d | 1 | 0.05mi |
| 19751 SW 114th Ave Unit 347 Miami, FL | 2.0 | 2.0 | 800 | $1,875 | $2.34 | 26d | 1 | 0.05mi |
| 19729 SW 114th Ave #250 Miami, FL | 2.0 | 2.0 | 800 | $1,675 | $2.09 | 13d | 1 | 0.05mi |
| 19751 SW 114th Ave #349 Miami, FL | 2.0 | 2.0 | 800 | $1,790 | $2.24 | 7d | 1 | 0.05mi |
| 19751 SW 114th Ave Miami, FL | 2.0 | 2.0 | 800 | $1,812 | $2.27 | 19d | 2 | 0.05mi |
| 19715 SW 114th Ave #352 Miami, FL | 2.0 | 2.0 | 800 | $1,700 | $2.12 | 26d | 1 | 0.05mi |
| 19771 SW 114th Ave #328 Miami, FL | 2.0 | 2.0 | 800 | $1,900 | $2.38 | 19d | 1 | 0.05mi |
| 19729 SW 114th Ave #150 Miami, FL | 2.0 | 2.0 | 800 | $1,980 | $2.48 | 9d | 1 | 0.05mi |
| 19791 SW 114th Ave Miami, FL | 2.0 | 2.0 | 800 | $1,700 | $2.12 | 9d | 2 | 0.05mi |
| 19841 SW 114th Ave #310 Miami, FL | 2.0 | 2.0 | 800 | $1,750 | $2.19 | 26d | 1 | 0.05mi |
| 11307 SW 200th St Unit 106B Miami, FL | 2.0 | 2.0 | 840 | $1,900 | $2.26 | 22d | 1 | 0.09mi |
| 11309 SW 200th St Unit 103C Miami, FL | 2.0 | 2.0 | 840 | $2,100 | $2.50 | 26d | 1 | 0.09mi |
| 11301 SW 200th St Unit 108A Miami, FL | 1.0 | 1.5 | 703 | $1,449 | $2.06 | 23d | 1 | 0.12mi |
| 11301 SW 200th St Unit 104A Miami, FL | 1.0 | 1.5 | 703 | $1,600 | $2.28 | 12d | 1 | 0.12mi |
| 19800 SW 110th Ct Cutler Bay, FL | 1.0 | 1.0 | 625 | $1,572 | $2.52 | 5d | 1 | 0.28mi |
| 20221 SW 112th Ct Unit 2 Miami, FL | 1.0 | 1.0 | 607 | $1,300 | $2.14 | 6d | 1 | 0.34mi |
| 20221 SW 112th Ct Unit 2 Miami, FL | 1.0 | 1.0 | 607 | $1,300 | $2.14 | 26d | 1 | 0.34mi |
| 11040 SW 196th St #412 Cutler Bay, FL | 2.0 | 2.0 | 809 | $2,200 | $2.72 | 16d | 1 | 0.44mi |
| 11040 SW 196th St Cutler Bay, FL | 2.0 | 2.0 | 809 | $2,070 | $2.56 | 7d | 2 | 0.44mi |
| 11060 SW 196th St Cutler Bay, FL | 2.0 | 2.0 | 861 | $1,862 | $2.16 | 22d | 3 | 0.45mi |
| 11060 SW 196th St Cutler Bay, FL | 2.0 | 2.0 | 861 | $1,950 | $2.26 | 7d | 2 | 0.45mi |
| 11060 SW 196th St Cutler Bay, FL | 2.0 | 2.0 | 861 | $1,950 | $2.26 | 26d | 2 | 0.45mi |
| 11050 SW 196th St #103 Cutler Bay, FL | 2.0 | 2.0 | 809 | $1,950 | $2.41 | 23d | 1 | 0.45mi |
| 19800 SW 103rd Ct #201 Cutler Bay, FL | 2.0 | 2.0 | 921 | $2,250 | $2.44 | 3d | 1 | 0.77mi |
| 20225 SW 106th Ave Cutler Bay, FL | 3.0 | 1.0 | 968 | $2,650 | $2.74 | 22d | 1 | 0.87mi |
| 19701 SW 103rd Ct Unit 19701 Cutler Bay, FL | 3.0 | 1.0 | 1044 | $2,600 | $2.49 | 26d | 1 | 0.88mi |
| 11750 SW 186th St Miami, FL | 3.0 | 1.0 | 864 | $2,400 | $2.78 | 21d | 1 | 0.92mi |
| 11750 SW 186th St Miami, FL | 3.0 | 1.0 | 864 | $2,400 | $2.78 | 0d | 1 | 0.92mi |
| 12235 SW 202nd St Unit 12235 Miami, FL | 3.0 | 1.0 | 1125 | $2,750 | $2.44 | 26d | 1 | 0.97mi |
| 11930 SW 187th St Unit 1 Miami, FL | 1.0 | 1.0 | 580 | $1,400 | $2.41 | 26d | 1 | 0.99mi |
| 12230 SW 203rd St Miami, FL | 3.0 | 1.0 | 1050 | $2,800 | $2.67 | 26d | 1 | 1.00mi |
| 12230 SW 203rd St Miami, FL | 3.0 | 1.0 | 1050 | $2,800 | $2.67 | 4d | 1 | 1.00mi |
| 12230 SW 203rd St Miami, FL | 3.0 | 1.0 | 1050 | $2,800 | $2.67 | 5d | 1 | 1.00mi |
| 11840 SW 212th St Unit 11840 Miami, FL | 2.0 | 1.0 | 1104 | $1,700 | $1.54 | 26d | 1 | 1.03mi |
| 11920 SW 212th St Unit 11920 Miami, FL | 2.0 | 1.0 | 1100 | $2,200 | $2.00 | 9d | 1 | 1.09mi |
| 19362 SW 103rd Ct Unit B Cutler Bay, FL | 3.0 | 2.0 | 974 | $2,600 | $2.67 | 6d | 1 | 1.10mi |
| 19362 SW 103rd Ct Unit B Cutler Bay, FL | 3.0 | 2.0 | 974 | $2,600 | $2.67 | 26d | 1 | 1.10mi |
| 11611 SW 215th St Unit 11611 Miami, FL | 2.0 | 1.0 | 756 | $2,000 | $2.65 | 26d | 1 | 1.10mi |
| 18305 SW 110th Ave Unit 18305 (Bldg 1) -109 Miami, FL | 2.0 | 2.0 | 986 | $2,430 | $2.46 | 26d | 1 | 1.14mi |
| 10363 SW 207th Ter #10363 Cutler Bay, FL | 3.0 | 1.0 | 1015 | $2,400 | $2.36 | 26d | 1 | 1.19mi |
HOA detail condo
- Monthly dues
- $483 · $5,796/yr
- Assessments
- None detected in remarks — confirm with the listing agent.
Listing history 17 events
-
2026-06-21days on market $149,990 Active 146 DOM
-
2026-06-18days on market $149,990 Active 143 DOM
-
2026-06-17days on market $149,990 Active 142 DOM
-
2026-06-16days on market $149,990 Active 141 DOM
-
2026-06-15days on market $149,990 Active 140 DOM
-
2026-06-13days on market $149,990 Active 138 DOM
-
2026-06-09days on market $149,990 Active 134 DOM
-
2026-06-08days on market $149,990 Active 133 DOM
-
2026-06-07days on market $149,990 Active 132 DOM
-
2026-06-04days on market $149,990 Active 129 DOM
-
2026-06-03days on market $149,990 Active 128 DOM
-
2026-06-02days on market $149,990 Active 127 DOM
-
2026-06-01days on market $149,990 Active 126 DOM
-
2026-05-31days on market $149,990 Active 125 DOM
-
2026-01-26$149,990 Active
-
1998-04-27soldstatus $24,000
-
1977-07-01soldstatus $21,400
ⓘ Source: listings_history table (triggers on properties + properties_extension) + one-shot
backfill from property_details.listing_events for pre-trigger history.
Tax reassessment forecast FL · Resets to sale price
- Current annual tax
- $2,174 · $181/mo
- Projected year-2 tax
- $2,174 · $181/mo
- Expected delta
- $0/yr ($0/mo · 0.0%)
ⓘ Screening estimate from a state-policy table — verify with the county assessor before closing.
Climate risk First Street
- Flood 5/10 Major FEMA zone AH · 24% chance over 30 yrs
- Wildfire 1/10 Low
- Heat 10/10 Extreme 7 d/yr ≥105°F today · 29 d/yr by 30 yrs out
- Wind 10/10 Extreme 99% chance of damaging wind over 30 yrs
- Air quality 2/10 Low 1 unhealthy d/yr today · 1 by 30 yrs out
Nearby sold comps map
Loading sold comps map…
Walkable amenities ~0.75 mi
Loading nearby amenities…
Taxation est. · year 1
- Rental income
- $24,192
- − Mortgage interest
- −$8,402
- − Property taxes
- −$2,174
- − Insurance
- −$2,574
- − Repairs & maintenance
- −$1,935
- − Management
- −$1,935
- − HOA
- −$5,796
- − Depreciation
- −$4,363
- Taxable loss
- −$2,989
- Est. tax savings @ 24.0%
- +$717
- After-tax cash flow
- $-155/yr
For passive investors: Depreciation is non-cash, so a rental often shows a tax loss while cash-flowing — sheltering income. Rental losses are passive: they offset passive income freely, and up to $25,000/yr can offset ordinary (W-2) income if you actively participate and your MAGI is under $100k (phasing out to $0 by $150k); unused losses carry forward. On sale, claimed depreciation is recaptured at up to 25%, and gains may owe capital-gains tax (a 1031 exchange can defer both). Figures are a year-1 estimate at your 24.0% rate — not tax advice; consult a CPA.
Schools (NCES district)
- District
- Miami-Dade
- NCES district ID
- 1200390
- Math proficiency
- 45% ▼ -16.00%
- Reading proficiency
- 54% ▼ -5.00%
- Median HH income
- $43,928
- Composite
- 41.76/100
- National rank
- #3397
- State rank
- #40 of 73 in FL
Livability — South Miami Heights
- Score
- 78/100
- State rank
- #169
- US rank
- #2539
Category grades
Schools grade is shown separately in the Schools card above.
Census & demographics
- Census place
- South Miami Heights, FL
- County
- Miami-Dade County · 2,697,751 people
- Metro
- Miami-Fort Lauderdale-Pompano Beach, FL
- Population (ZIP)
- 70,596
- Household income
- $81,589
- Rent vs Own
- Severe rent burden
- 2340.0
Population outlook (Miami-Dade County) Hauer SSP2
- Today (2025)
- 3,126,439 people
- By 2030
- 3,325,765 · +6.4%
- By 2040
- 3,697,561 · +18.3%
- By 2050
- 4,012,134 · +28.3%
- By 2075
- 4,605,612 · +47.3%
- By 2100
- 4,866,598 · +55.7%
Race, ethnicity, and origin ACS 2023
- Neighborhood character
- Diverse neighborhood (Simpson 0.61)
- Race & ethnicity
- Hispanic / Latino 56% Two or more races 33% Black 19% White 19% Asian 2%
- Hispanic origin (detail)
- Mexican 2% Puerto Rican 3% Cuban 30% Dominican 1%
- Common ancestry
- Hispanic 2% Lithuanian 1% Romanian 1%
- Foreign-born
- 42% · Canada, Jamaica, China
- Languages at home
- 43% English-only · Spanish 52% French/Haitian/Cajun 2% Other Indo-European 1%
Political lean MEDSL · Miami-Dade
- 2024 margin
- R (+11.4) · D 43.9% · R 55.4%
- 2008→2024 swing
- -27.6pp toward R · 2008: 16.1pp · 2024: -11.4pp
- All cycles
- 2024: R+11.4 2020: D+7.3 2016: D+29.6 2012: D+23.7 2008: D+16.1
Not yet ingested
- Civics
- —
Market trends
- HPI YoY
- ▼ -457.85%
- Current HPI
- 481.93
- Rent YoY
- ▼ -0.75%
- Metro
- Miami-Fort Lauderdale-Pompano Beach, FL
- State GDP YoY
- ▲ 3.28%
- F500 in state
- 36
Industry mix (Fortune 500 HQ in FL)
| Industry | F500 HQs | Revenue |
|---|---|---|
| Industrial Technology | 2 | $29B |
|
||
| Insurance | 2 | $17B |
|
||
| Retail | 1 | $60B |
|
||
| Technology Distribution | 1 | $58B |
|
||
| Homebuilding | 1 | $35B |
|
||
| Technology Manufacturing | 1 | $35B |
|
||
Price history
+600.9% since first listed3 events — show timeline
- 2026-01-26 Listed $149,990 MARMLS
- 1998-04-27 Sold (Public Records) $24,000 Public Records
- 1977-07-01 Sold (Public Records) $21,400 Public Records
Property tax history
+12.6%/yrLatest (2025): $2,174 · +4.8% YoY. Source: county tax records.
Cash-flow waterfall
monthlySold comps — $/sqft
last 12 mo · ≤1 miLoading sold comps…