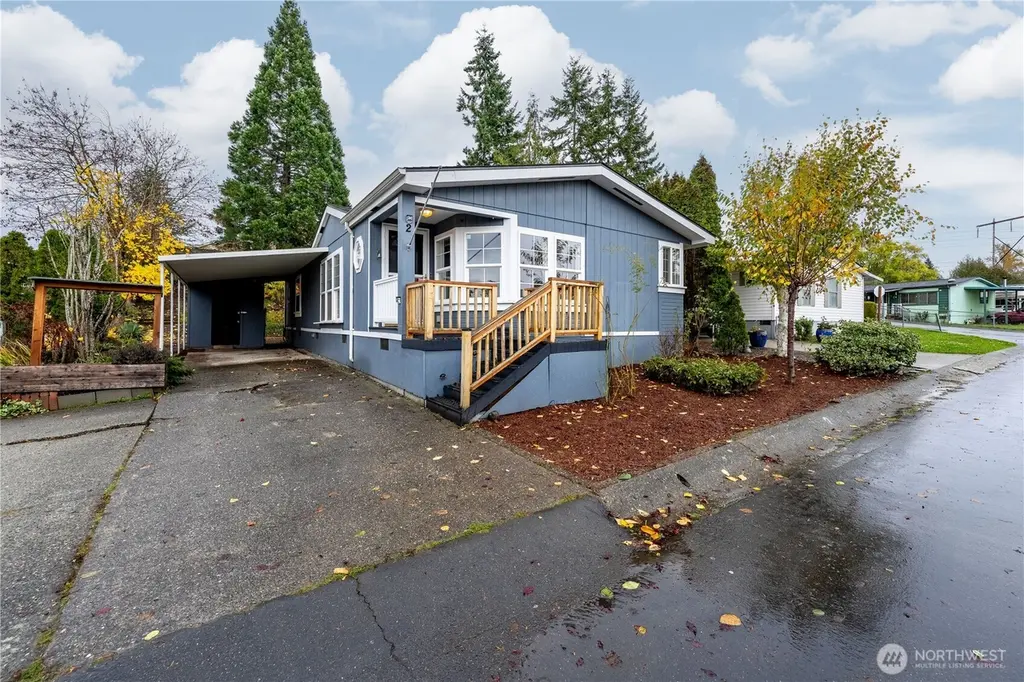
704 87th Ave NE #2 · Lake Stevens, WA
Flood risk No data
- FEMA flood zone
- —
- Chance of flooding over 30 yrs
- —
- Est. flood insurance / yr
- —
Fire risk No data
- Est. fire insurance / yr
- —
Heat risk No data
- Hot days now (above threshold)
- —
- Hot days in 30 yrs
- —
Wind risk No data
- Chance of severe wind over 30 yrs
- —
Air-quality risk No data
- Unhealthy air days now
- —
- Unhealthy air days in 30 yrs
- —
Risk factors via First Street. Map © Google.
Why this score? — see what drove the A- grade
The composite is a weighted blend of 9 inputs, each scored 0–100. Each bar is that input's sub-score; the figure is the points it added to the 100-point composite (weight × sub-score).
- Cash flow +30.0/30.0
- ARV discount +15.0/15.0
- 1% rule +10.0/10.0
- DSCR +10.0/10.0
- Schools +5.8/10.0
- Livability +4.2/5.0
- Rent growth +2.5/5.0
- Condition / age +2.5/5.0
- Appreciation +0.0/10.0
$195,000
🖨 Deal sheet (PDF) 📄 Offer letter ✓ Due diligence
Listing remarks
Welcome to the Serene Neighborhood of Westview Estates. Tucked just between the Trestle & Highway 9. This prime Lake Stevens spot delivers privacy with all essentials mere blocks away. Stroll to Frontier Village. This house has a NEW ROOF & Skylights, Stainless Steel appliances & NEW Exterior paint. Rebuilt front porch & back deck- plus premium upgrades throughout. This home feels warm from the moment you step in. Tons of storage inside & out with covered back deck & shed. Jetted tub in primary bath. Master Bedroom has a convenient slider to the back deck. Cozy wood stove for chilly nights. Top-rated school district w/ endless exploration nearby. Move-in
Key facts
- New exterior paint
- Back deck
- Skylights
Tags
Neighborhood map
What this means for you Summary
Snapshot
- This is a 2-bed/2.0-bath manufactured listed at $195k.
Deal economics
- At list price, monthly cash flow is $1k ($14k/yr) — positive.
- The deal already cash-flows at list — no discount required.
- Meets the 1% rule at list price ($3k rent vs $195k).
- Recommended offer: $172k (12.0% below list) — sets the bar for market timing.
- Cap rate 13.3% vs local median 2.8% in Lake Stevens — top-decile yield for the area; either an underpriced asset or a hidden risk that comps aren't pricing in. Stress-test before assuming the spread holds.
Location & tenants
- Location reads 83/100 on livability (#51 in WA, #917 nationally) — a professional / high-income tenant draw. Strengths: crime A+, employment A+, housing A+; Watch: amenities C-, cost of living F.
- Lake Stevens School District (suburban): math 57% / reading 70% proficiency, ranked #31 of 291 in WA (top 11%) — acceptable for families but not a draw, mixed tenant base, ~2y average lease.
- Market conditions: Rents flat; 422 active listings in the ZIP; 8 comparable units currently listed for rent nearby; rentals at typical pace (median 26d on market — plan ~3-4 weeks tenant-placement turnaround); high-income renter base; 3,982 units permitted in Snohomish County in 2024 (1,492 in 5+ unit buildings).
Forward outlook
- Local home prices are declining (-3.0%/yr); year-one equity from $1k of loan paydown is wiped out by about $6k of value loss. Plan a longer hold.
- Snohomish County population projected at +30% by 2050 — long-run rental-demand tailwind backs the buy-and-hold thesis.
- At projected returns (-3.0% appreciation + 0.2% rent growth), your $55k cash investment doubles in ~6 years — after that, you're playing with house money.
Negotiation context
- It's been on market 192 days — a 12% lower offer ($172k) is reasonable based on typical stale-listing flexibility.
- 6 sale attempts since 19y ago; this cycle's ask has dropped $35k (15%) from the opening price — seller is motivated, your offer sets the floor, not the list.
Questions for the listing agent
- It's been on market 192 days. Have you received any prior offers? Is the seller open to a 12% concession, seller financing, or rate buy-down credit?
- Why hasn't it sold? Are there any deal-killer items the seller is aware of (foundation, flood, title, zoning, code violations)?
- Is there a deadline driving the sale (1031 exchange, divorce, estate, relocation)? That informs how much negotiation room exists.
- Schools are B-rated — typically a magnet for longer-tenancy family renters. What's the average tenant stay here, and is there a school-zone premium baked into asking?
- What's the average days-on-market for RENTAL listings here right now (not sales)? A rising rental-DOM trend means longer vacancies and softer asking-rent achievability than the comps imply.
- What's the recent tenant-quality profile in this submarket — average credit score on applications, eviction rate, late-payment / NSF rate, and stable-employment percentage? A property-management company in the area should have these aggregated.
- How much new for-sale + rental construction is in the pipeline within 1–3 miles? Heavy new supply typically softens prices + rents 12–24 months out; constrained supply supports both.
Investment metrics
- 1% rule
- 1.54% ✓
- Cap rate
- 13.28%
- Cash-on-cash
- 24.95%
- DSCR
- 2.11
- GRM
- 5.4
CMA / ARV
- ARV (median comp)
- $238,937
- List price
- $195,000
- Delta
- -18.39%
- Verdict
- UNDERPRICED
- Comps
- 3 within 1.0 mi
Show comp detail 1 sale within ~0.75 mi
| Address | Dist | Beds/Ba | Sqft | Sold | Price | $/sf | Match |
|---|---|---|---|---|---|---|---|
| 704 87th Ave NE #33 | 0.00mi | 2/2.0 | 1,228 (-6%) | 15mo | $152,600 | $124 | 77 |
Match score weights: distance 35% · size 25% · config 20% · recency 20%. Top-matched comps best support the ARV.
Projected returns pro-forma
-3.0% appreciation · 0.19% rent growth · sell at horizon
- IRR
- 15.3%
- Equity multiple
- 1.59×
- Total profit
- $32,401
- Equity at exit
- $29,075
- IRR
- 21.9%
- Equity multiple
- 2.63×
- Total profit
- $89,120
- Equity at exit
- $16,860
Cash invested: $54,600 (down + closing). Projections, not guarantees.
Landlord ↔ Tenant lean methodology
- Overall (STATE)
- 28 Tenant-Leaning
- State Washington
- 28 Tenant-Leaning · D+8
- County
- — inherits STATE
- City
- — inherits STATE
ZIP-level market 98258
- Rents YoY
- 0.2%
- Active inventory
- 422
- Price-to-rent
- 5.4×
Monthly cashflow live
- Estimated rent
- $3,010 high interval (Pro) →
- Mortgage (P&I)
- −$1,023
- Tax from tax record
- −$139 /mo · $1,666/yr
- Insurance
- −$81
- HOA
- −$0
- Vacancy / Maint / Mgmt
- −$632
- Net cashflow
- $1,135
Break-even live
Sensitivity live
| Price | -10% $1,246 | -5% $1,190 | +0% $1,135 | +5% $1,080 | +10% $1,025 |
|---|---|---|---|---|---|
| Rent | -10% $897 | -5% $1,016 | +0% $1,135 | +5% $1,254 | +10% $1,373 |
| Rate | -1.0pp $1,233 | -0.5pp $1,185 | base $1,135 | +0.5pp $1,085 | +1.0pp $1,033 |
UW: 25.0% down · 7.5% · 30yr · 1.5% tax · 5.0% vac · 8.0% maint · 8.0% mgmt
Financing live
Cash to close
- Down payment
- $48,750
- Closing costs
- $5,850
- Reserves months
- —
- Total cash needed
- —
Loan-product check · same deal, 3 products live
Conventional
25% down · 7.5% · 30yr
- Down + closing
- —
- Monthly P&I
- —
- Monthly cashflow
- —
- DSCR
- —
- Eligible?
- —
Personal DTI + credit; lowest rate.
DSCR
20% down · 8.5% · 30yr
- Down + closing
- —
- Monthly P&I
- —
- Monthly cashflow
- —
- DSCR
- —
- Eligible?
- —
No personal income docs; deal must DSCR.
Hard money
10% down · 12.0% · 12mo
- Down + closing
- —
- Monthly P&I
- —
- Monthly cashflow
- —
- DSCR
- —
- Eligible?
- —
Short-term bridge; refi at stabilization.
Rent comps 8 comps
| Address | Beds | Baths | Sqft | Rent | $/sqft | DOM | Units | Dist |
|---|---|---|---|---|---|---|---|---|
| 816 96th Ave NE Unit A Lake Stevens, WA | 2.0 | 1.0 | 900 | $2,100 | $2.33 | 13d | 1 | 0.52mi |
| 9504 Chapel Hill Rd Lake Stevens, WA | 3.0 | 2.5 | 1340 | $2,950 | $2.20 | 6d | 1 | 0.68mi |
| 1611 Vernon Rd Unit B Lake Stevens, WA | 1.0 | 1.0 | 920 | $2,800 | $3.04 | 45d | 1 | 0.72mi |
| 1619 Vernon Rd Lake Stevens, WA | 1.0 | 1.5 | 1851 | $4,195 | $2.27 | 45d | 1 | 0.78mi |
| 1619 Vernon Rd Lake Stevens, WA | 1.0 | 1.5 | 1851 | $3,800 | $2.05 | 18d | 1 | 0.78mi |
| 610 103rd Ct SE Lake Stevens, WA | 3.0 | 2.5 | 1870 | $3,400 | $1.82 | 21d | 1 | 1.26mi |
| 8609 Soper Hill Rd Unit D133 Marysville, WA | 3.0 | 2.5 | 1565 | $3,000 | $1.92 | 45d | 1 | 1.31mi |
| 7815 14th St SE Lake Stevens, WA | 3.0 | 2.5 | 1587 | $3,100 | $1.95 | 25d | 1 | 1.43mi |
Listing history 33 events
-
2026-06-21days on market $195,000 Active 192 DOM
-
2026-06-18days on market $195,000 Active 189 DOM
-
2026-06-17days on market $195,000 Active 188 DOM
-
2026-06-16days on market $195,000 Active 187 DOM
-
2026-06-15days on market $195,000 Active 186 DOM
-
2026-06-13days on market $195,000 Active 184 DOM
-
2026-06-13days on market $195,000 Active 183 DOM
-
2026-06-09days on market $195,000 Active 180 DOM
-
2026-06-08days on market $195,000 Active 179 DOM
-
2026-06-07days on market $195,000 Active 178 DOM
-
2026-06-04days on market $195,000 Active 175 DOM
-
2026-06-03days on market $195,000 Active 174 DOM
-
2026-06-02days on market $195,000 Active 173 DOM
-
2026-06-01days on market $195,000 Active 172 DOM
-
2026-05-31days on market $195,000 Active 171 DOM
-
2026-05-06price $195,000
-
2026-04-11price $220,000
-
2026-03-20status Active
-
2026-02-14status Pending
-
2025-11-07$230,000 Active
-
2023-06-26soldstatus $217,000 Closed
-
2023-05-05status Pending
-
2023-05-02status Active
-
2023-04-25status Pending
-
2023-04-07$237,500 Active
-
2014-04-18historical
-
2014-04-18soldstatus $42,000 Sold
-
2014-04-16status Pending
-
2014-03-28status Pending Inspection
-
2014-03-16$42,000 Active
-
2007-08-15soldstatus $55,000
-
2007-07-15historical
-
2007-07-11$55,000
ⓘ Source: listings_history table (triggers on properties + properties_extension) + one-shot
backfill from property_details.listing_events for pre-trigger history.
Tax reassessment forecast WA · Resets to sale price
- Current annual tax
- $1,666 · $139/mo
- Projected year-2 tax
- $1,911 · $159/mo
- Expected delta
- +$245/yr (+$20/mo · 14.7%)
ⓘ Screening estimate from a state-policy table — verify with the county assessor before closing.
Nearby sold comps map
Loading sold comps map…
Walkable amenities ~0.75 mi
Loading nearby amenities…
Taxation est. · year 1
- Rental income
- $36,119
- − Mortgage interest
- −$10,923
- − Property taxes
- −$1,666
- − Insurance
- −$975
- − Repairs & maintenance
- −$2,889
- − Management
- −$2,889
- − Depreciation
- −$5,673
- Taxable income
- $11,103
- Est. tax owed @ 24.0%
- −$2,665
- After-tax cash flow
- $10,957/yr
For passive investors: Depreciation is non-cash, so a rental often shows a tax loss while cash-flowing — sheltering income. Rental losses are passive: they offset passive income freely, and up to $25,000/yr can offset ordinary (W-2) income if you actively participate and your MAGI is under $100k (phasing out to $0 by $150k); unused losses carry forward. On sale, claimed depreciation is recaptured at up to 25%, and gains may owe capital-gains tax (a 1031 exchange can defer both). Figures are a year-1 estimate at your 24.0% rate — not tax advice; consult a CPA.
Schools (NCES district)
- District
- Lake Stevens School District
- NCES district ID
- 5304200
- Math proficiency
- 57% ▼ -2.00%
- Reading proficiency
- 70% ▬ 0.00%
- Median HH income
- $78,301
- Composite
- 58.12/100
- National rank
- #2141
- State rank
- #31 of 291 in WA
Livability — Lake Stevens
- Score
- 83/100
- State rank
- #51
- US rank
- #917
Category grades
Schools grade is shown separately in the Schools card above.
Census & demographics
- Census place
- Lake Stevens, WA
- County
- Snohomish County · 786,756 people
- City population
- 52,752
- Metro
- Seattle-Tacoma-Bellevue, WA
- Population (ZIP)
- 52,752
- Household income
- $123,898
- Rent vs Own
- Severe rent burden
- 786.0
Population outlook (Snohomish County) Hauer SSP2
- Today (2025)
- 899,800 people
- By 2030
- 960,975 · +6.8%
- By 2040
- 1,074,447 · +19.4%
- By 2050
- 1,171,954 · +30.2%
- By 2075
- 1,384,849 · +53.9%
- By 2100
- 1,497,296 · +66.4%
Race, ethnicity, and origin ACS 2023
- Neighborhood character
- Predominantly White (73%)
- Race & ethnicity
- White 73% Hispanic / Latino 12% Two or more races 11% Asian 6% Black 2%
- Hispanic origin (detail)
- Mexican 7%
- Common ancestry
- Portuguese 7% Italian 3% Slovak 2%
- Foreign-born
- 10% · Canada, Vietnam, China
- Languages at home
- 87% English-only · Spanish 5% Russian/Polish/Slavic 2% Other Indo-European 1%
Political lean MEDSL · Snohomish
- 2024 margin
- D (+19.0) · D 57.8% · R 38.9% · Other 3.3%
- 2008→2024 swing
- +0.1pp no change · 2008: 18.9pp · 2024: 19.0pp
- All cycles
- 2024: D+19.0 2020: D+20.6 2016: D+16.6 2012: D+16.2 2008: D+18.9
Not yet ingested
- Civics
- —
Market trends
- HPI YoY
- ▼ -725.77%
- Current HPI
- 303.8934
- Rent YoY
- ▲ 0.19%
- Metro
- Seattle-Tacoma-Bellevue, WA
- State GDP YoY
- ▲ 4.65%
- F500 in state
- 22
Industry mix (Fortune 500 HQ in WA)
| Industry | F500 HQs | Revenue |
|---|---|---|
| Retail | 2 | $269B |
|
||
| Technology / Retail | 1 | $638B |
|
||
| Technology | 1 | $245B |
|
||
| Telecommunications | 1 | $38B |
|
||
| Food / Beverage | 1 | $36B |
|
||
| Automotive / Trucks | 1 | $34B |
|
||
Price history
+254.5% since first listed18 events — show timeline
- 2026-05-06 Price Changed $195,000 NWMLS as Distributed by MLS Grid
- 2026-04-11 Price Changed $220,000 NWMLS as Distributed by MLS Grid
- 2026-03-20 Relisted — NWMLS as Distributed by MLS Grid
- 2026-02-14 Pending — NWMLS as Distributed by MLS Grid
- 2025-11-07 Listed $230,000 NWMLS as Distributed by MLS Grid
- 2023-06-26 Sold (MLS) $217,000 NWMLS as Distributed by MLS Grid
- 2023-05-05 Pending — NWMLS as Distributed by MLS Grid
- 2023-05-02 Relisted — NWMLS as Distributed by MLS Grid
- 2023-04-25 Pending — NWMLS as Distributed by MLS Grid
- 2023-04-07 Listed $237,500 NWMLS as Distributed by MLS Grid
- 2014-04-18 Delisted — NWMLS as Distributed by MLS Grid
- 2014-04-18 Sold (MLS) $42,000 NWMLS as Distributed by MLS Grid
- 2014-04-16 Pending — NWMLS as Distributed by MLS Grid
- 2014-03-28 Pending — NWMLS as Distributed by MLS Grid
- 2014-03-16 Listed $42,000 NWMLS as Distributed by MLS Grid
- 2007-08-15 Sold (MLS) $55,000 NWMLS as Distributed by MLS Grid
- 2007-07-15 Delisted — NWMLS as Distributed by MLS Grid
- 2007-07-11 Listed $55,000 NWMLS as Distributed by MLS Grid
Property tax history
+6.2%/yrLatest (2026): $1,666 · +35.0% YoY. Source: county tax records.
Cash-flow waterfall
monthlySold comps — $/sqft
last 12 mo · ≤1 miLoading sold comps…